While cities in the North like Delhi, Agra, Varanasi make the news regularly over dangerous air quality, those in the South like Bengaluru, Chennai and Hyderabad get a relatively easy pass as their air quality looks better in comparison. However, with more vehicles plying the roads than Delhi, with regular power cuts needing operation of Diesel Generator (DG) sets, and relentless construction contributing dust, the quality in Bengaluru cannot be considered “safe” by most measures. If not now, the air quality is an issue in the making.

Bengaluru Air Quality Datajam
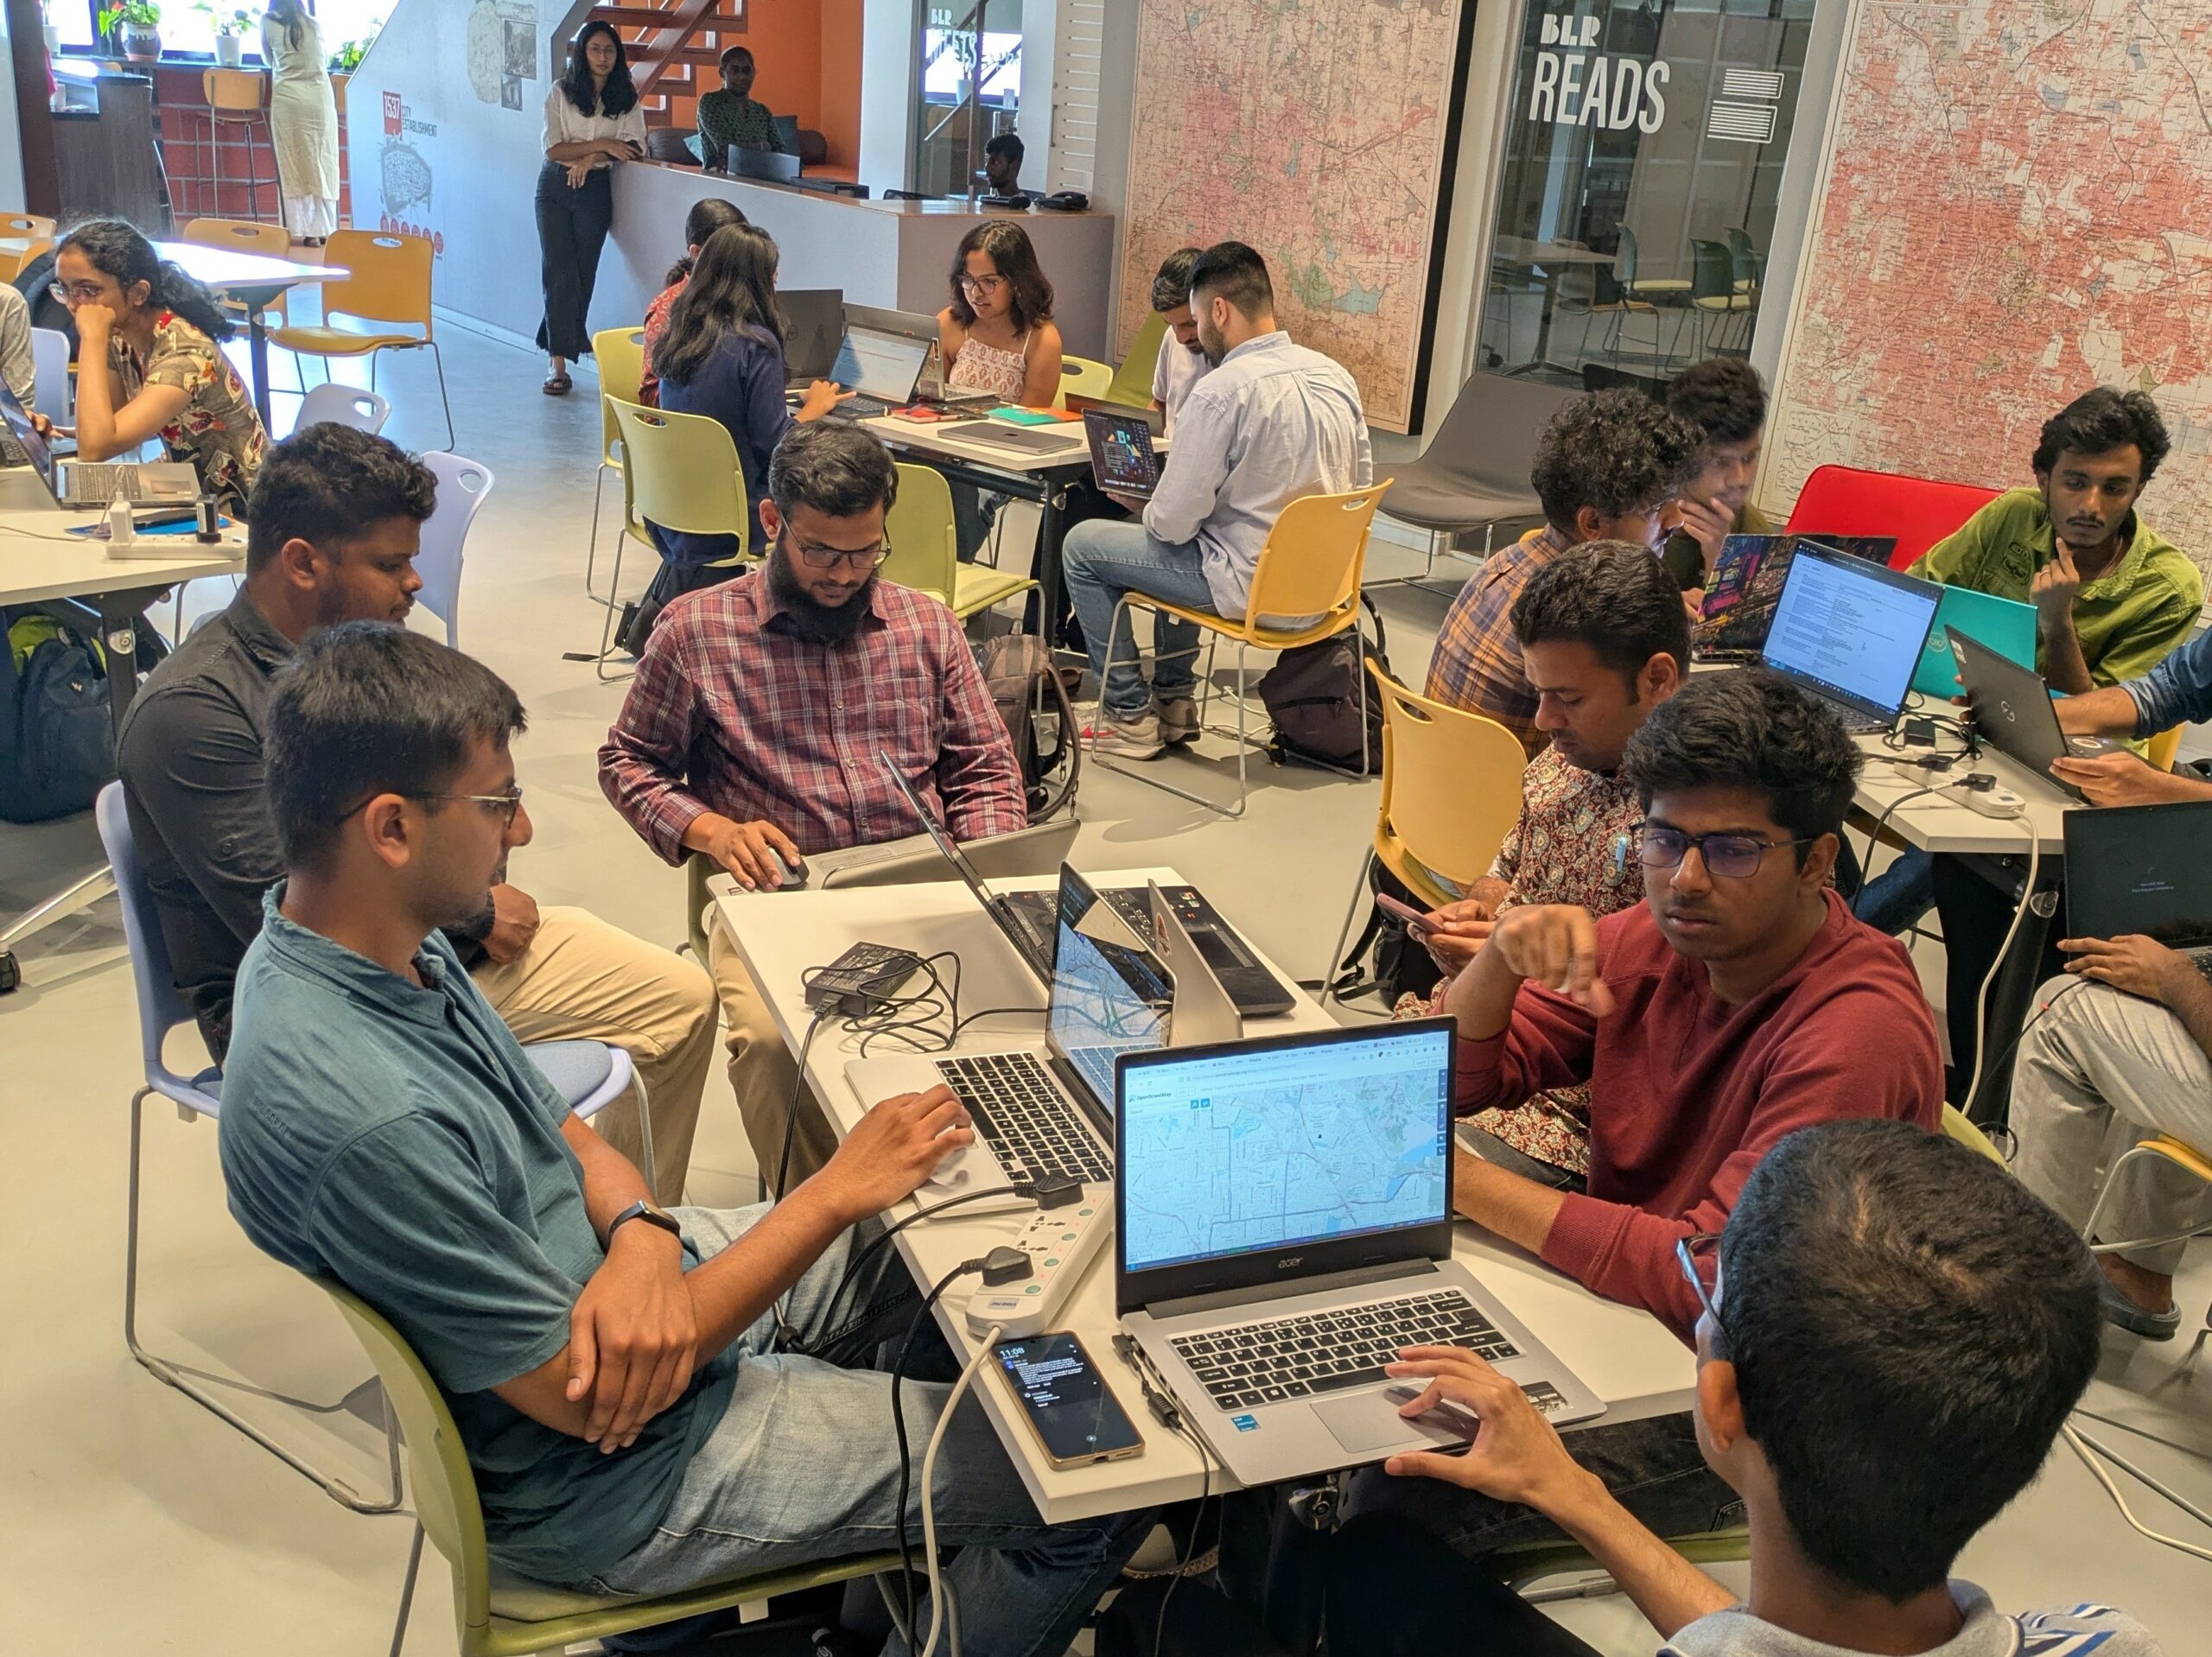
It is in this context that OpenCity.in organised the “Bengaluru Air Quality” Datajam in the Bengaluru Design Centre at Church Street, Bengaluru – 560001. The Center for Study of Science, Technology and Policy (CSTEP), Sensing Local, MOD Foundation and UrbanEmissions.info were the partners for the event. MOD Foundation were also the event partners providing their venue for the datajam.

Twenty-five participants from diverse backgrounds – GIS, Data analysis, statistics, policy, students, academia participated in the day long event and looked at various aspects of air quality and how it affects life in Bengaluru. The participants were split into four teams who came up with their different problem statements.

Problem Statements
The problem statements chosen by the four teams were:
- Effect of Air Quality on Metro Rail ridership.
- Do poorer road networks lead to poor air quality because of circuitous commutes?
- Comparison of a residential area vs industrial and how the air quality in each is affected by land use, with a comparison of Peenya and Jayanagar.
- Linking air quality and real estate prices, and developing an air quality rating for each ward based on different parameters that affect air quality.


Outputs
Effect of Air Quality on Metro Rail Ridership
Team comprising Aakash, Charan, Gautam, Nikhil, Ranjith and Samridh tried to correlate air quality data with that of Metro ridership in Bengaluru.

For their analysis they looked at the metro ridership data from Kaggle and KSPCB Air quality monitors data for four months from October 2024 to January 2025. The data from four monitors close to metro stations were analysed.
They found that as the air quality worsened there was a marginally higher uptake of the metro and on better air quality days there was a corresponding decrease. However, they noted that the correlation wasn’t as high as would be seen in a city like Delhi where poor air quality is a lot more visible.

Effect of Road Networks on Air Quality
Team comprising Aditya, Sireesh, Sreeshma and Vivek looked at whether a better road network like in the older parts of Bengaluru has a calming effect on air quality while the lack of it like in the eastern and south-eastern parts makes it worse.

For their analysis they looked at the monitors along different parts of the Outer-Ring-Road and correlated it with the number of vehicles passing through those locations. The hypothesis was that areas with poor road network where traffic gets funneled into corridors should have worse air quality than the inverse.

They found that while there was no such correlation to be seen, sensors in residential areas were reporting much higher AQI values than those at major traffic hotspots like Central Silk Board. They wondered if the sensors were reporting correctly and were following correct standards when it comes to installation and monitoring.
Geospatial analysis of industrial area vs residential area, correlating it with urban form and AQI
Anjali, Anshu, Druid, Mahi, Rekha and Vijaydev tried to correlate the urban built form with AQI by comparing two areas – Jayanagar which is predominantly residential and Peenya which is predominantly industrial.

They looked at various parameters for the two areas like public transport usage, presence of green areas like parks, parking, weather, industries etc and correlated that with the AQI readings from the monitors in the two areas.
They noted that the AQI in Peenya was still less compared to areas like Central Silk Board. Causative factors like Urban Heat Island effect had become worse with an increase in annual temperature over the years. Encroachment of green areas was also in the news in nearby areas and that could cause the air quality to worsen.

Linking Real Estate Prices with Air Quality
Aman, Arjav, Devika, Fathima, Luqman and Nandini correlated the real prices in a ward with the air quality parameters. Instead of looking at just air quality monitor data, they analyzed causative factors like green covers for air quality.

With different causative parameters like green cover, built-up area density, presence of industries etc they tried to come up with a ward-level predictive air quality index which can tell you whether the air quality in a ward is likely to get better or worse.

Conclusions
The four teams looked at various aspects of air quality from effects to causative factors and how they might be impacting user behaviour. One of the points all four teams raised was that the data from the KSPCB Air Quality Monitors were not completely reliable, with residential areas showing poorer air quality than industrial or major traffic congestion hotspots.
Another important trend to emerge was the lack of air quality monitors across the city. KSPCB currently has eleven air quality monitors. The Eastern most is at Tin Factory with no other monitors to record the quality in areas like Marathahalli, HAL or Whitefield. Even in the South-East, the last monitor is at Silk Board with areas like HSR Layout, Sarjapura Road and Electronics City not having any monitors.
Sarath Guttikonda of UrbanEmissions.info pointed out this lack of monitors in his Master Class held the day before, noting that a city of Bengaluru’s size needs at least 41 monitors collecting air quality data. This under-representation as well as poor quality of monitors would mean any analysis of air quality in Bengaluru would be handicapped and yield poor quality results.
