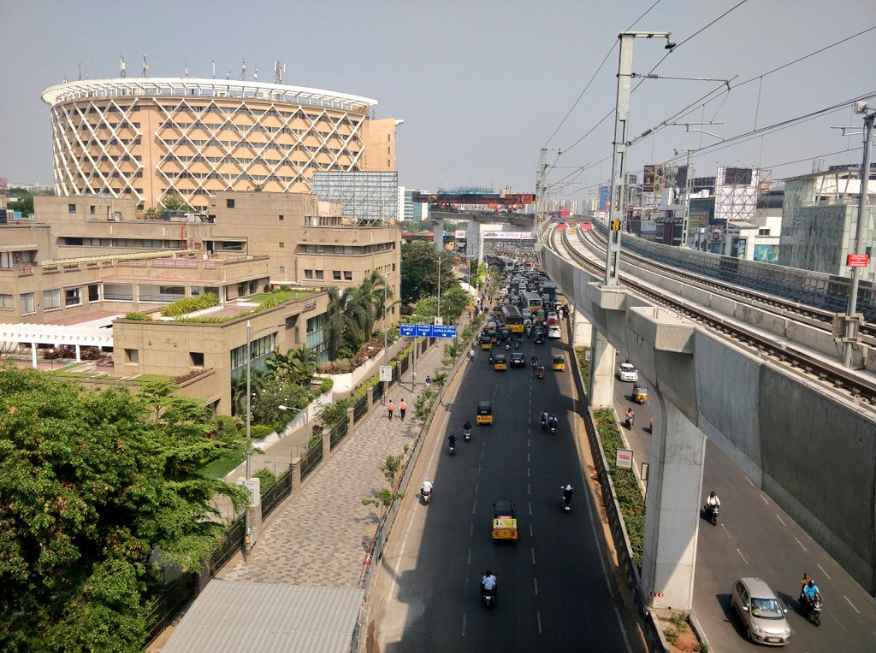
Hyderabad, a city synonymous with India’s burgeoning IT sector, has witnessed an unparalleled boom in recent decades. The very landscape of the city has been transformed, none more so than in areas like Kondapur Ward, no. 104 – a bustling stretch encompassing the high-tech corporate hubs of Hitech City, the rapidly developing Kondapur, and the historically dense, unplanned settlements of Premnagar. While this growth signals prosperity, it also tells a less celebrated story: that of a city getting progressively hotter, creating a starkly unequal burden on its residents.
Our geospatial analysis of Ward 104, spanning a critical decade from 2014 to 2024, reveals how unchecked urbanization is intensifying the Urban Heat Island (UHI) effect. More profoundly, satellite data highlights how this escalating heat is not a uniform burden, but one disproportionately shouldered by different socio-economic strata within the very same ward.
Ward Profile as per the 2011 census:
| Ward No | 104 |
| Ward Name | Kondapur |
| Assembly Constituency | Serilingampally |
| Population | 57,005 |
| Male | 29,480 |
| Female | 27,525 |
| SC Population | 6,438 |
| ST Population | 1,515 |
The Urban Heat Island: An Invisible, Growing Threat
The Urban Heat Island effect is a phenomenon where metropolitan areas become significantly warmer than their surrounding rural environments. This isn’t just about hot weather; it’s a consequence of concrete jungles replacing green spaces, darker surfaces absorbing more solar radiation, and human activities generating waste heat. The ramifications are serious: increased energy consumption for cooling, compromised public health (especially for vulnerable populations), and a tangible decline in urban liveability.
To map this complex reality in Ward 104, our study employed satellite imagery and advanced remote sensing indices: Land Surface Temperature (LST), Urban Heat Island (UHI) Intensity, the Normalized Difference Vegetation Index (NDVI) for greenness, and the Normalized Difference Built-up Index (NDBI) for built-up density. We also utilized a Blue-Green Infrastructure map to pinpoint existing natural cooling assets.
A Tale of Two Landscapes: Socio-Economic Divide Visible from Space
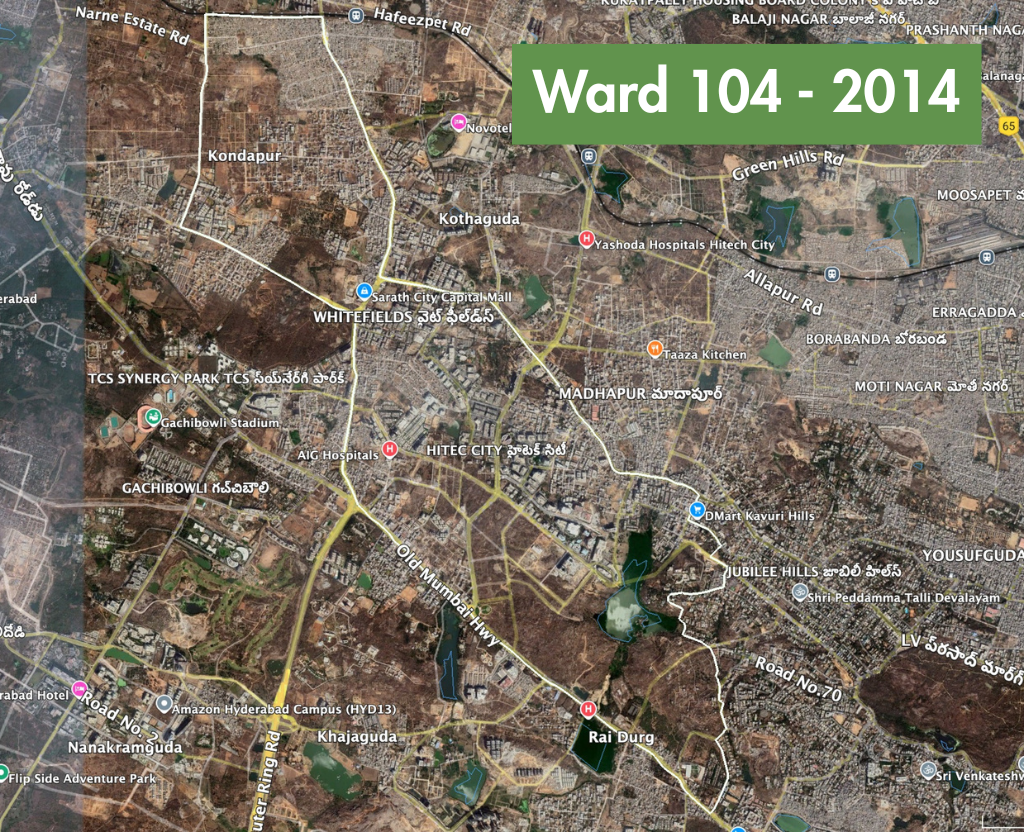
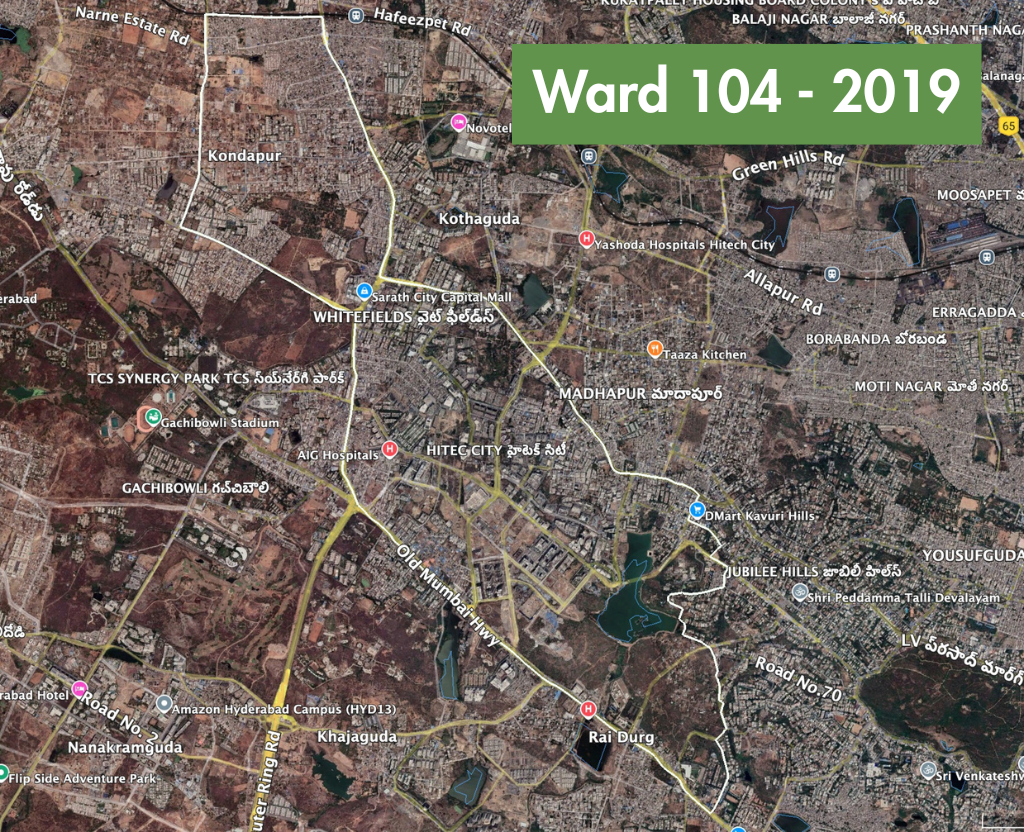
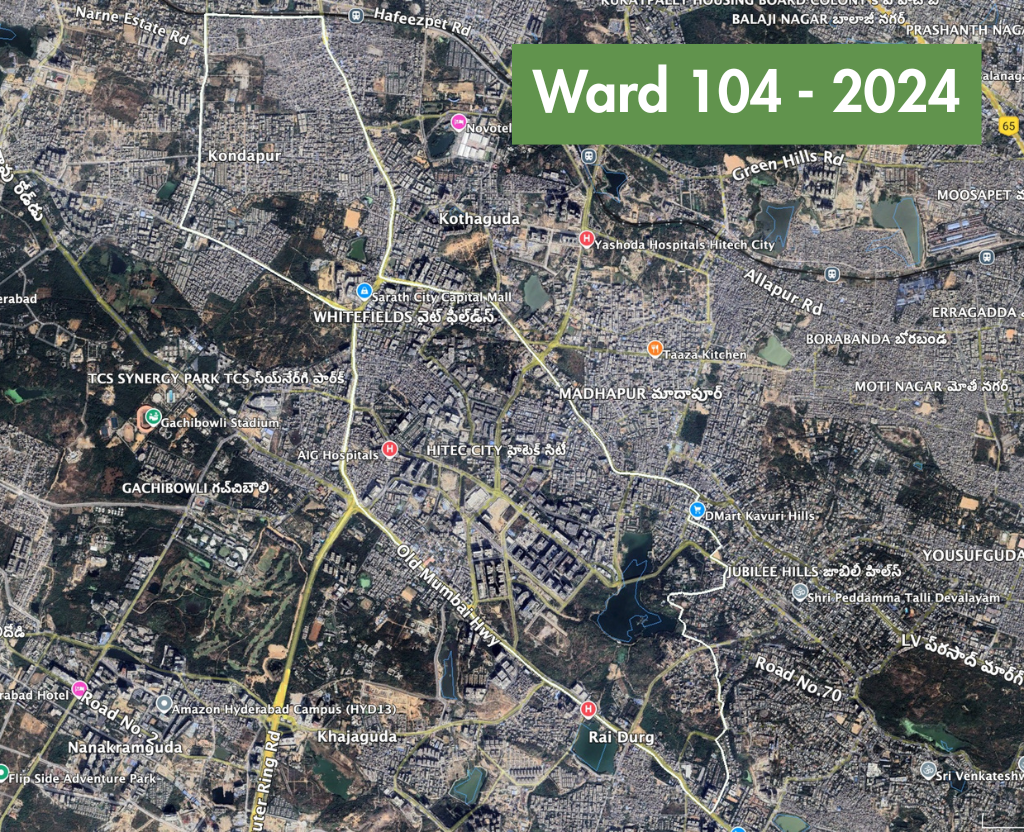
The satellite images of Ward 104, particularly when viewed across the decade, offer an immediate and powerful insight into its contrasting socio-economic fabric.
- In the upper right section of the ward, within the white boundary, lies Premnagar (also known as Prem Bazar). Here, the landscape is characterized by its organic, dense growth: a maze of closely packed, low to mid-rise residential buildings with virtually no visible open spaces or planned green infrastructure. This is home to a significant population, often with diverse income levels, living in a highly congested environment.
- Contrast this with the lower part of the ward, dominated by Hitech City. Here, the scene is one of modern high-rises, expansive corporate campuses, and more structured, planned layouts. While certainly dense, Hitech City features larger building footprints, wider roads, and some interspersed patches of landscaping – a hallmark of high-value commercial and affluent residential development.
Land Surface Temperature (LST) Reveals the Hotspots

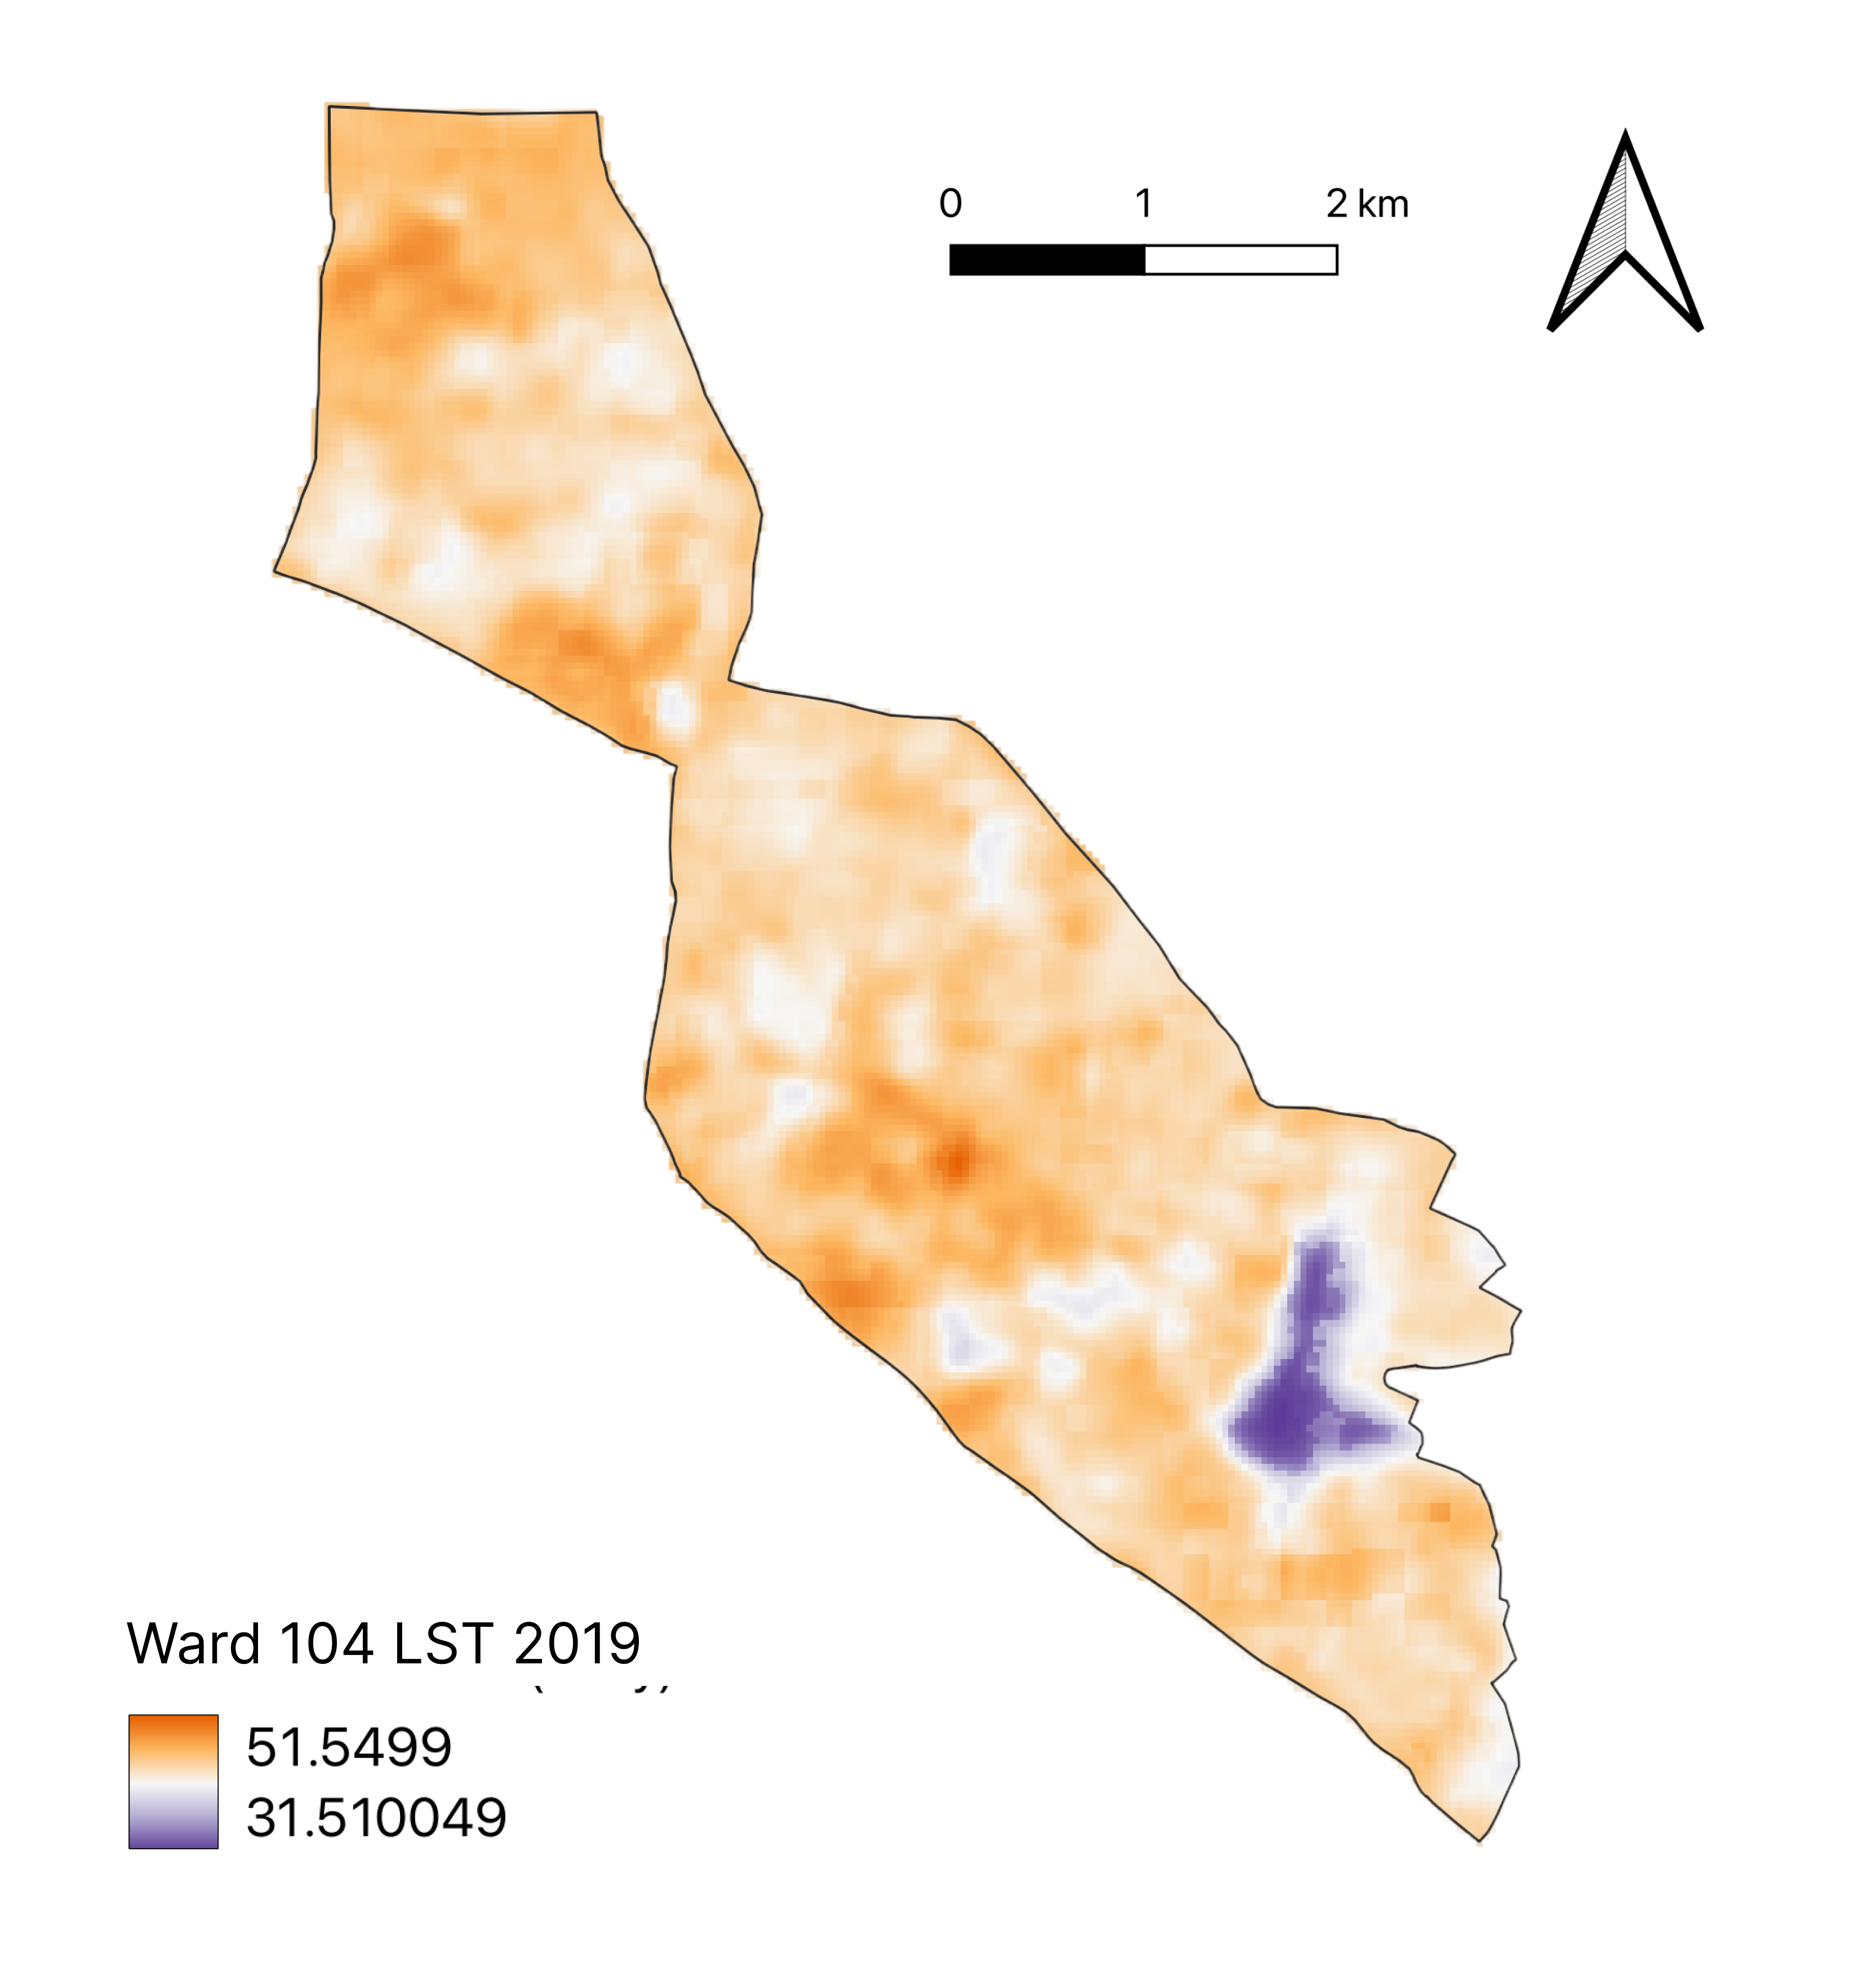
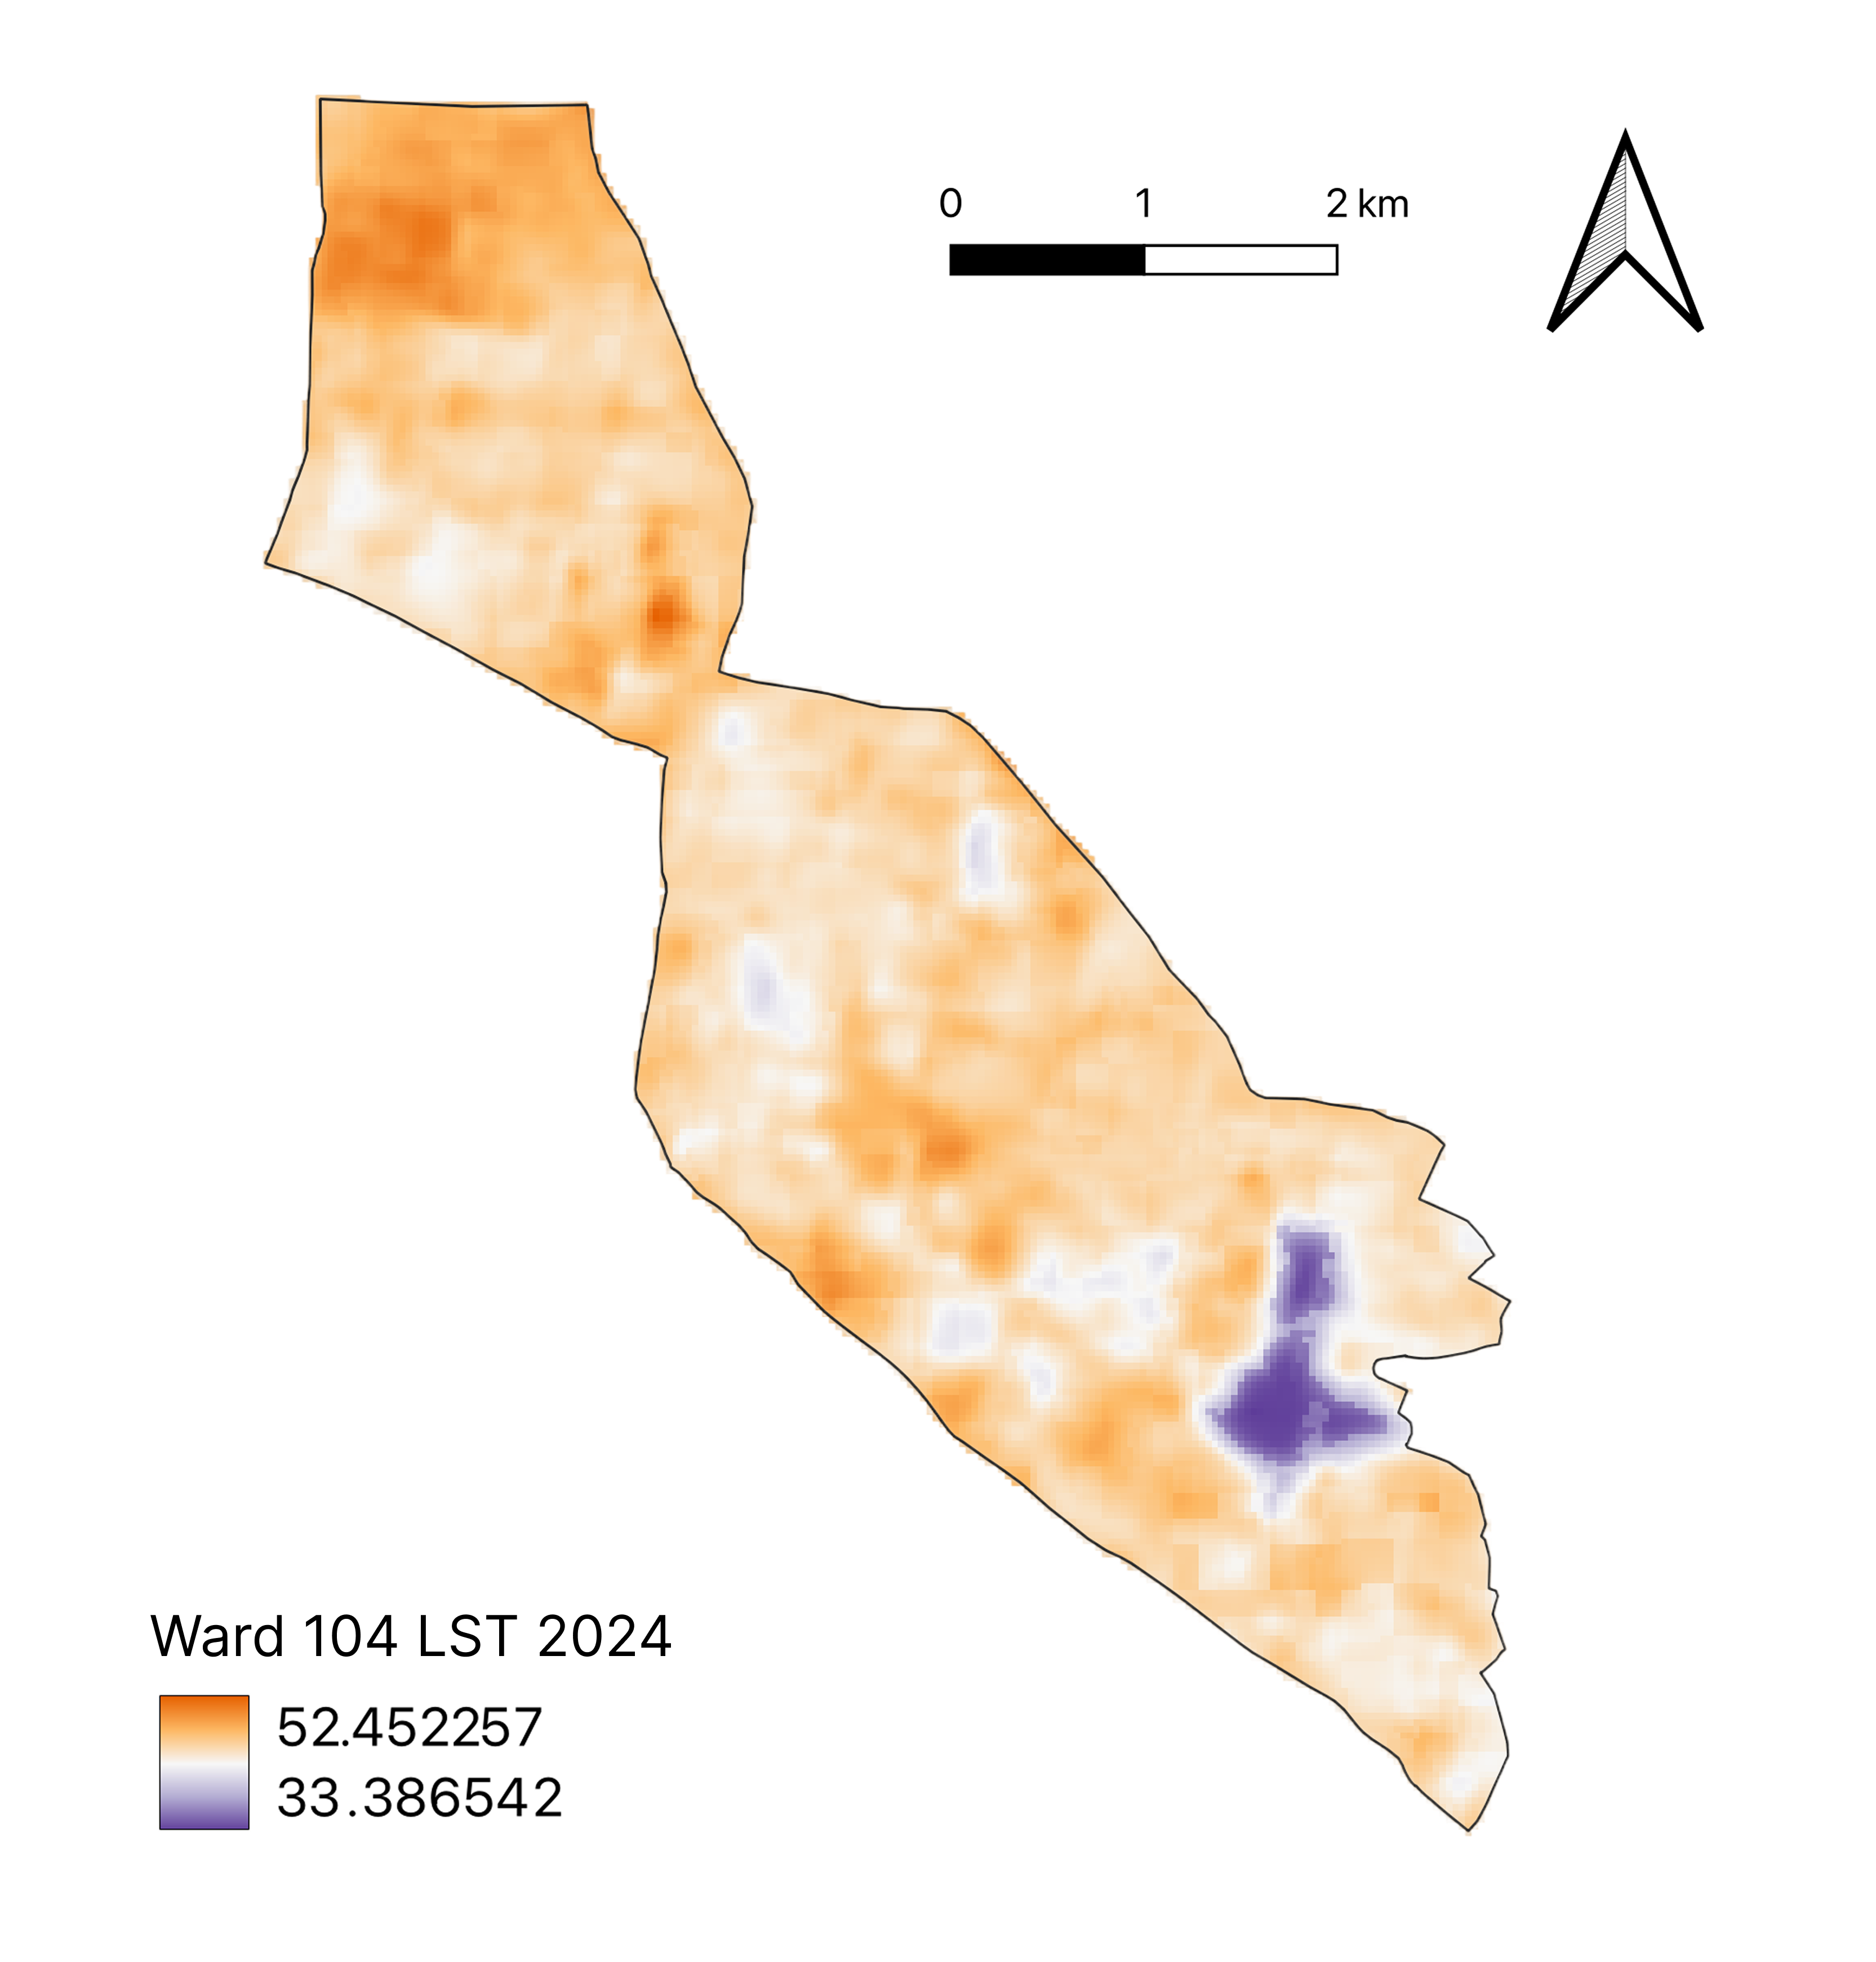
Our Land Surface Temperature (LST) maps translate these visual differences into thermal realities. They show how hot the surfaces of Ward 104 actually get. In 2014, LST values ranged from approximately 34.6°C to 47.5°C. By 2019, the maximum LST had alarmingly climbed to 51.5°C, to reach a scorching 52.5°C in 2024.Crucially, these maps reveal a consistent pattern: Premnagar and its surrounding congested areas consistently register among the highest surface temperatures within the ward, appearing as the deepest orange and red hues.
This contrasts sharply with some pockets within Hitech City, which, despite their modern high-rises, often show slightly lower LSTs due to differences in building materials and some planned greening. The vibrant blue/purple area in the lower right, a persistent cool spot across all years, is the refreshing presence of Durgam Cheruvu lake (A tourist place also).
The Unequal Heat Burden: Urban Heat Island (UHI) Intensity
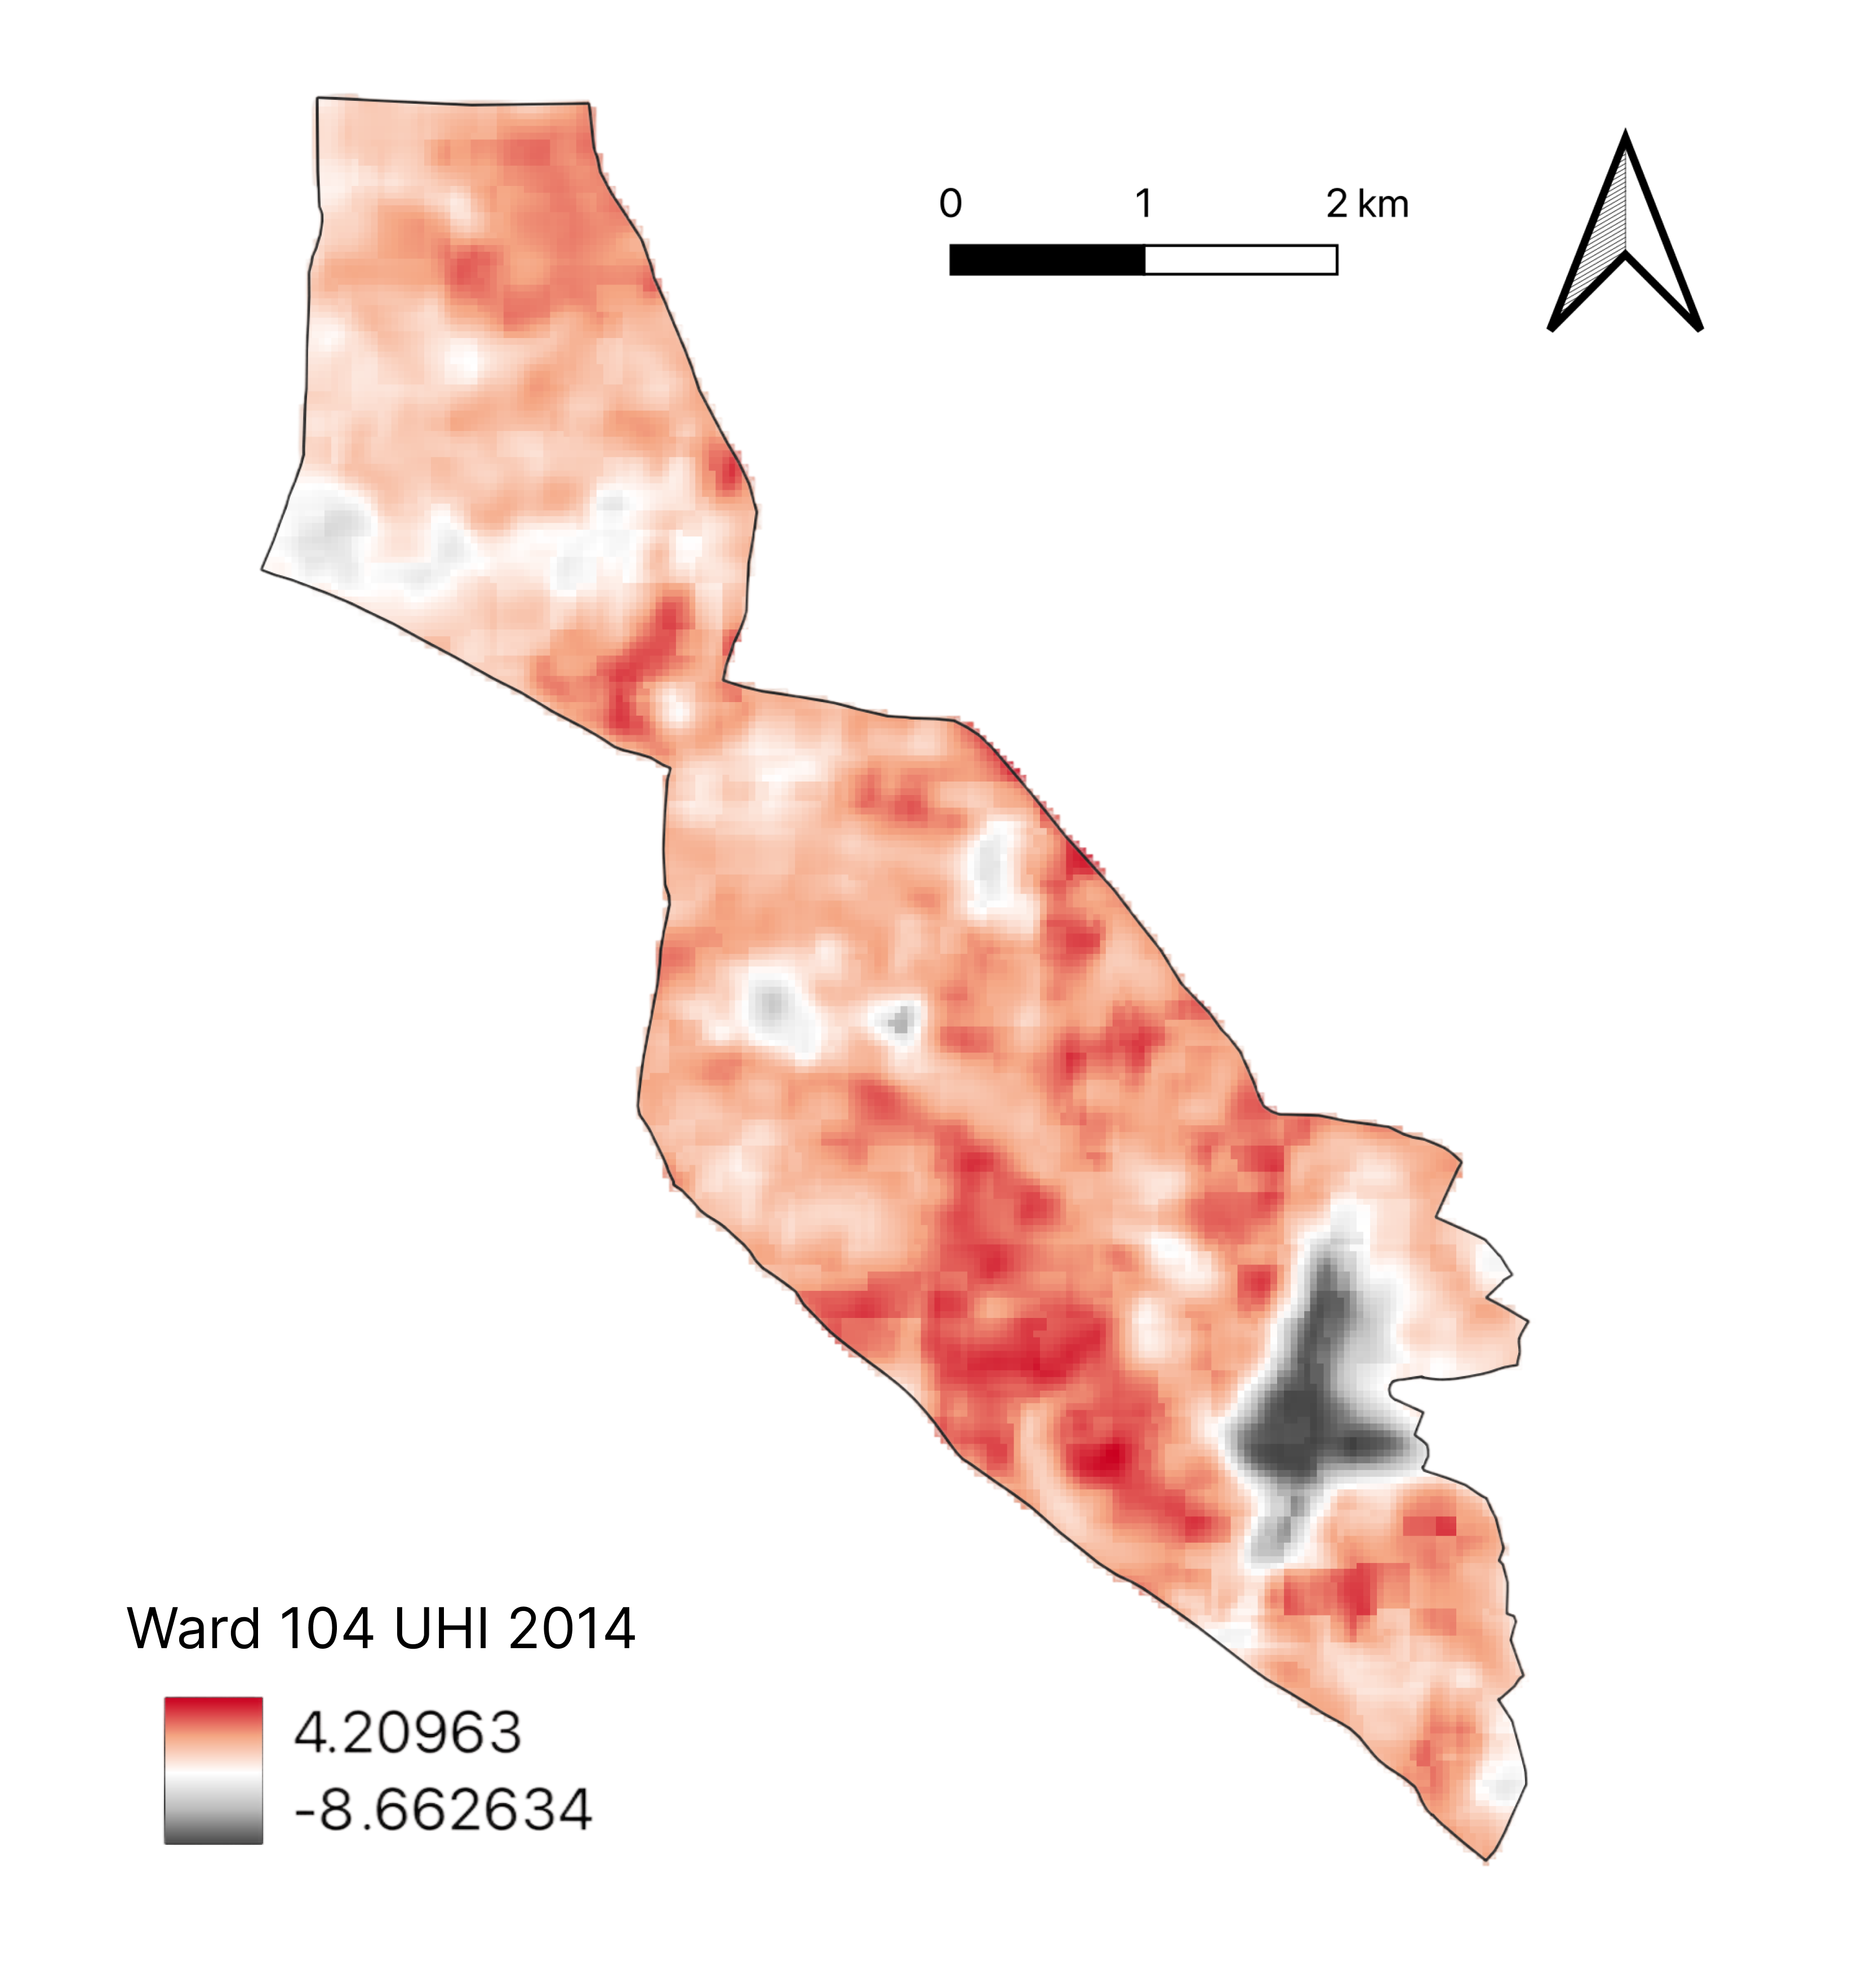
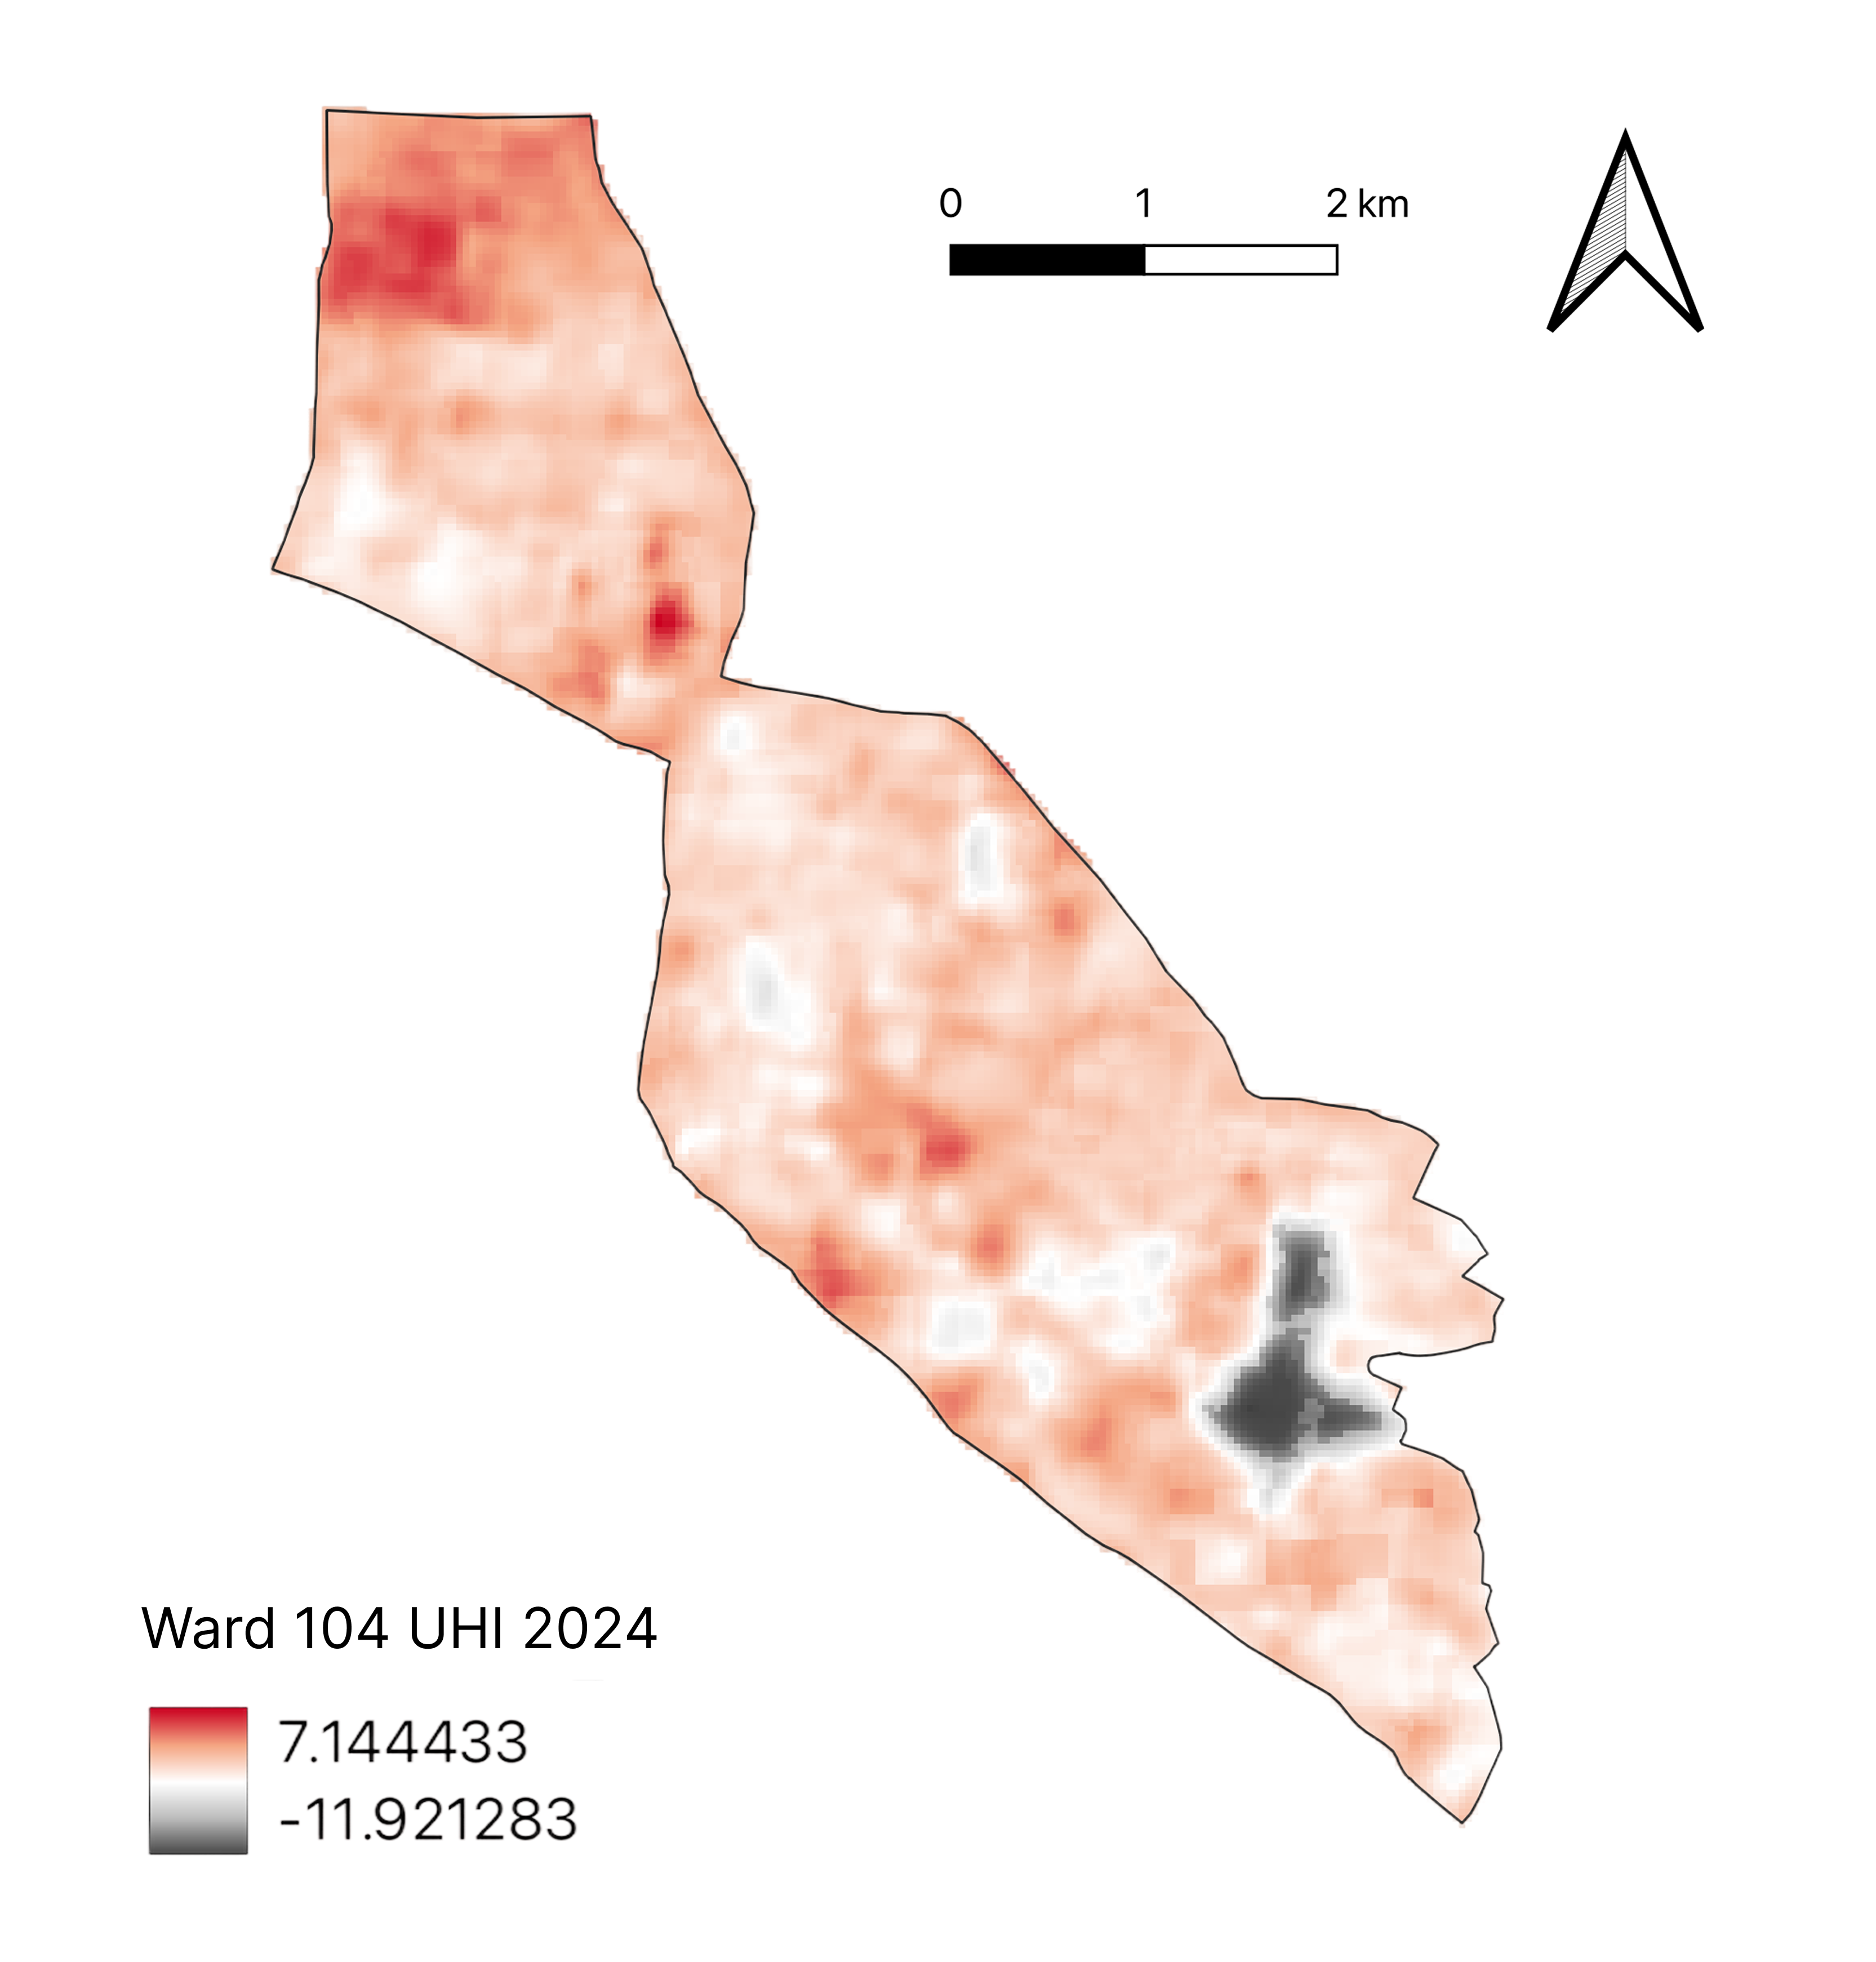
The Urban Heat Island Intensity (UHI) is the measured temperature difference between an urban area and its surrounding rural or non-urban landscape. It maps quantify the true extent of the problem by measuring how much warmer urban areas are compared to their less developed surroundings. In 2014, the UHI intensity in Ward 104 peaked around 4.2°C. But by 2019, this peak dramatically surged to nearly 7.4°C, maintaining a significant 7.1°C in 2024.
The visual evidence is undeniable: the congested areas of Premnagar consistently exhibit higher UHI intensity, indicating that these tightly packed residential zones are experiencing the most severe heat amplification. Their lack of open space, combined with an abundance of heat-absorbing materials, creates a potent heat trap. While Hitech City also contributes to the overall UHI effect, the localized intensity within Premnagar points to a disproportionate environmental burden on its residents.
The Drivers: Concrete Reigns, Greenery Recedes
The underlying causes of this escalating and uneven heat are clearly illuminated by our NDBI and NDVI maps.
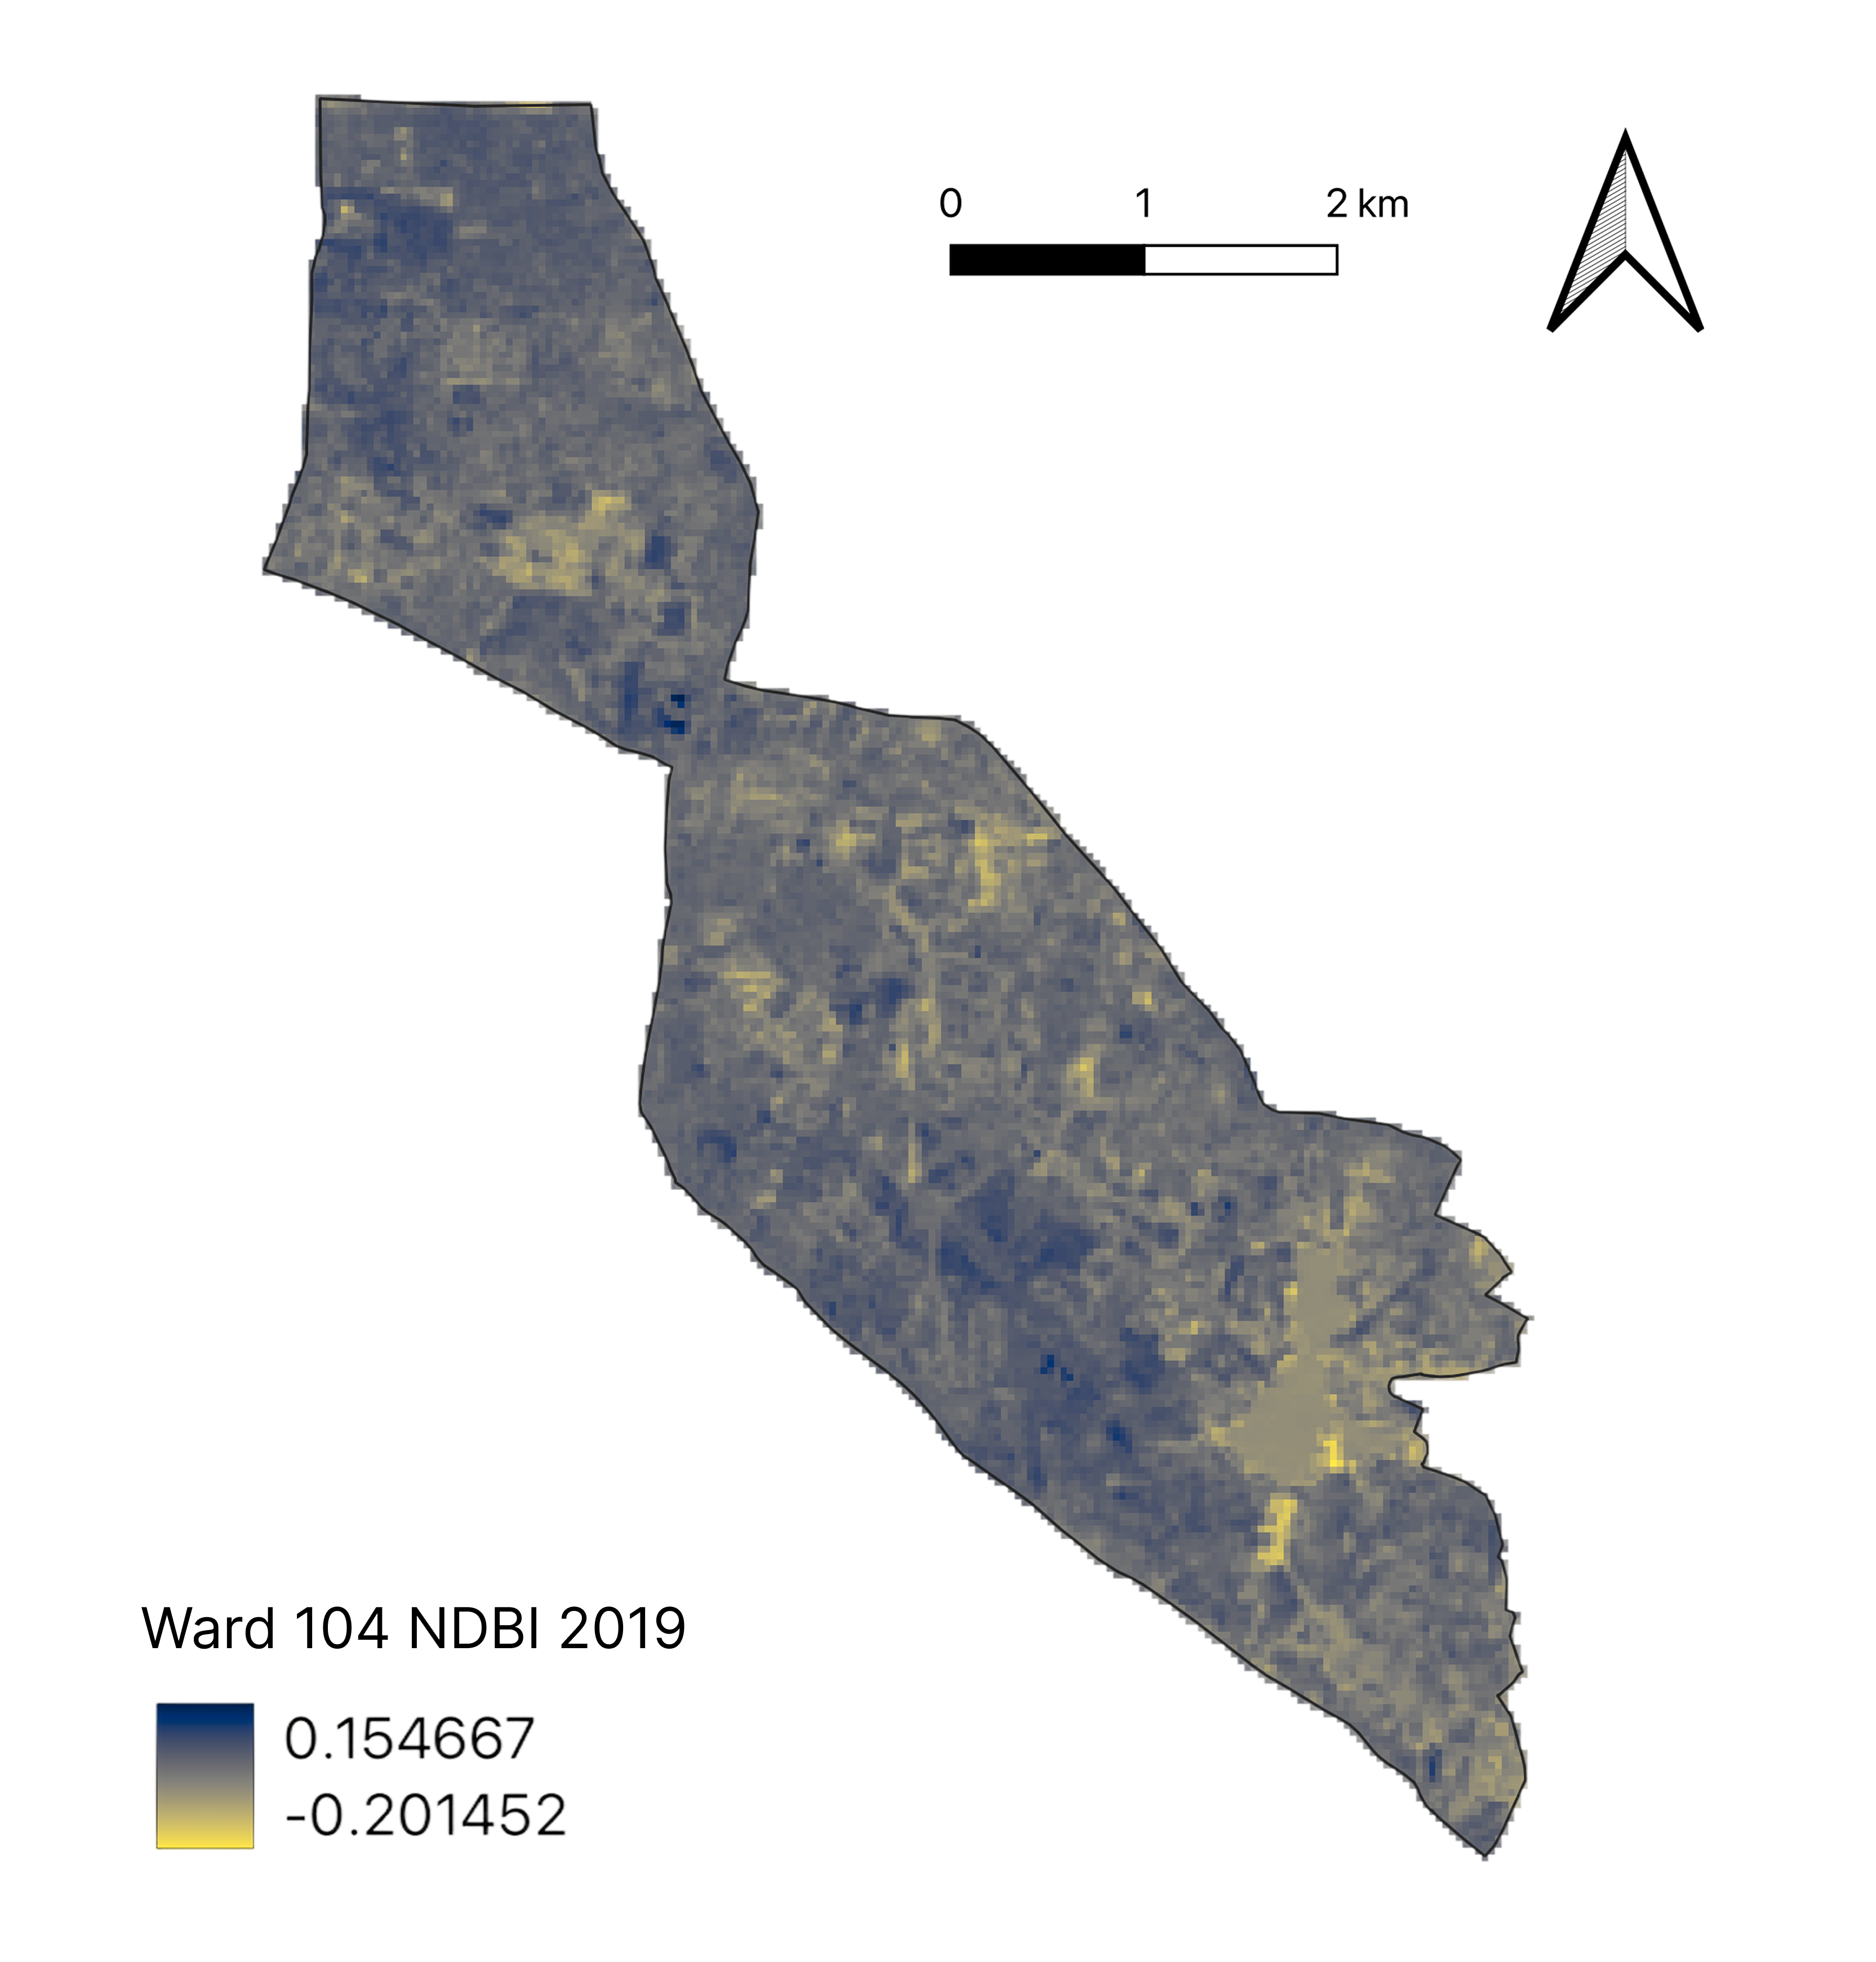
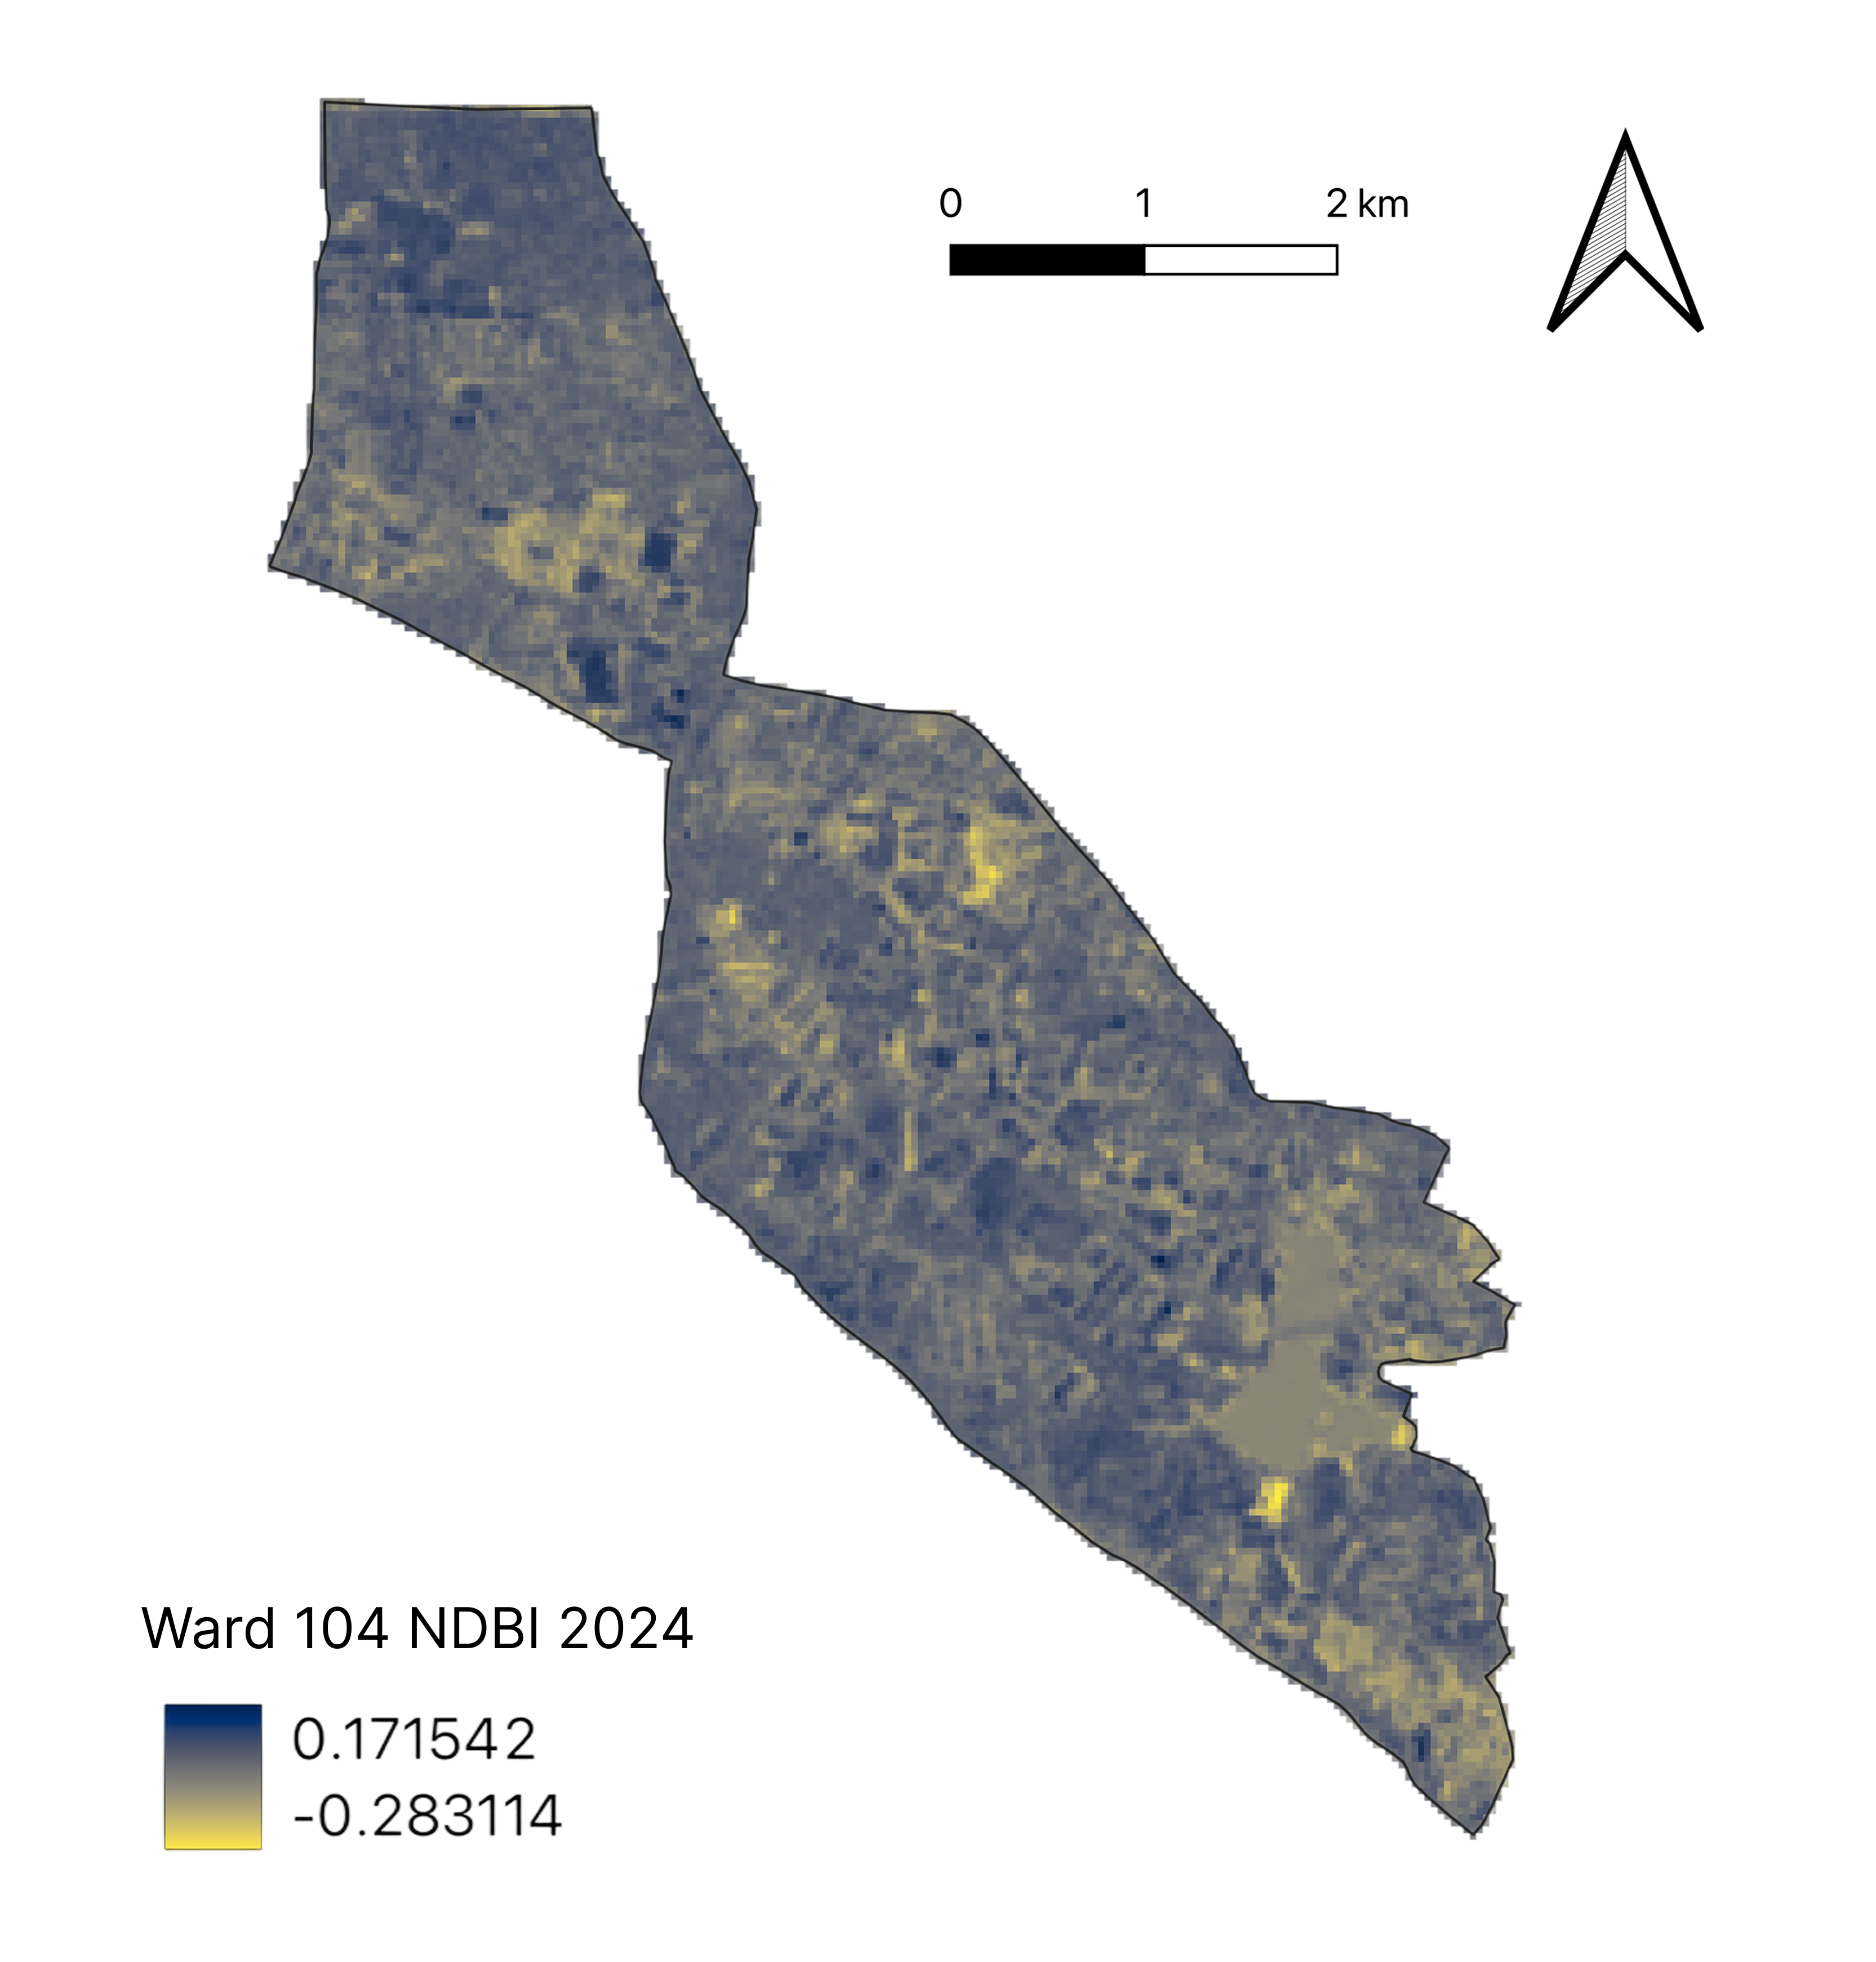
The NDBI maps, which highlight built-up areas, tell the story of relentless construction. From 2014 to 2024, the dark blue hues indicating dense construction have proliferated across Ward 104. Premnagar stands out with persistently high NDBI values, showcasing its pervasive built-up density and minimal permeable surfaces. This rapid conversion of any available land into concrete structures directly translates to increased heat absorption and slower heat dissipation, locking in the heat.
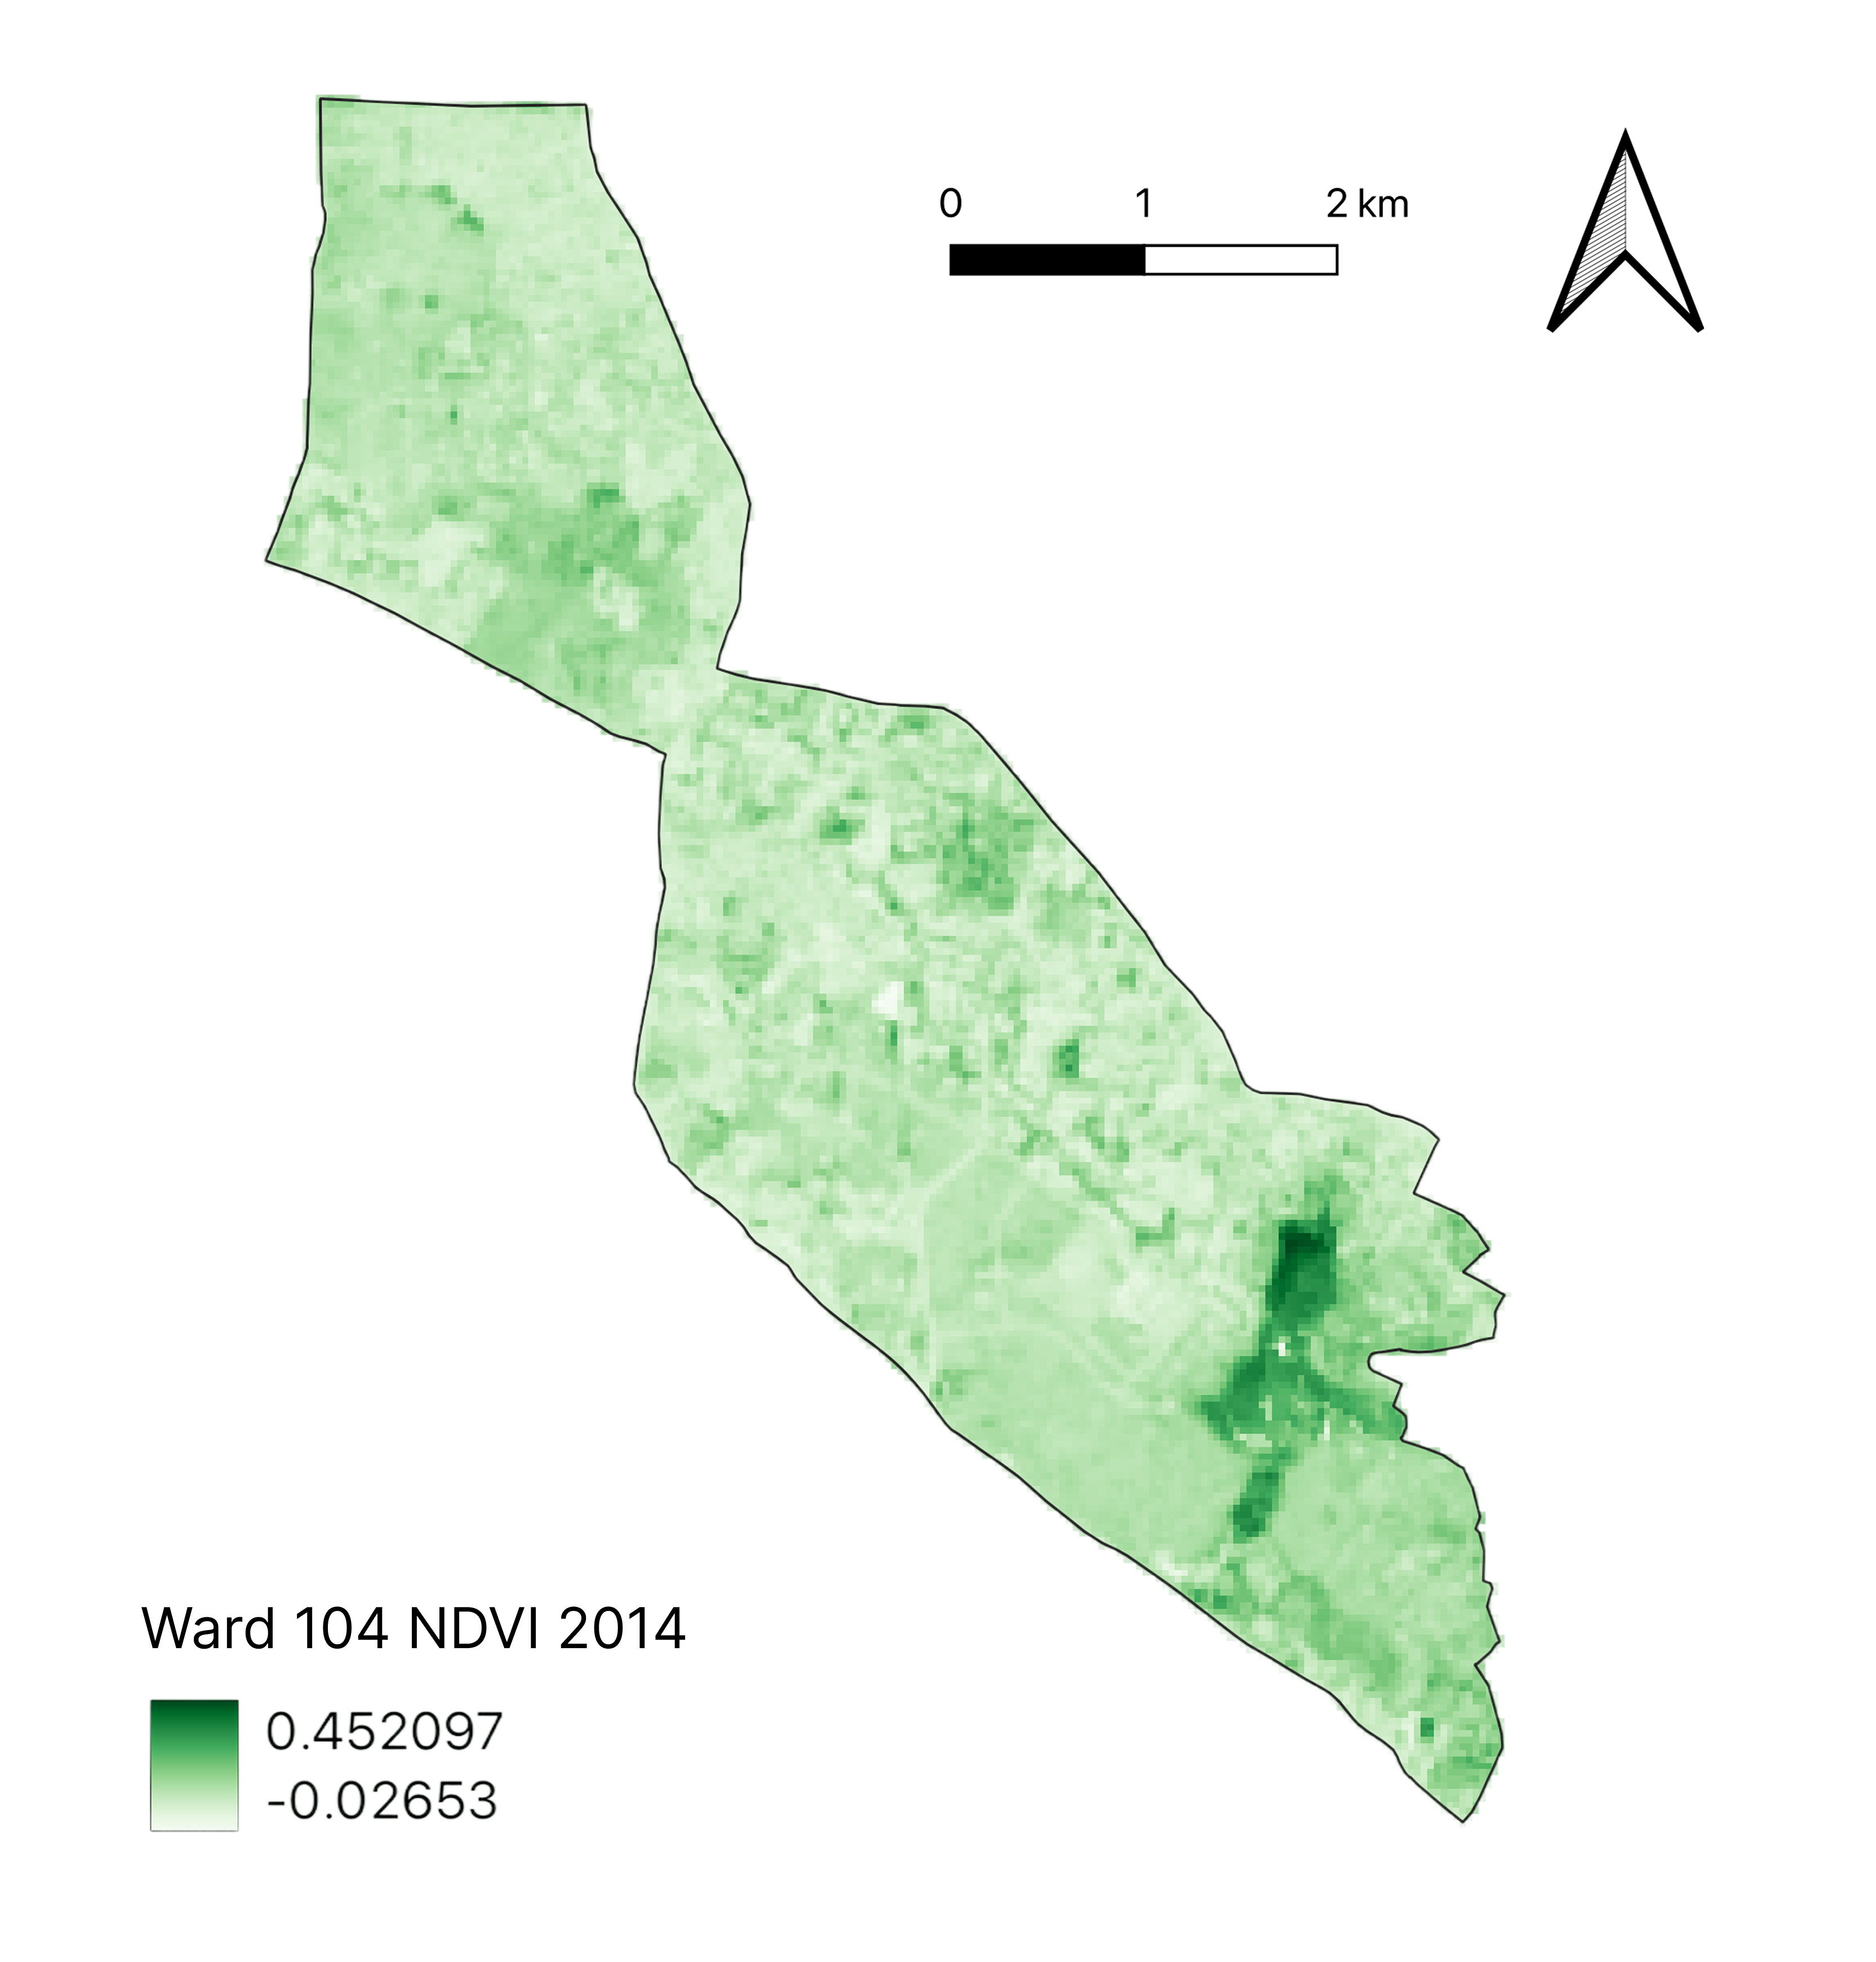
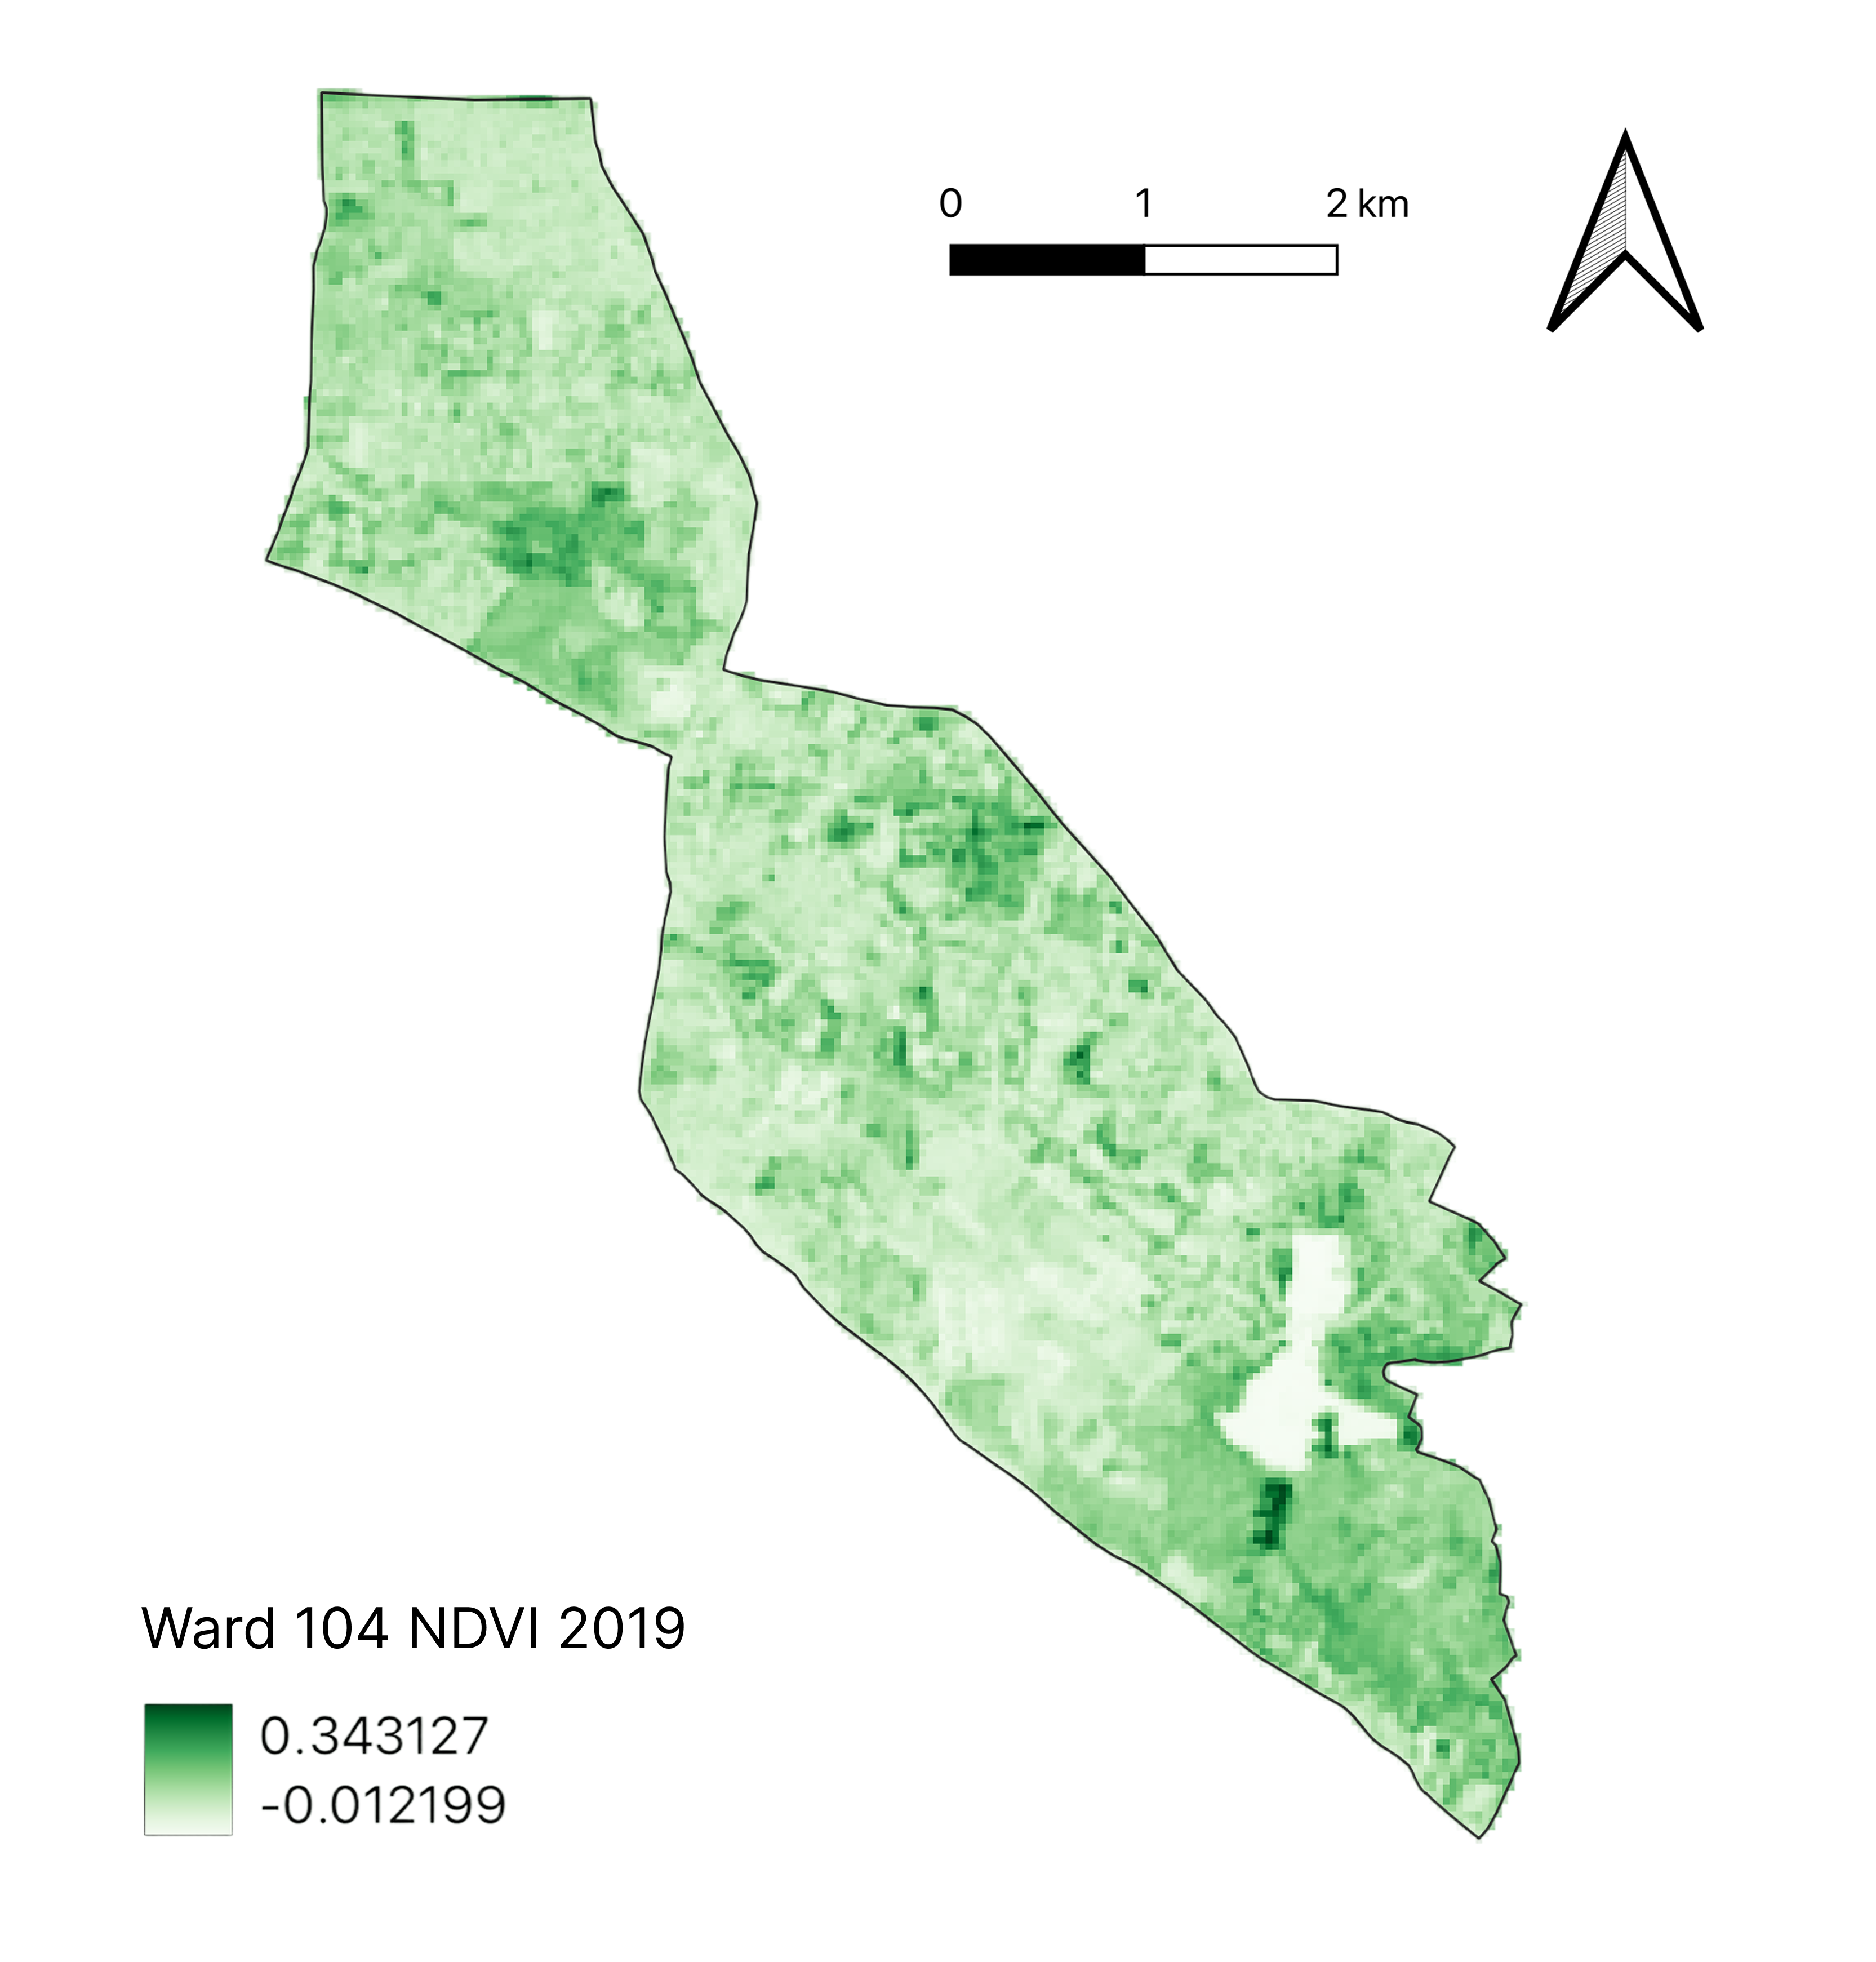
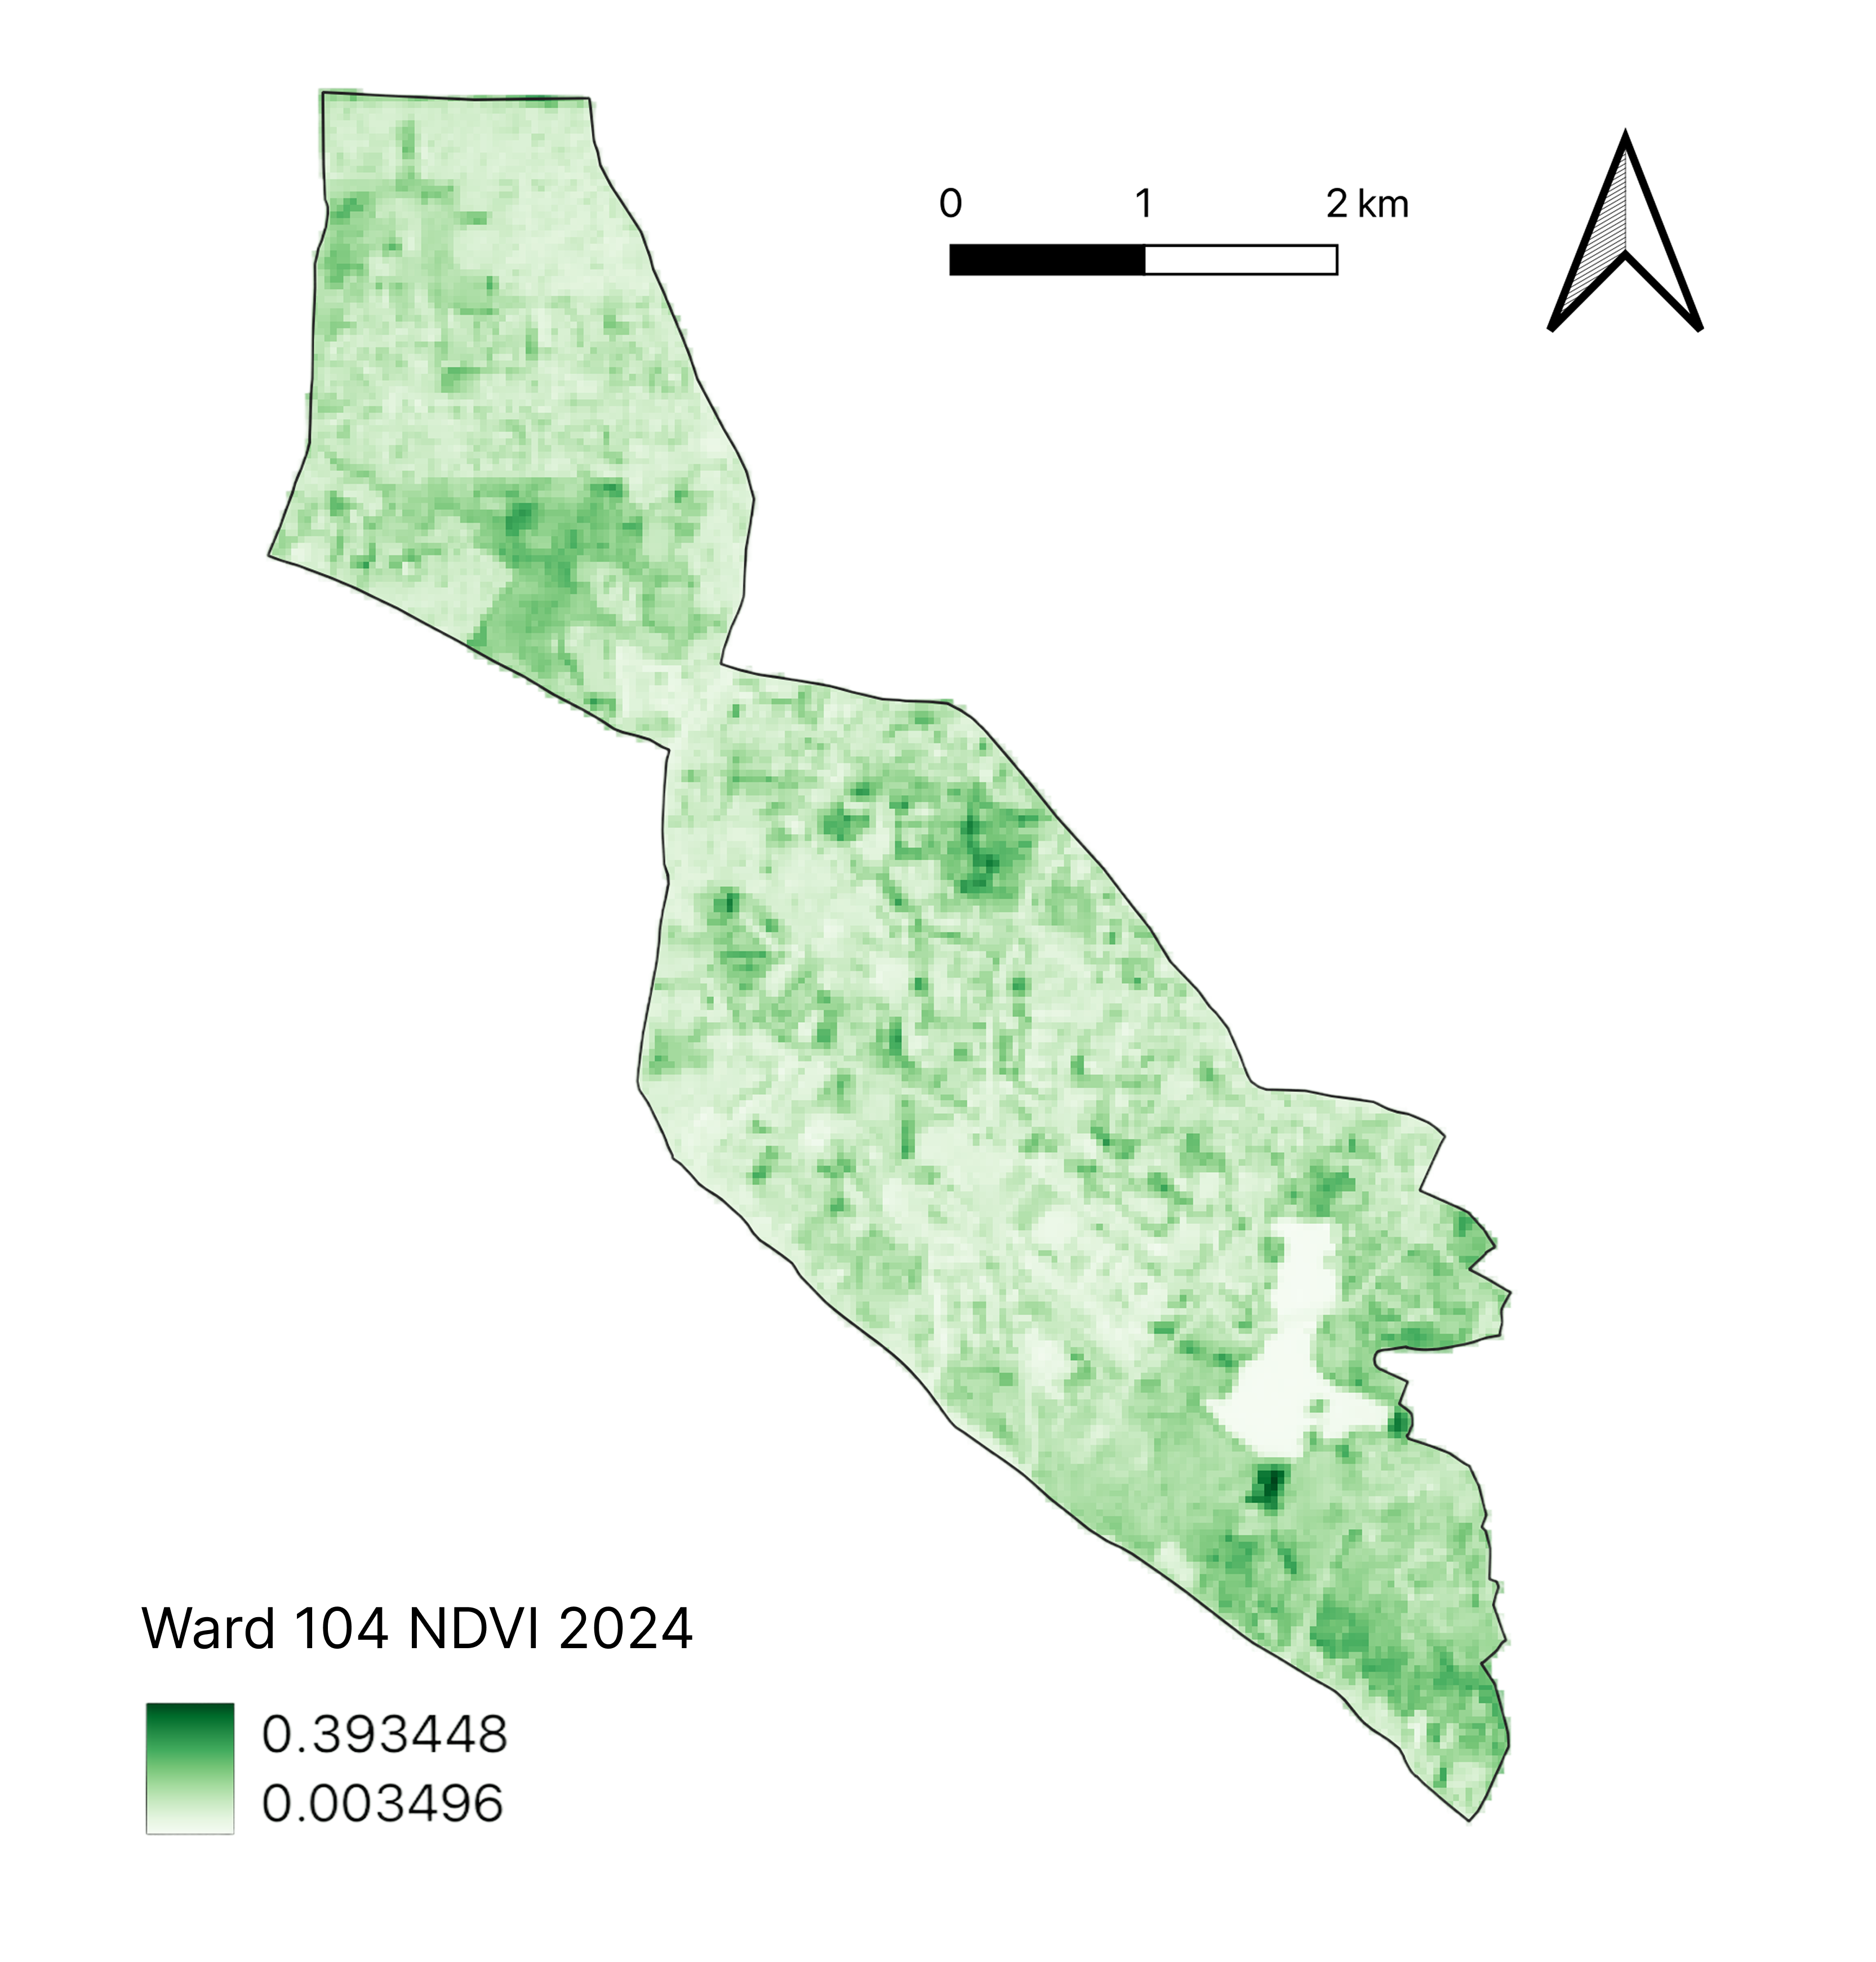
Conversely, our NDVI maps, which measure vegetation density, reveal the receding green cover. In 2014, the ward still had more extensive green patches. However, by 2019 and 2024, these valuable green areas have visibly diminished and become fragmented, especially in areas like Premnagar, where green infrastructure was already minimal and has been further encroached upon. Less vegetation means less evapotranspiration – nature’s cooling process – and reduced shading, directly contributing to higher surface temperatures.
The Lifelines: Protecting Blue-Green Infrastructure
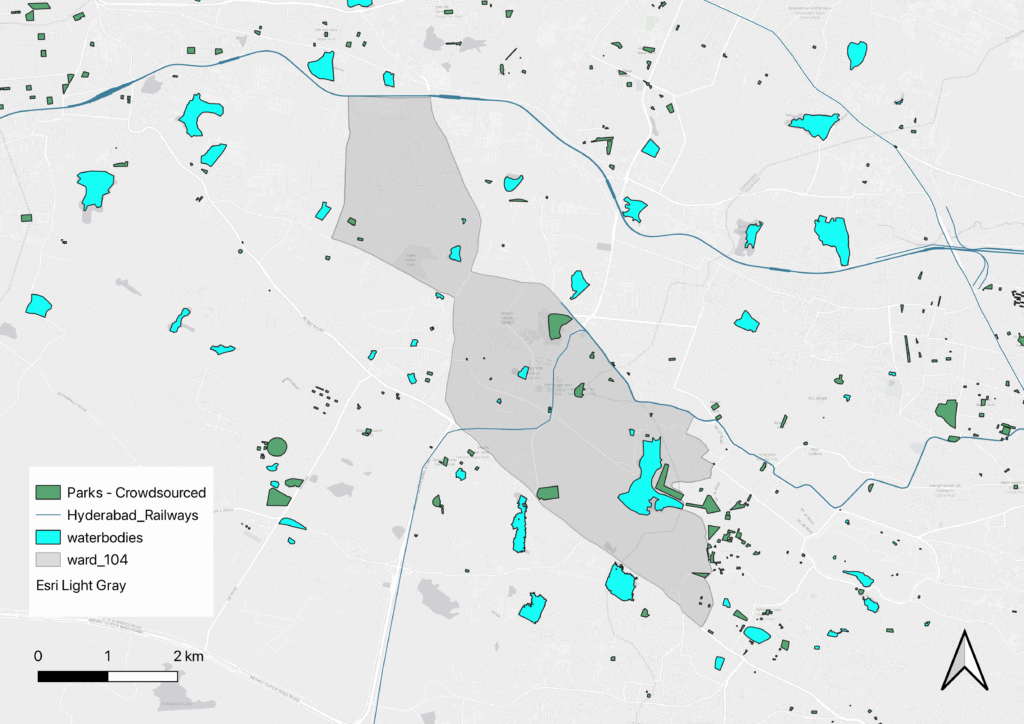
Amidst this warming trend, our “Blue-Green Infrastructure” map offers crucial insights into the existing natural assets that provide vital respite. The green polygons denote parks developed through crowdsourcing, and the blue polygons represent water bodies.
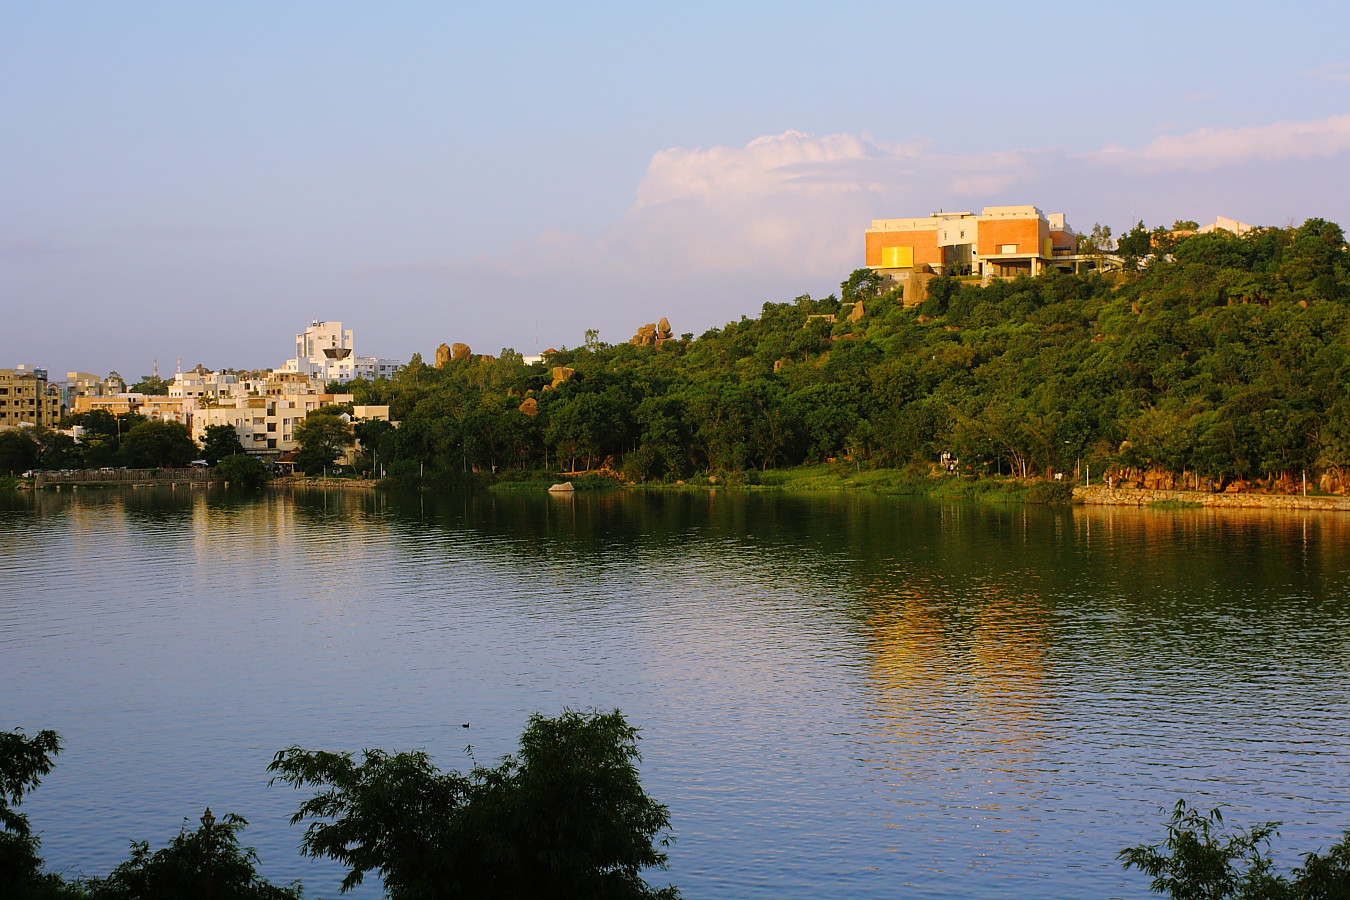
The large Durgam Cheruvu lake, prominently visible in the lower-right of the ward, consistently appears as a significantly cooler zone in our LST and UHI maps. These blue and green spaces are undeniable “cool islands,” demonstrating the powerful mitigating effect of natural elements. However, these life-saving cool oases are critically scarce or entirely absent in the most congested and vulnerable parts of Ward 104, particularly Premnagar.
Towards a Cooler, More Equitable Hyderabad
The narrative of Ward 104 is a powerful microcosm of Hyderabad’s urban development challenges. It starkly illustrates how rapid, unplanned urbanization, coupled with the unequal distribution of vital green infrastructure, creates significant thermal disparities. Residents of areas like Premnagar, often from more modest backgrounds, are left disproportionately exposed to the health and economic impacts of the urban heat island effect. This is not just an environmental issue; it is an issue of urban justice and liveability.
What actions can we collectively take for a more resilient and equitable Hyderabad?
- Prioritize Green Justice: Direct green infrastructure initiatives specifically towards high-density, socio-economically vulnerable areas like Premnagar. This includes creating pocket parks, fostering community gardens, and promoting vertical greenery and green walls where ground space is limited.
- Mandate Green Cover in Development: Implement and strictly enforce policies that mandate a minimum percentage of green space, permeable surfaces, and tree planting in all new developments, as well as in redevelopment projects within existing dense areas.
- Strategic Urban Forestry: Launch aggressive urban forestry programs, targeting streets, public spaces, and barren land, particularly in neighborhoods with minimal existing tree canopy.
- Embrace Cool Technologies: Incentivize the adoption of cool pavements and reflective building materials (high-albedo surfaces) for roads, roofs, and other urban infrastructure to reduce heat absorption, especially in residential zones.
- Protect and Revitalize Water Bodies: Safeguard existing lakes and ponds from encroachment and pollution. Explore opportunities for integrating new water features into urban design where feasible.
- Inclusive Urban Planning: Ensure that urban master plans explicitly incorporate UHI mitigation strategies with an equity lens, guaranteeing that the benefits of a cooler, healthier environment reach all communities, regardless of their socio-economic status.
The story of Ward 104 is a stark reminder: a truly smart and sustainable city is one where growth is balanced with environmental responsibility, and where a healthy, comfortable living environment is a right, not a privilege, for every citizen. It’s time for Hyderabad to invest in a cooler, fairer future.