Cities of the 21st century, largely in developing countries given their elevated vulnerabilities, necessitate a substantial share of the global climate change costs. An immediate and a measured addressal is an emerging imperative. As a first step, several Indian cities have embarked on developing Climate Action Plans (CAPs) outlining exhaustive climate actions.
While this is a welcome step, as with the global narrative, the city CAPs also articulate climate action in binaries of mitigation and adaptation. Premised on the argument that effective mitigation will eventually reduce the need for adaptation, mitigation historically has dominated policy and climate action. In recent decades, however, there has been growing acknowledgement globally on the role of adaptation in building resilience and providing immediate and affordable relief, particularly for vulnerable populations.
An acknowledgment that even in best-case scenarios where green-house gas emissions are rapidly cut to ‘net-zero’, climate change will continue to impact the world (UNDP, 2024). Effective adaptation, therefore, is an imperative to foster climate-resilient communities. This is critical in achieving social and climate justice, especially in the global South city. In this context, balancing adaptation and mitigation strategies is the need of the hour.
Drawing upon our analyses of sixteen city CAPs across India, we argue that mitigation remains a constant choice over adaptation. Even where there is a seemingly discernible balance between mitigation and adaptation or where adaptation strategies are more that mitigation, the nature of envisaged adaptation actions leave much to be desired as highlighted below.
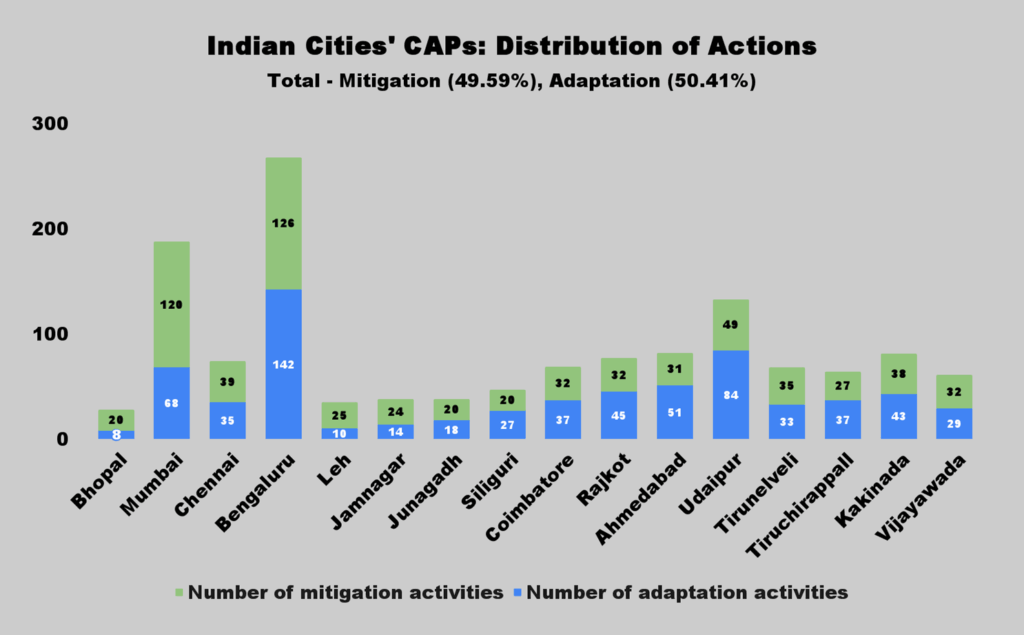
We analysed the sixteen city CAPs through a two-stage process. In the first we use the UNDP’s Adaptation Policy Framework (2005) and its four criteria – approach, stakeholder engagement, coverage, and mapping socio-economic conditions – to identify the mitigation- adaptation distribution. Off the total 1351 actions suggested climate actions, 49.59% (670) are mitigation strategies, the remaining 50.41% (681) are adaptation focused. While in Mumbai, Bhopal, Leh and Jamnagar, adaptation strategies constitute less than 40% of proposed climate actions, in Bengaluru, Chennai and Junagadh; adaptation and mitigation efforts are relatively balanced. Interestingly, Udaipur, Ahmedabad and Rajkot have the highest adaptation action, at over 58% of total actions each (Table 1).
CLIMATE
ACTION PLANS (CAPs) – SUMMARY
|
|
||||||||
|
City, Year
and Methodology |
Vision |
Sectors |
Total
Number of Actions |
Number of
Mitigation Actions |
% of
Mitigation Actions |
Number of
Adaptation Actions |
% of
Adaptation Actions |
|
|
|
Bhopal (2023,
CSCAF) |
Climate Resilient and
Adaptive societies |
Transform
Bhopal into a Solar City, Waste Management, Transport, Green and Inclusive
Spaces, Water Resilience, Climate Resilient Infrastructure |
28 |
20 |
71.43 |
8 |
28.57 |
|
|
|
Mumbai (2022,
C40) |
Net Zero by 2050 and
Climate Resilience |
Energy
and Buildings, Sustainable Mobility, Sustainable Waste Management, Urban
Greening and Biodiversity, Urban Flooding and Water Management, Air Quality |
188 |
120 |
63.83 |
68 |
36.17 |
||
|
Chennai (2023,
C40) |
Carbon Neutrality and Water
Balance |
Electric
Grid and Renewable Energy, Energy and Buildings, Waste Management, Urban
Flooding and Water Scarcity, Vulnerable Populations and Health |
74 |
39 |
52.77 |
35 |
47.23 |
||
|
Bengaluru (2023,
C40) |
Towards Net Zero and
Climate Resilience |
Energy
and Buildings, Transportation, Solid Waste Management, Air Quality,
Wastewater and Stormwater, Urban Planning + Greening and Biodiversity,
Disaster Management, Water Management |
268 |
126 |
47.01 |
142 |
52.99 |
||
|
Leh (2024,
CSCAF) |
Net Zero by 2047 and
Climate Resilience |
Water
Management, Combating Flash Floods, Revamped Waste Management, Emission
Reduction through Transport Transformation, Reduction of Electricity Usage |
35 |
25 |
71.43 |
10 |
28.57 |
||
|
Jamnagar
(2024, CSCAF) |
Net Zero by 2050 and
Climate Resilience |
Decarbonize
Stationary Energy Emissions, Adoption of Green Transport Network, Resource
Efficient Circular Waste Economy, Build Heat and Flood Resilience,
Environmental Health and Biodiversity, Sustainable Water and Used Water
Management |
38 |
24 |
63.16 |
14 |
36.84 |
||
|
Junagadh (2024,
CSCAF) |
Net Zero by 2050 and
Climate Resilience |
Decarbonize
Stationary Energy Emissions, Resource Efficient Waste Management, Reduce
Vehicular Emissions, Efficient Water and Waste Management, Sustainable
Tourism and Heritage Management, Adopting Climate-Sensitive Planning
Approaches |
38 |
20 |
52.63 |
18 |
47.37 |
||
|
Ahmedabad (2023, ICLEI) |
Net Zero by 2070 and Climate Resilience |
Built Environment and Energy,
Transport, Water, Wastewater, Stormwater, Solid Waste, Urban Greening and
Biodiversity, Air Quality |
82 |
31 |
37.80 |
51 |
62.20 |
||
|
Siliguri (2024, ICLEI) |
Net Zero by 2070 and Climate Resilience |
Built Environment and Energy,
Transport, Water, Wastewater, Stormwater, Solid Waste, Urban Greening and
Biodiversity, Air Quality |
47 |
20 |
42.55 |
27 |
57.45 |
|
|
|
Coimbatore (2024, ICLEI) |
Net Zero by 2070 and Climate Resilience |
Built Environment and Energy,
Transport, Water, Wastewater, Stormwater, Solid Waste, Urban Greening and
Biodiversity, Air Quality |
69 |
32 |
46.38 |
37 |
53.62 |
|
|
|
Rajkot (2024, ICLEI) |
Net Zero by 2070 and Climate Resilience |
Built Environment and Energy,
Transport, Water, Wastewater, Stormwater, Solid Waste, Urban Greening and
Biodiversity, Air Quality |
77 |
32 |
41.56 |
45 |
58.44 |
|
|
|
Udaipur (2024, ICLEI) |
Net Zero by 2070 and Climate Resilience |
Built Environment and Energy,
Transport, Water, Wastewater, Stormwater, Solid Waste, Urban Greening and
Biodiversity, Air Quality |
133 |
49 |
36.84 |
84 |
63.16 |
|
|
|
Tirunelveli (2024, ICLEI) |
Net Zero by 2070 and Climate Resilience |
Built Environment and Energy,
Transport, Water, Wastewater, Stormwater, Solid Waste, Urban Greening and
Biodiversity, Air Quality |
68 |
35 |
51.47 |
33 |
48.53 |
|
|
|
Tiruchirappalli (2024, ICLEI) |
Net Zero by 2070 and Climate Resilience |
Built Environment and Energy,
Transport, Water, Wastewater, Stormwater, Solid Waste, Urban Greening and
Biodiversity, Air Quality |
64 |
27 |
42.19 |
37 |
57.81 |
|
|
|
Kakinada (2025, ICLEI) |
Net Zero by 2047 and Climate Resilience |
Built Environment and Energy, Transportation,
Water Supply, Wastewater Management, Stormwater Management, Solid Waste
Management, Urban Greening and Biodiversity, Health |
81 |
38 |
46.91 |
43 |
53.09 |
|
|
|
Vijayawada (2025, ICLEI) |
Net Zero by 2047 and Climate Resilience |
Built Environment and Energy, Transportation,
Water Supply, Wastewater Management, Stormwater Management, Solid Waste
Management, Urban Greening and Biodiversity, Health |
61 |
32 |
52.46 |
29 |
47.54 |
|
|
|
Total |
|
|
1351 |
670 |
49.59 |
681 |
50.41 |
|
|
Table 1: Mitigation – adaptation balance in the CAPs across sixteen cities[1]
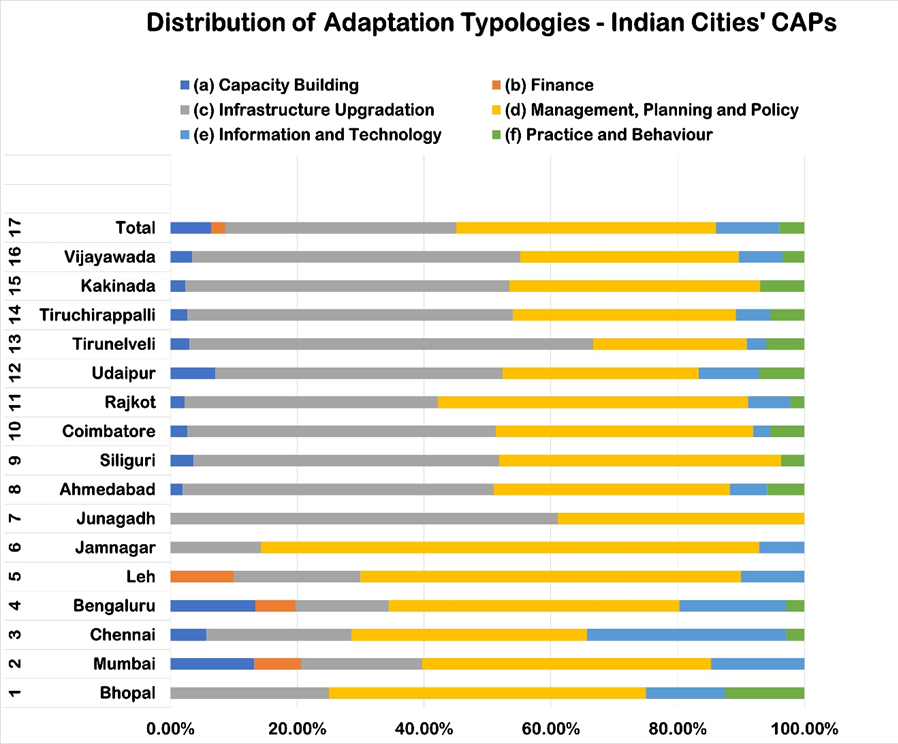
In the second stage we use Biagini et al.’s (2014) adaptation typology framework to comprehend the focus of adaptation, how it is framed – the typology – as well as its relevance to the most vulnerable populations[2].
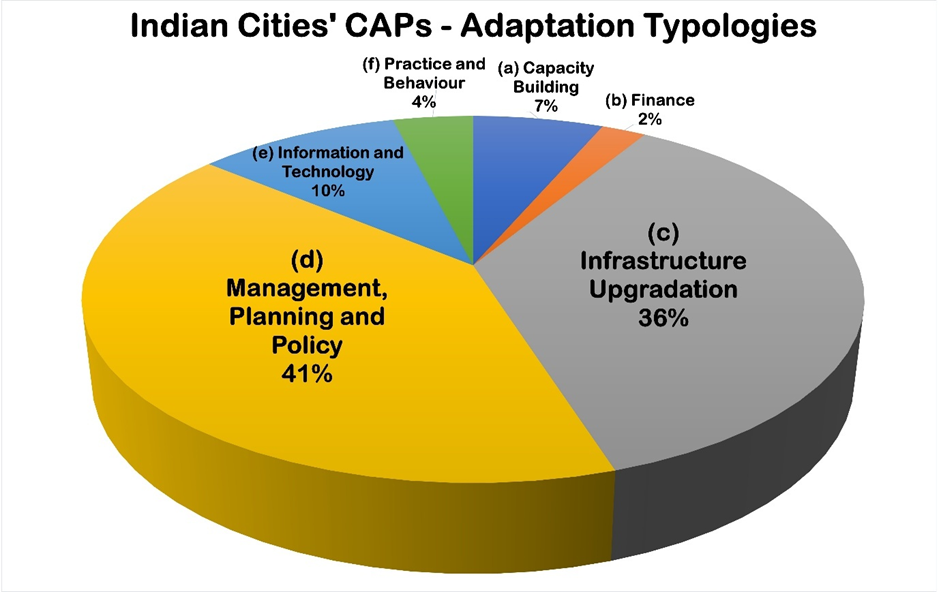
Chart 2 shows that a large chunk of the proposed adaptation strategies across all the CAPs are predominantly confined to interventions relating to ‘Management, Planning and Policy’ (40.97%), following by ‘Infrastructure Upgradation’ (36.42%) and ‘Information and Technology’ (9.99%). Together, these emphasise high-level mandates and regulations. Notably, critical strategies that focus on ‘Capacity Building’(6.46%) as well as ‘Practice and Behaviour’ (3.96%) are presently neglected.
The UNEP’s Adaptation Gap Report (2024, p. 83) reveals that adaptation efforts in developing countries chronically suffer from financial constraints. In this context, it is surprising to see that the ‘Finance’ as the primary adaptation typology being a mere 2.20% of total actions in Indian cities’ CAPs.
Notably, across the CAPs, the approach to understanding risks and populations susceptible to vulnerabilities continues to follow a top-down approach – one that is supported by climate modelling and projections. This is neither adequate nor sufficient. As the impacts of climate hazards vary substantially across different geographies, scales and populations, capturing the nuances through a granular understanding is critical. An exclusively top-down approach falls short of capturing the experiential dimension of those most affected. This is a significant methodological gap in the planning process and is reflected in the typology of the adaptation strategies.
For example, Bengaluru’s CAP notes that the per capita open space availability is a mere 1.3 sqm in the city. In doing so, the CAP highlights a critical scarcity in Bangalore. However, this statistic fails to convey the nature of the existing open spaces, the population accessing these, whether these spaces are inclusive and accessible to people from varying socio-economic backgrounds, especially the vulnerable communities. In other words, while these methods are useful in prioritising adaptation in high-risk areas, crucially these remain limited in accounting for the everyday specifics of citizens – livelihoods, everyday living and local coping mechanisms. A bottom-up contextual and decentralised risk assessment is currently missing in all the CAPs. Integrating this reading of the lived city and the myriad experiences of its people – as a supplement to the top-down reading – is critical to make our cities liveable. While balancing adaptation and mitigation actions is not a sufficient condition to making our cities inclusive. Designing effective adaptation, one that speaks to the risks and everyday vulnerabilities as experienced by people is a necessary step.
[The author acknowledges the assistance of Rutu Marathe in the initial stages of conducting the research and Shoubhik Chatterjee for his assistance in the latter stages.]
[1] The U.S.
Global Change Research Program, 2024 defines Climate Mitigation as measures
that aim to reduce the intensity of future climate change by cutting down on
emissions like of carbon dioxide that trap heat in the atmosphere, and, Climate
Adaptation as the process of adjusting to actual/predicted climate change
to moderate harm or exploit beneficial opportunities, which can be carried out
by both natural systems and human interventions.
[2] To further
understand adaptation typologies in CAPs, we turn to Biagini et al. (2014) who
outline ten typologies to understand adaptation strategies. For ease of
comprehension, we collapse the ten typologies into six categories – (a)
Capacity Building, (b) Finance, (c) Infrastructure Upgradation, (d) Management,
Planning and Policy, (e) Information and Technology, and (f) Practice and
Behaviour.
CLASSIFICATION
OF ADAPTATION TYPOLOGIES
-Management,
Planning and Policy refers
to “incorporating understanding of climate science, impacts, vulnerability and
risk into government and institutional planning and management,” including
through policy and regulations (2014, p. 104)
-Infrastructure
Upgradation refers to the
development of hard physical infrastructure, warning or observing systems and
specific ‘green’ infrastructure that provide direct or indirect protection from
climate hazards (Ibid.).
-Information
and Technology refers to
systems (including new via technology) used for communicating climate
information to help build resilience towards climate impacts (Ibid.).
-Capacity Building is described as
“developing human resources, institutions, and communities, equipping them with
the capability to adapt to climate change” (Ibid.).
-Practice
and Behaviour is described
as “revisions or expansion of practices and on the ground behaviour that are
directly related to building resilience” (Ibid.).
-Finance is described as “new financing or insurance
strategies to prepare for future climate disturbances” (Ibid.).