It has been 9 months since the WHO declared Covid-19 as “no longer a public health emergency”. In India, for close to two years, since the Omicron wave hit in early 2022, Covid-19 has been in the back burner and life has been pretty much business as usual. Occasionally concerns are raised with new variants like JN.1, but they don’t fill hospitals or cause emergencies as we experienced during the first and second waves of Covid-19.
Even the third wave, fueled by the Omicron variant, which caused more infections than the Delta variant driven second wave, barely registered as a blip when it came to hospital admissions or deaths.

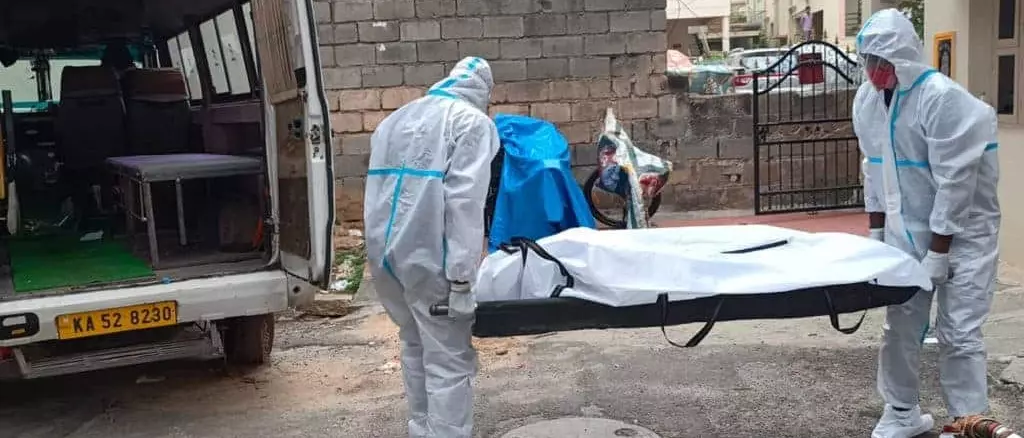
The first and the second waves contributed significantly to the death toll of Covid-19 in Bengaluru. During the second wave horror stories of people struggling to find hospital beds or oxygen cylinders were common. As the bodies piled up electric crematoria broke down from the overload and the lone non-electric one ran out of space for bodies and pyres.
The official count of deaths due to Covid-19 for Bengaluru Urban as of Feb 19th 2024 stands at 17,015 deaths. If we consider just the five months of 2020 (July to November) and the four months of 2021 (April to July), which were the peak months of the first and second waves respectively, the total official count in Bengaluru Urban is 15,321, or 90% of the total “official” deaths due to Covid happened in these nine months.
How many people really died of Covid-19 in Bengaluru?
A death was counted as a Covid-19 death only if there was a positive Covid-19 result for the deceased. If a person was suffering from Covid-19, but did not have a positive test, due to whatever reason, they wouldn’t be counted. This is likely to have caused a lot of misses and the official tally is a large underestimation of the true toll that the virus took.
A good way to look at the true toll of Covid-19 is to see the number of excess deaths in the city during those waves. Excess deaths can be computed by looking at the number of deaths registered per month each year before Covid and using that to draw a baseline for expected number of deaths. Deaths above this baseline can be considered as “excess”.
The Office of the Chief Registrar of Births and Deaths, Government of Karnataka, puts out annual reports with births as well as deaths registered. These reports contain detailed data on number of deaths registered in each month.
Looking at the number of monthly deaths registered from 2017 to 2021, the median number for 2017 and 2018 was in the early 5600s. For 2019 it was 6,126. Based on this we can take a very conservative baseline figure of 6500 registered deaths as the expected number of deaths per month in Bengaluru Urban for 2020 and 2021.

As can be seen above, there were significant spikes in number of deaths from July to November of 2020 and May to July of 2021. We can consider April also as part of the second wave as the number of deaths in the official count was significantly high.
In fact, the five months of 2020 saw 45,112 deaths being registered, while the four months of 2021 saw 50,222 deaths being registered.
Using the per-month baseline of 6500, the number of excess deaths in 2020 comes to 12,612. (45112-(5*6500). The official Covid-19 count was 4062 for these months. The excess deaths were more than thrice the official count.

Interestingly, there were more deaths officially in July 2020 than registered. This is expected as we were still coming out of partial lockdowns and registrations would have been delayed.
In 2021, during the second wave the numbers were much higher, both for official deaths as well as excess deaths.

Similar to the first month of the first wave, there were more official deaths in April 2021 than registered excess. For the four months of 2021 when the second wave was raging, the excess deaths registered totaled 24,205 while the official count was 11,259. The excess deaths were just over twice the official count which was an improvement over 2020.
Combining the two waves, while the official count was 15,321, the number of excess deaths was 36,817, 2.4 times the official count.

However, to reiterate, to count as an official Covid death a valid positive test was necessary. During the throes of the second wave, getting a test itself was an ordeal when entire families were struck down with the virus. Significant under-counting was expected at the time of the event. But the numbers should have been revised later as other states like Kerala did.
It also needs to be noted that our healthcare facilities were stretched beyond capacity especially during the second wave, and many who needed health care for reasons other than Covid were turned away. This would also have contributed to the excess deaths, as many non-covid deaths that would have been preventable in normal days would have occurred due to this lack of access. Should they count as “Covid deaths”? Given that without a raging pandemic many of them would have survived, they should be counted as deaths caused by the pandemic, even if the cause was not as direct as dying of the virus.
What have we learnt so far?
The above analysis applies only to the deaths during the two waves. The official tally for Covid-19 in its entirety is 17014, 10% more than the count from the nine months under consideration. Given that testing was not too difficult to access and hospitals were not full outside of these two waves, it is likely the under-counting would not have been this significant for the rest of the pandemic. We can assume another 2000 to 3000 excess deaths in total bringing the total tally for Bengaluru to between 38,000 and 40,000.
Covid-19 remains the biggest disaster, natural or man-made, to have hit Bengaluru after Independence. It is important we draw the right lessons from it and improve our public health infrastructure which proved to be woefully inadequate to meet the challenges of the pandemic. But as our analysis shows, this has not happened at the BBMP level. And the national budget also shows the same reluctance to invest in public health. We remain as vulnerable to the next pandemic as we were before Covid struck. That is one of the main tragedies of this pandemic.
Resources
- Annual births and deaths data for Bengaluru Urban from ejanma portal from 2001 to 2022.
- Covid-19 daily data for Bengaluru Urban district from 1st June 2020 to Feb 2023.