Have you ever noticed how much hotter it feels in a congested part of a city compared to a park or a quiet neighborhood? That’s what scientists call the Urban Heat Island (UHI) effect. It happens when cities, with all their buildings and roads, get much warmer than the green areas around them.
The Urban Heat Island effect isn’t just a natural thing; it’s caused by the way we build our cities. We replace natural land with concrete and asphalt, and we cut down trees, which used to help cool things down. These choices turn our cities into heat traps.
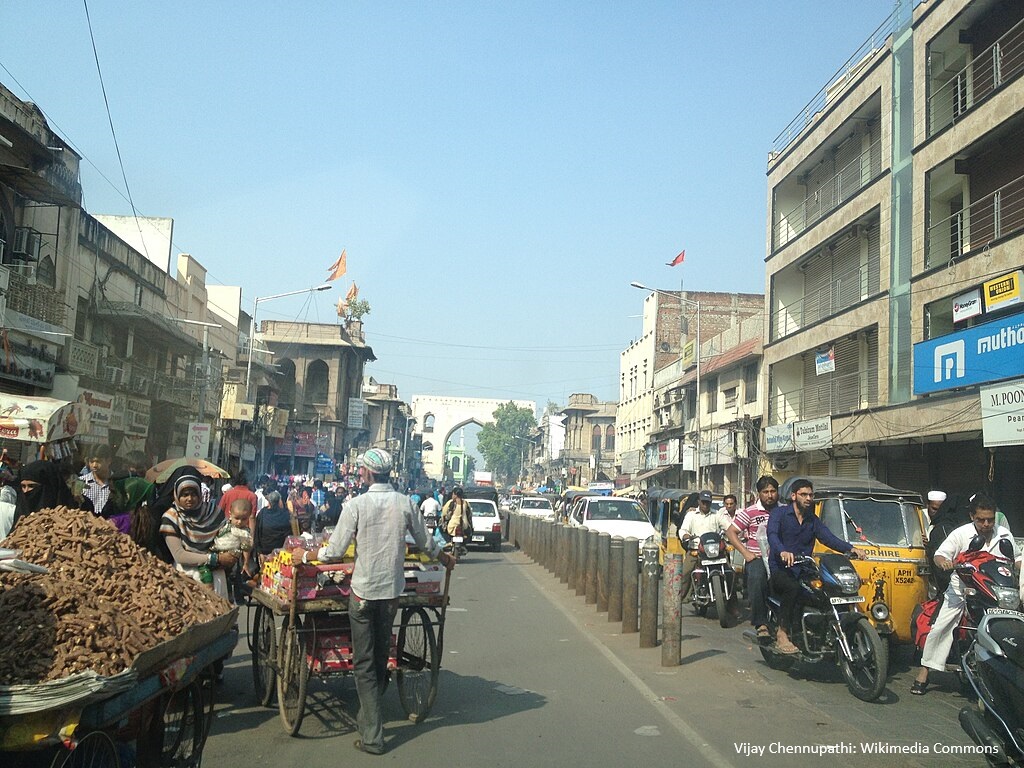
This is a big problem for a fast-growing city like Hyderabad. As it expands, it’s getting warmer. We can see this happening by looking at Bholakpur, Ward no. 88, a neighborhood that has gone through a lot of change in the last ten years.
This article tells the story of Bholakpur’s warming, using satellite data to show how the neighborhood has changed and what those changes mean for the people who live there.
Bholakpur – Demographics
Before we dive into the changes, let’s get to know Bholakpur as it was. The 2011 Census provides a vital human baseline, painting a picture of the lives that would soon experience the intensifying urban heat.
In 2011, Bholakpur was home to 36,526 people, living in 9,009 households. This was a very dense area. Among them were 3,163 children aged 6 or younger. This is an important detail, as children are especially sensitive to extreme heat.
The census also showed that Bholakpur had a workforce of almost 16,000 people, with many of them working in jobs that likely required them to be outdoors. As temperatures rise, these workers face a direct threat to their health and their ability to earn a living.
This snapshot from 2011 helps us see beyond the maps and numbers. It reminds us that behind every change in temperature and land cover, there are real people—families, workers, and children—whose daily lives are directly affected.
Reading the City’s Story from Space
To understand what happened in Bholakpur, we used three kinds of data from satellites. They show us three key things about the neighborhood:
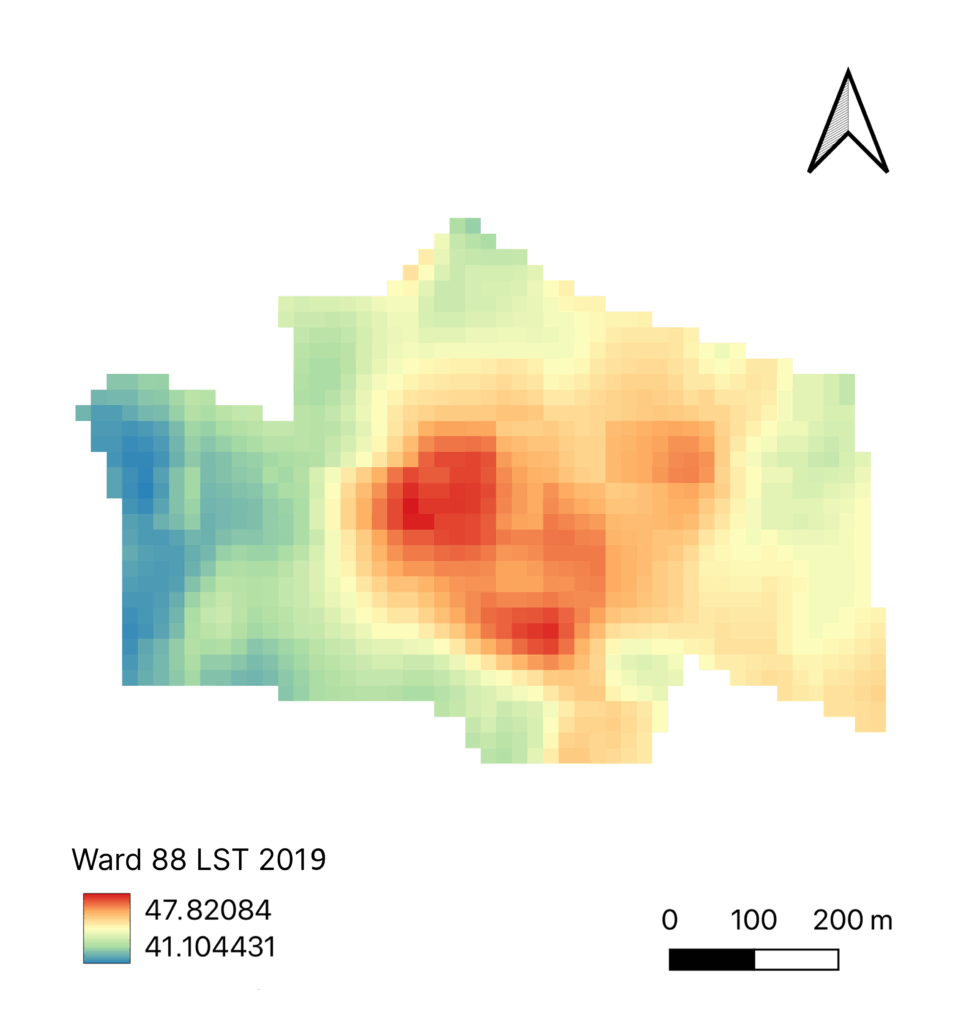
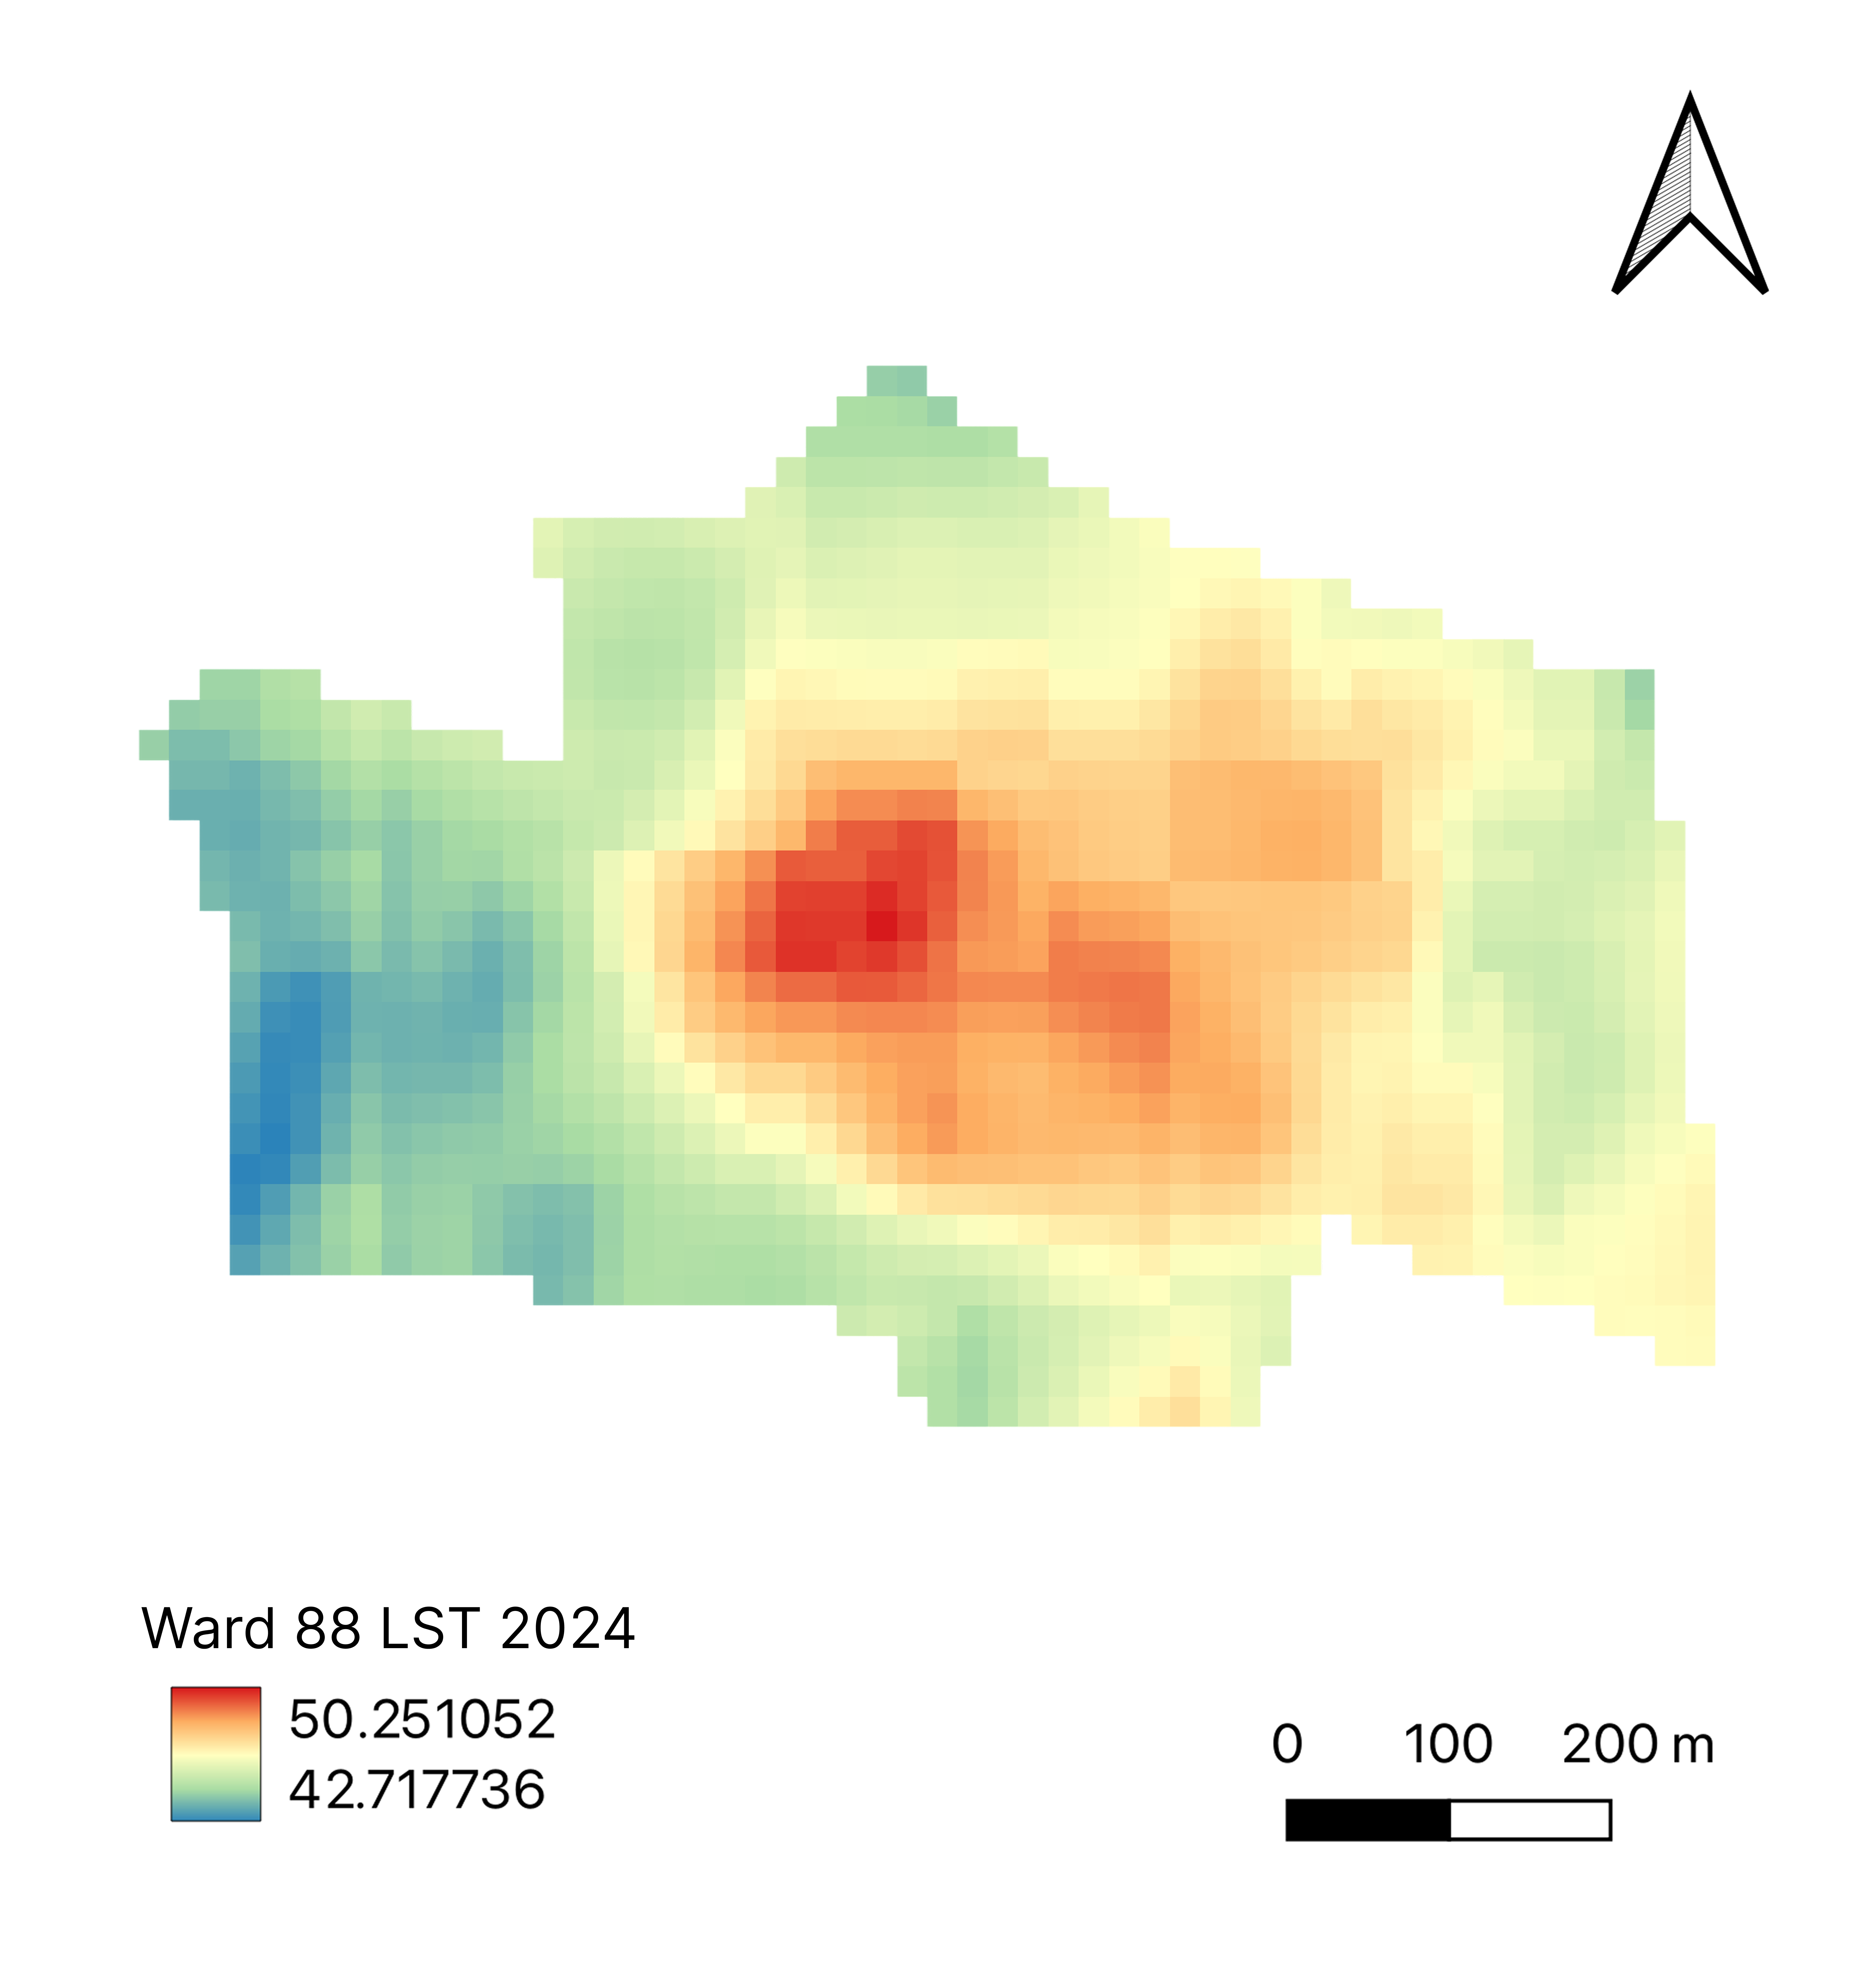
- LST (Land Surface Temperature): The City’s Fever Chart. This map shows how hot the ground, roofs, and roads are. We’ve used a color scale to make it easy to see: red and orange areas are the hottest, while green and blue areas are cooler.
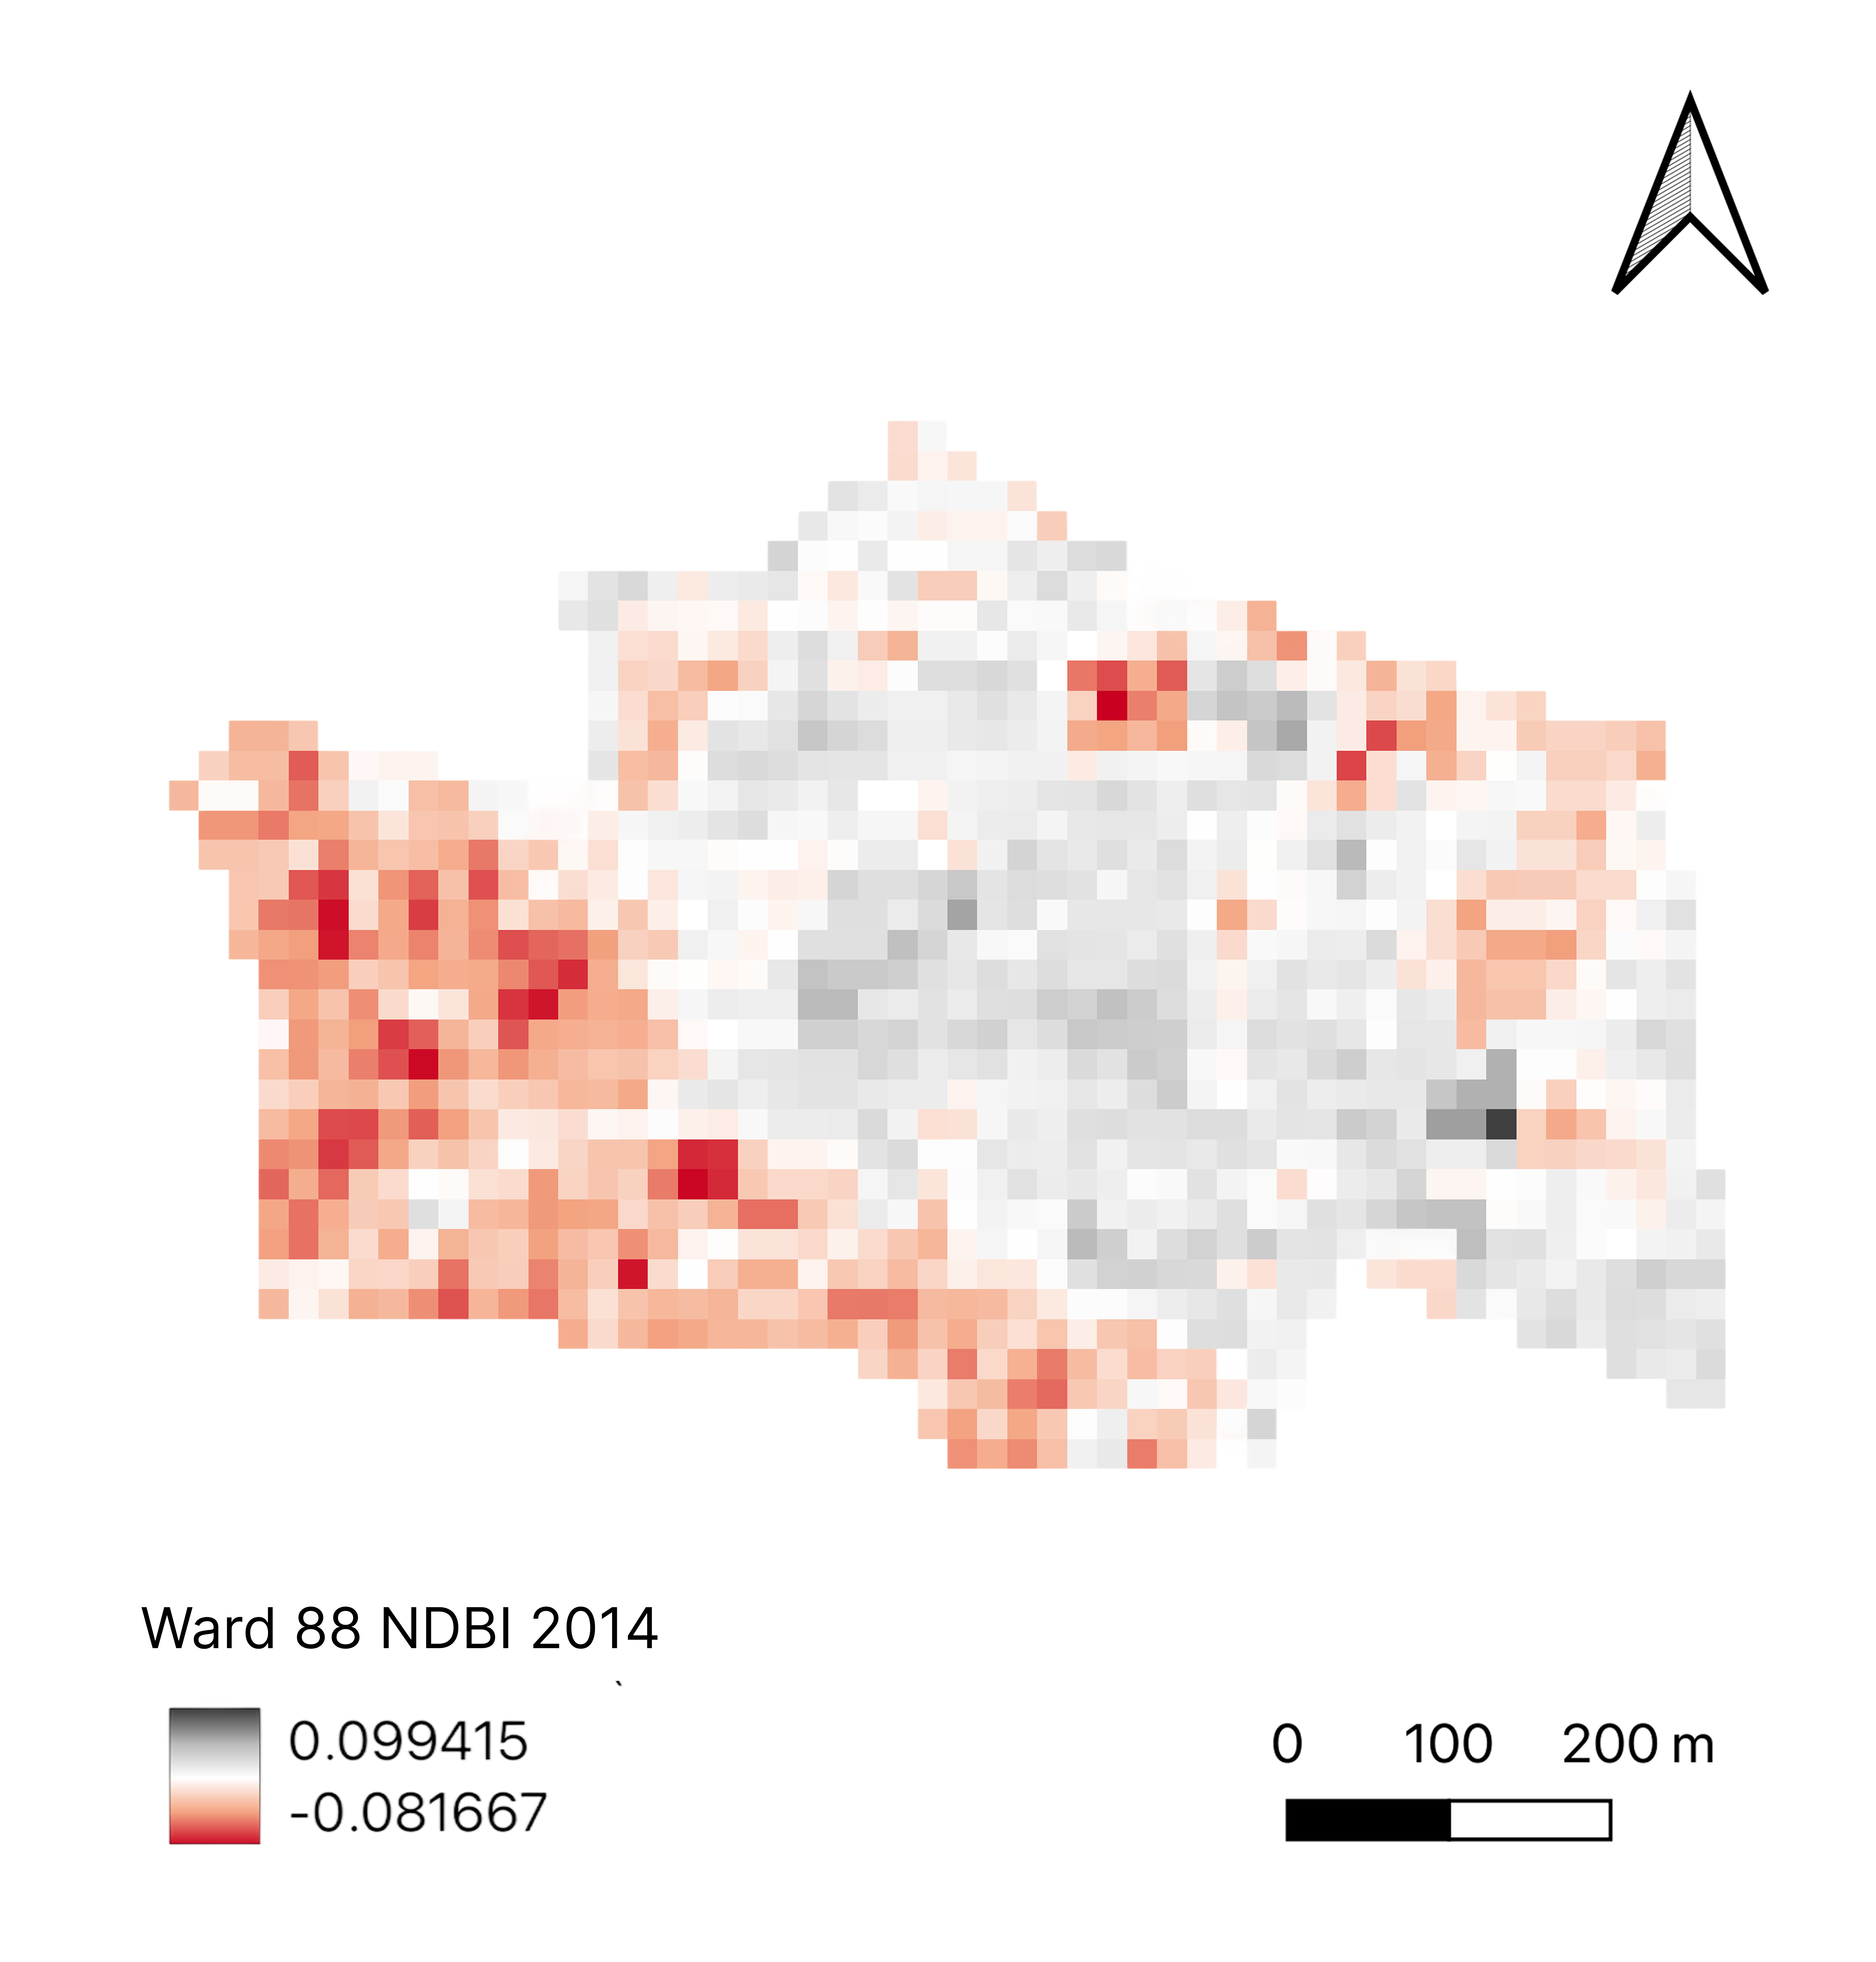
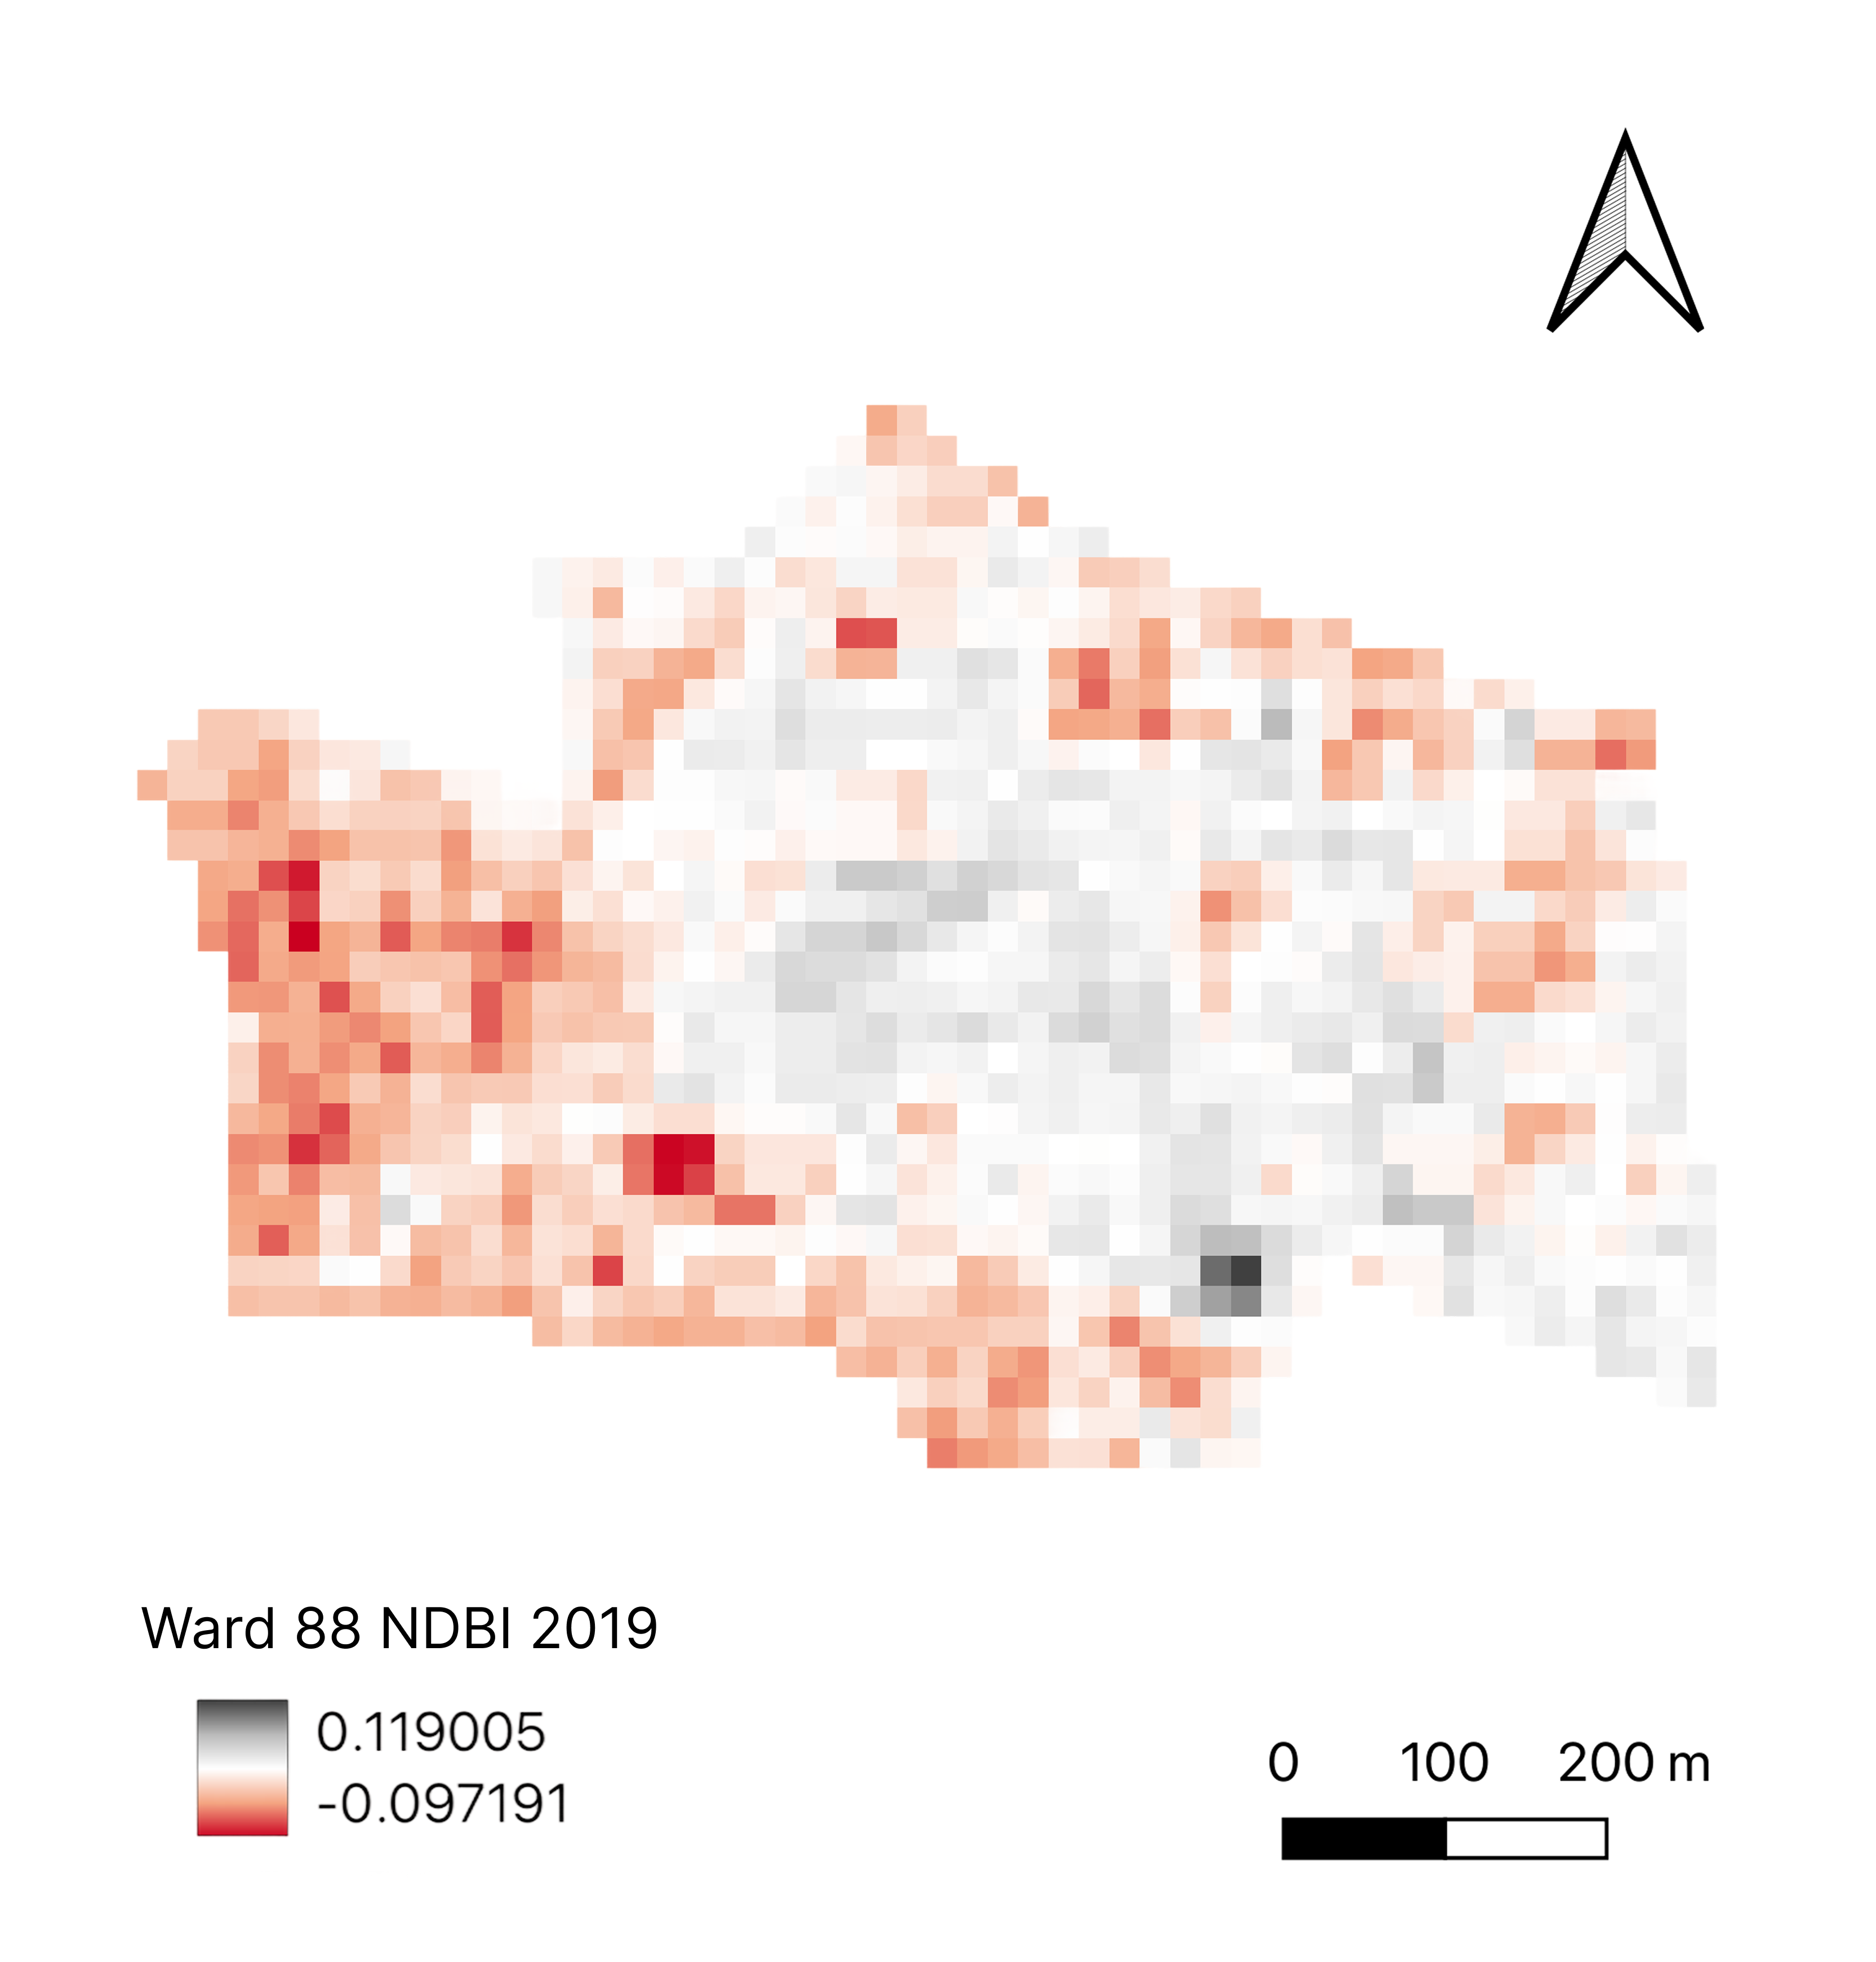
- NDBI (Normalized Difference Built-up Index): The Concrete Map. This map highlights where the buildings and roads are. These materials are like sponges for the sun’s heat. They soak it up all day and release it slowly at night, which keeps the city warm. The darker an area is red or grey, the more concretised it is.
- NDVI (Normalized Difference Vegetation Index): The Green Cover Map. This map shows where the plants and trees are. Healthy, dense vegetation appears as dark green, while areas with little to no plant life are lighter green or white. Trees and plants are like the city’s natural air conditioners—they provide shade and release water vapour to cool the air.
When we look at these three maps together, they tell a full story. More concrete (high NDBI) and fewer trees (low NDVI) mean the area will get hotter (high LST). This simple relationship is at the heart of the Urban Heat Island problem.
Bholakpur’s Decade in the Heat (2014-2024)
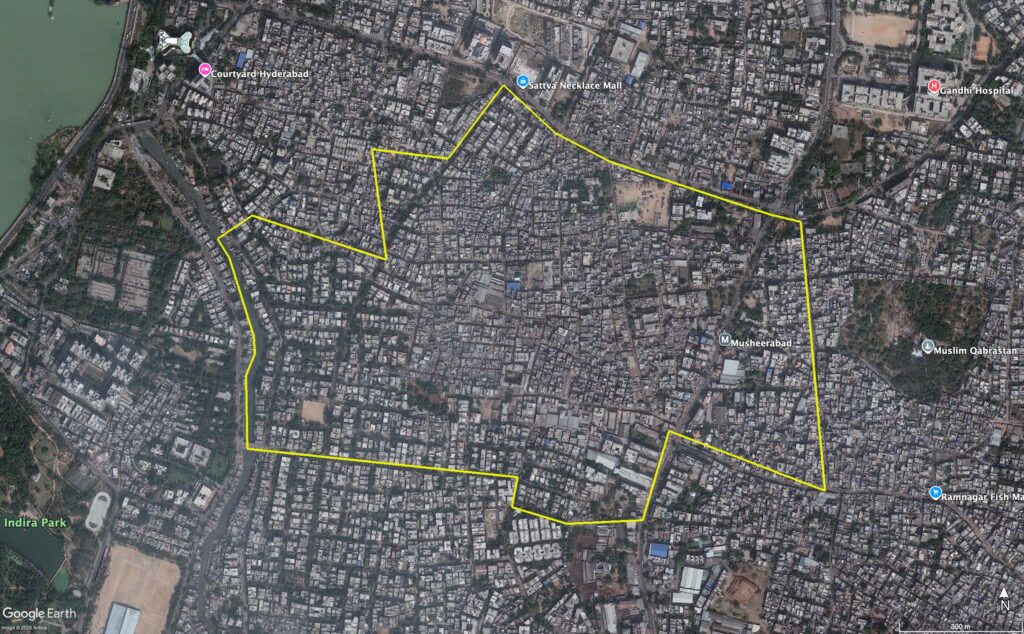
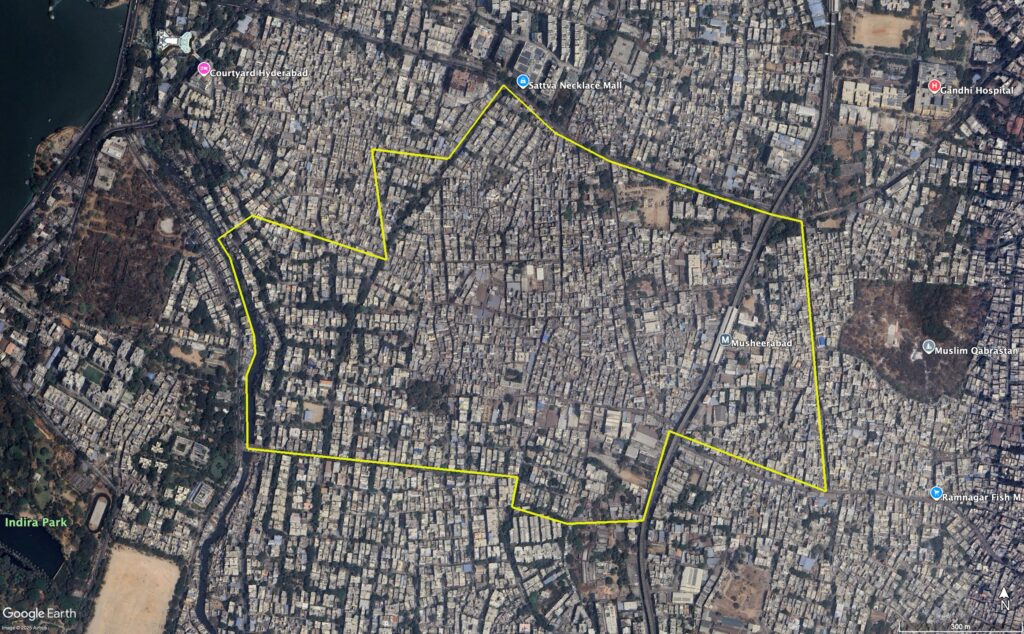
Bholakpur being one of the oldest parts of Hyderabad was heavily built up in 2014 and has since little change in 2024. Most of the development has moved to the outskirts, like the areas around the Hitech city. The Hussain Sagar lake nearby and the cemetery on the eastern side remain the only large green spaces around the ward.
The Rising Heat: The LST Story
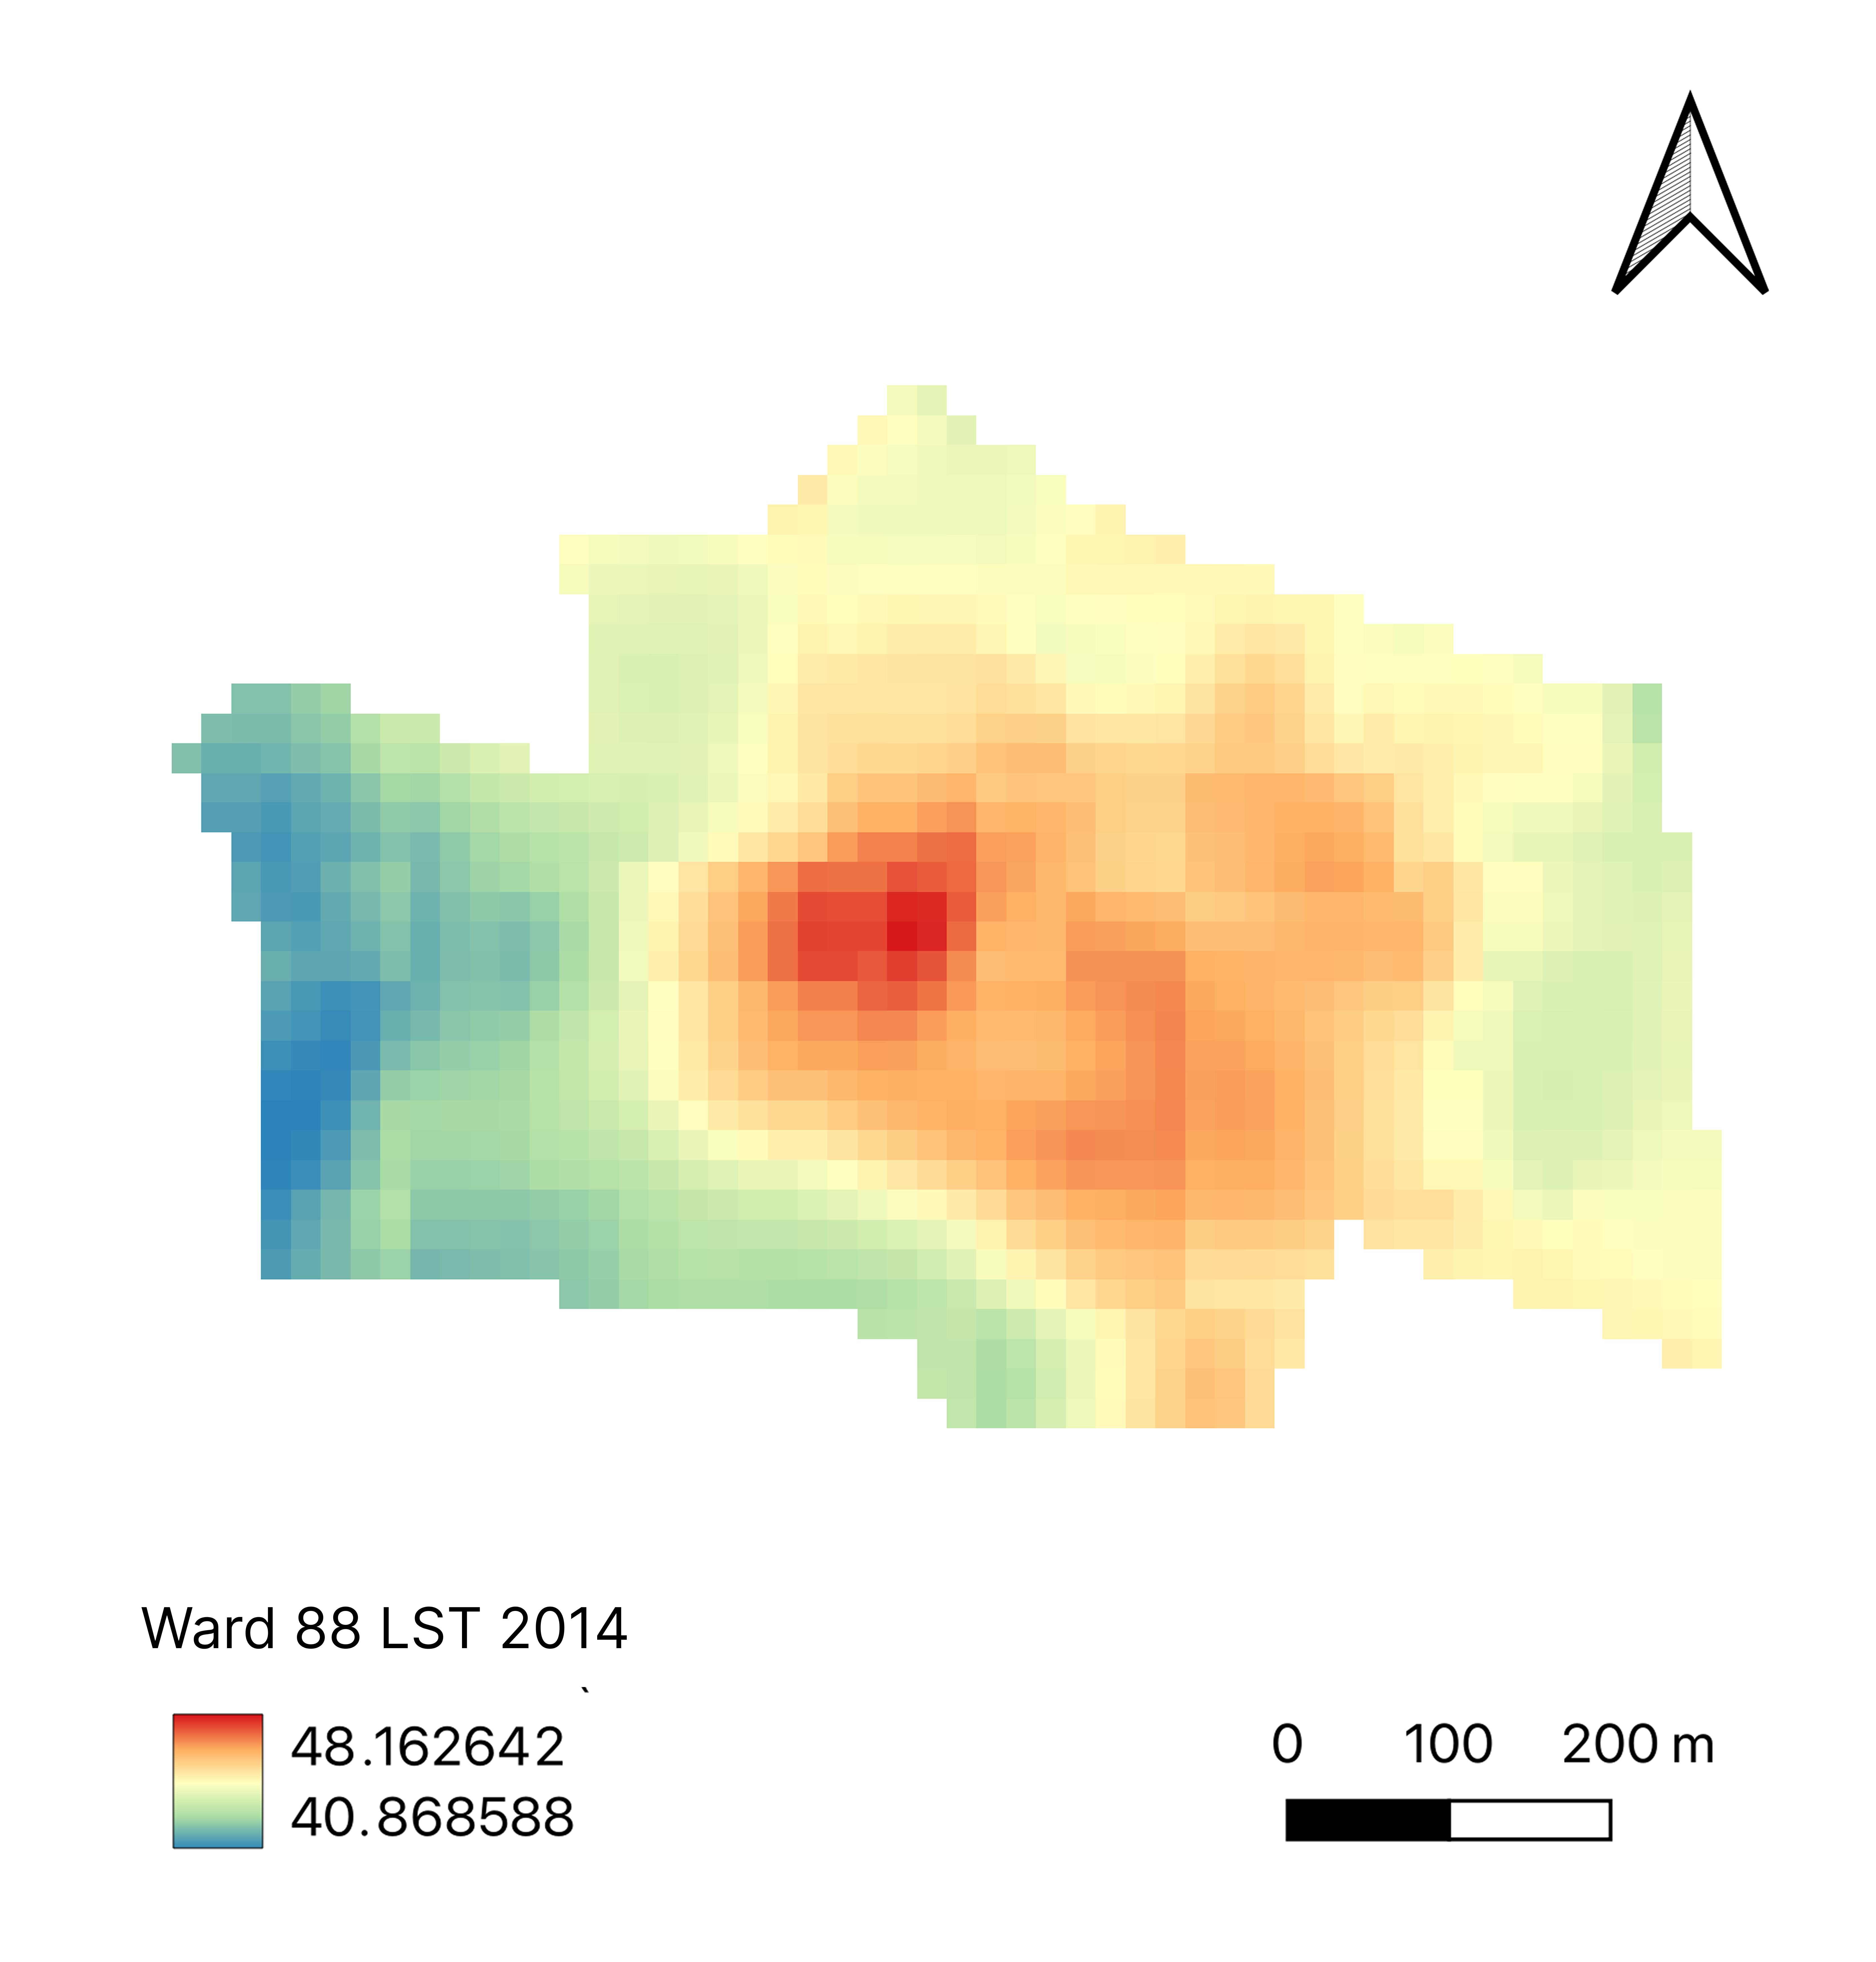
The heat maps for Bholakpur show a clear and worrying trend: the neighbourhood is getting hotter.
- 2014: The map shows a mix of temperatures. The median temperature was about 40.8°C. There were some hot, red areas, but also cooler green and blue patches.
- 2019: By this year, the median temperature had already crept up to 41.1°C. The hot, red areas started to spread and get more intense, and the cooler areas began to shrink.
- 2024: The most recent map shows a big jump. The median temperature surged to over 42.7°C. The central part of Bholakpur is now a fiery red hotspot, with temperatures soaring above 50°C in some places.
Over this decade, Bholakpur’s median temperature has increased by about 1.85°C. This shows that the Urban Heat Island effect is getting much stronger.
The Concrete March: The NDBI Story
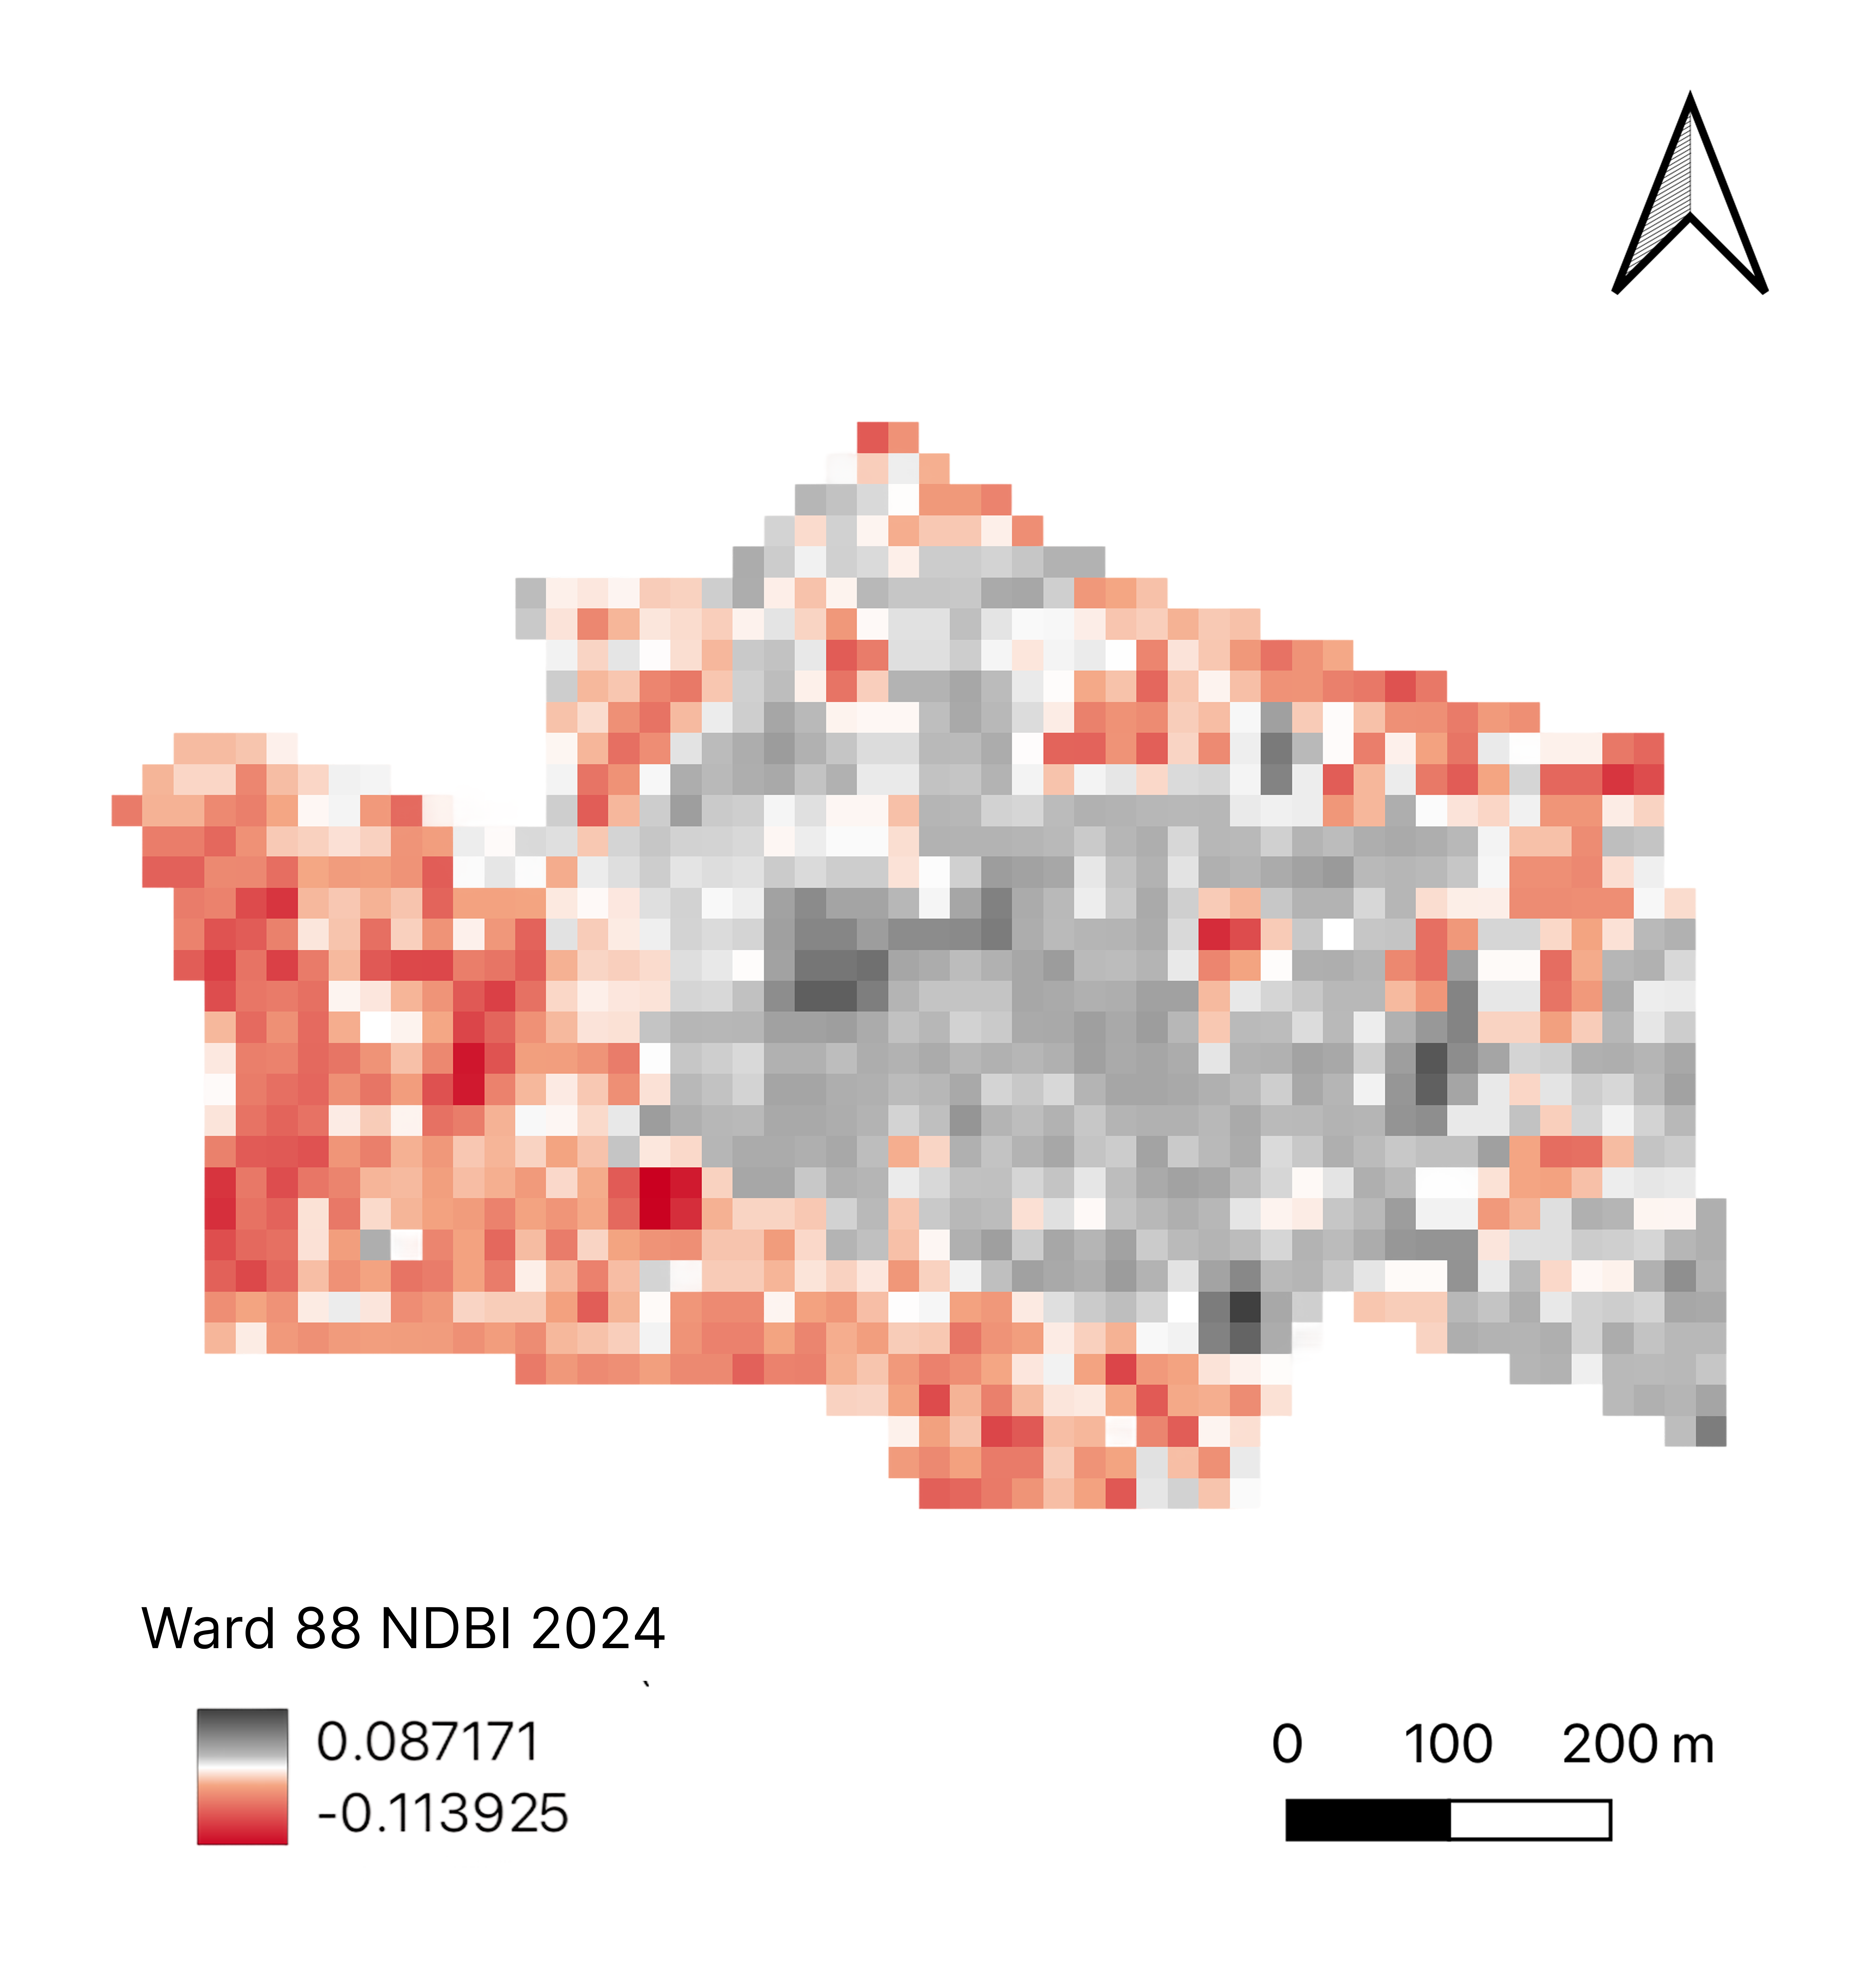
The concrete maps show us what’s driving this heat.
- 2014: The map already showed some built-up areas, seen in red and gray tones, especially in the western and southern parts of the neighborhood.
- 2019: The red and gray areas on the map had visibly expanded, suggesting that more buildings and roads were being built.
- 2024: The map for this year is interesting. While the overall numbers might have changed, the visual evidence shows that very hot, dark red and black zones remain in the same central and western areas. This tells us that even if new construction slowed down in some places, the existing concrete areas are still trapping a lot of heat.
These changes in an already built-up area suggest that the development could be happening vertically on existing buildings.
The Green Paradox: The NDVI Story
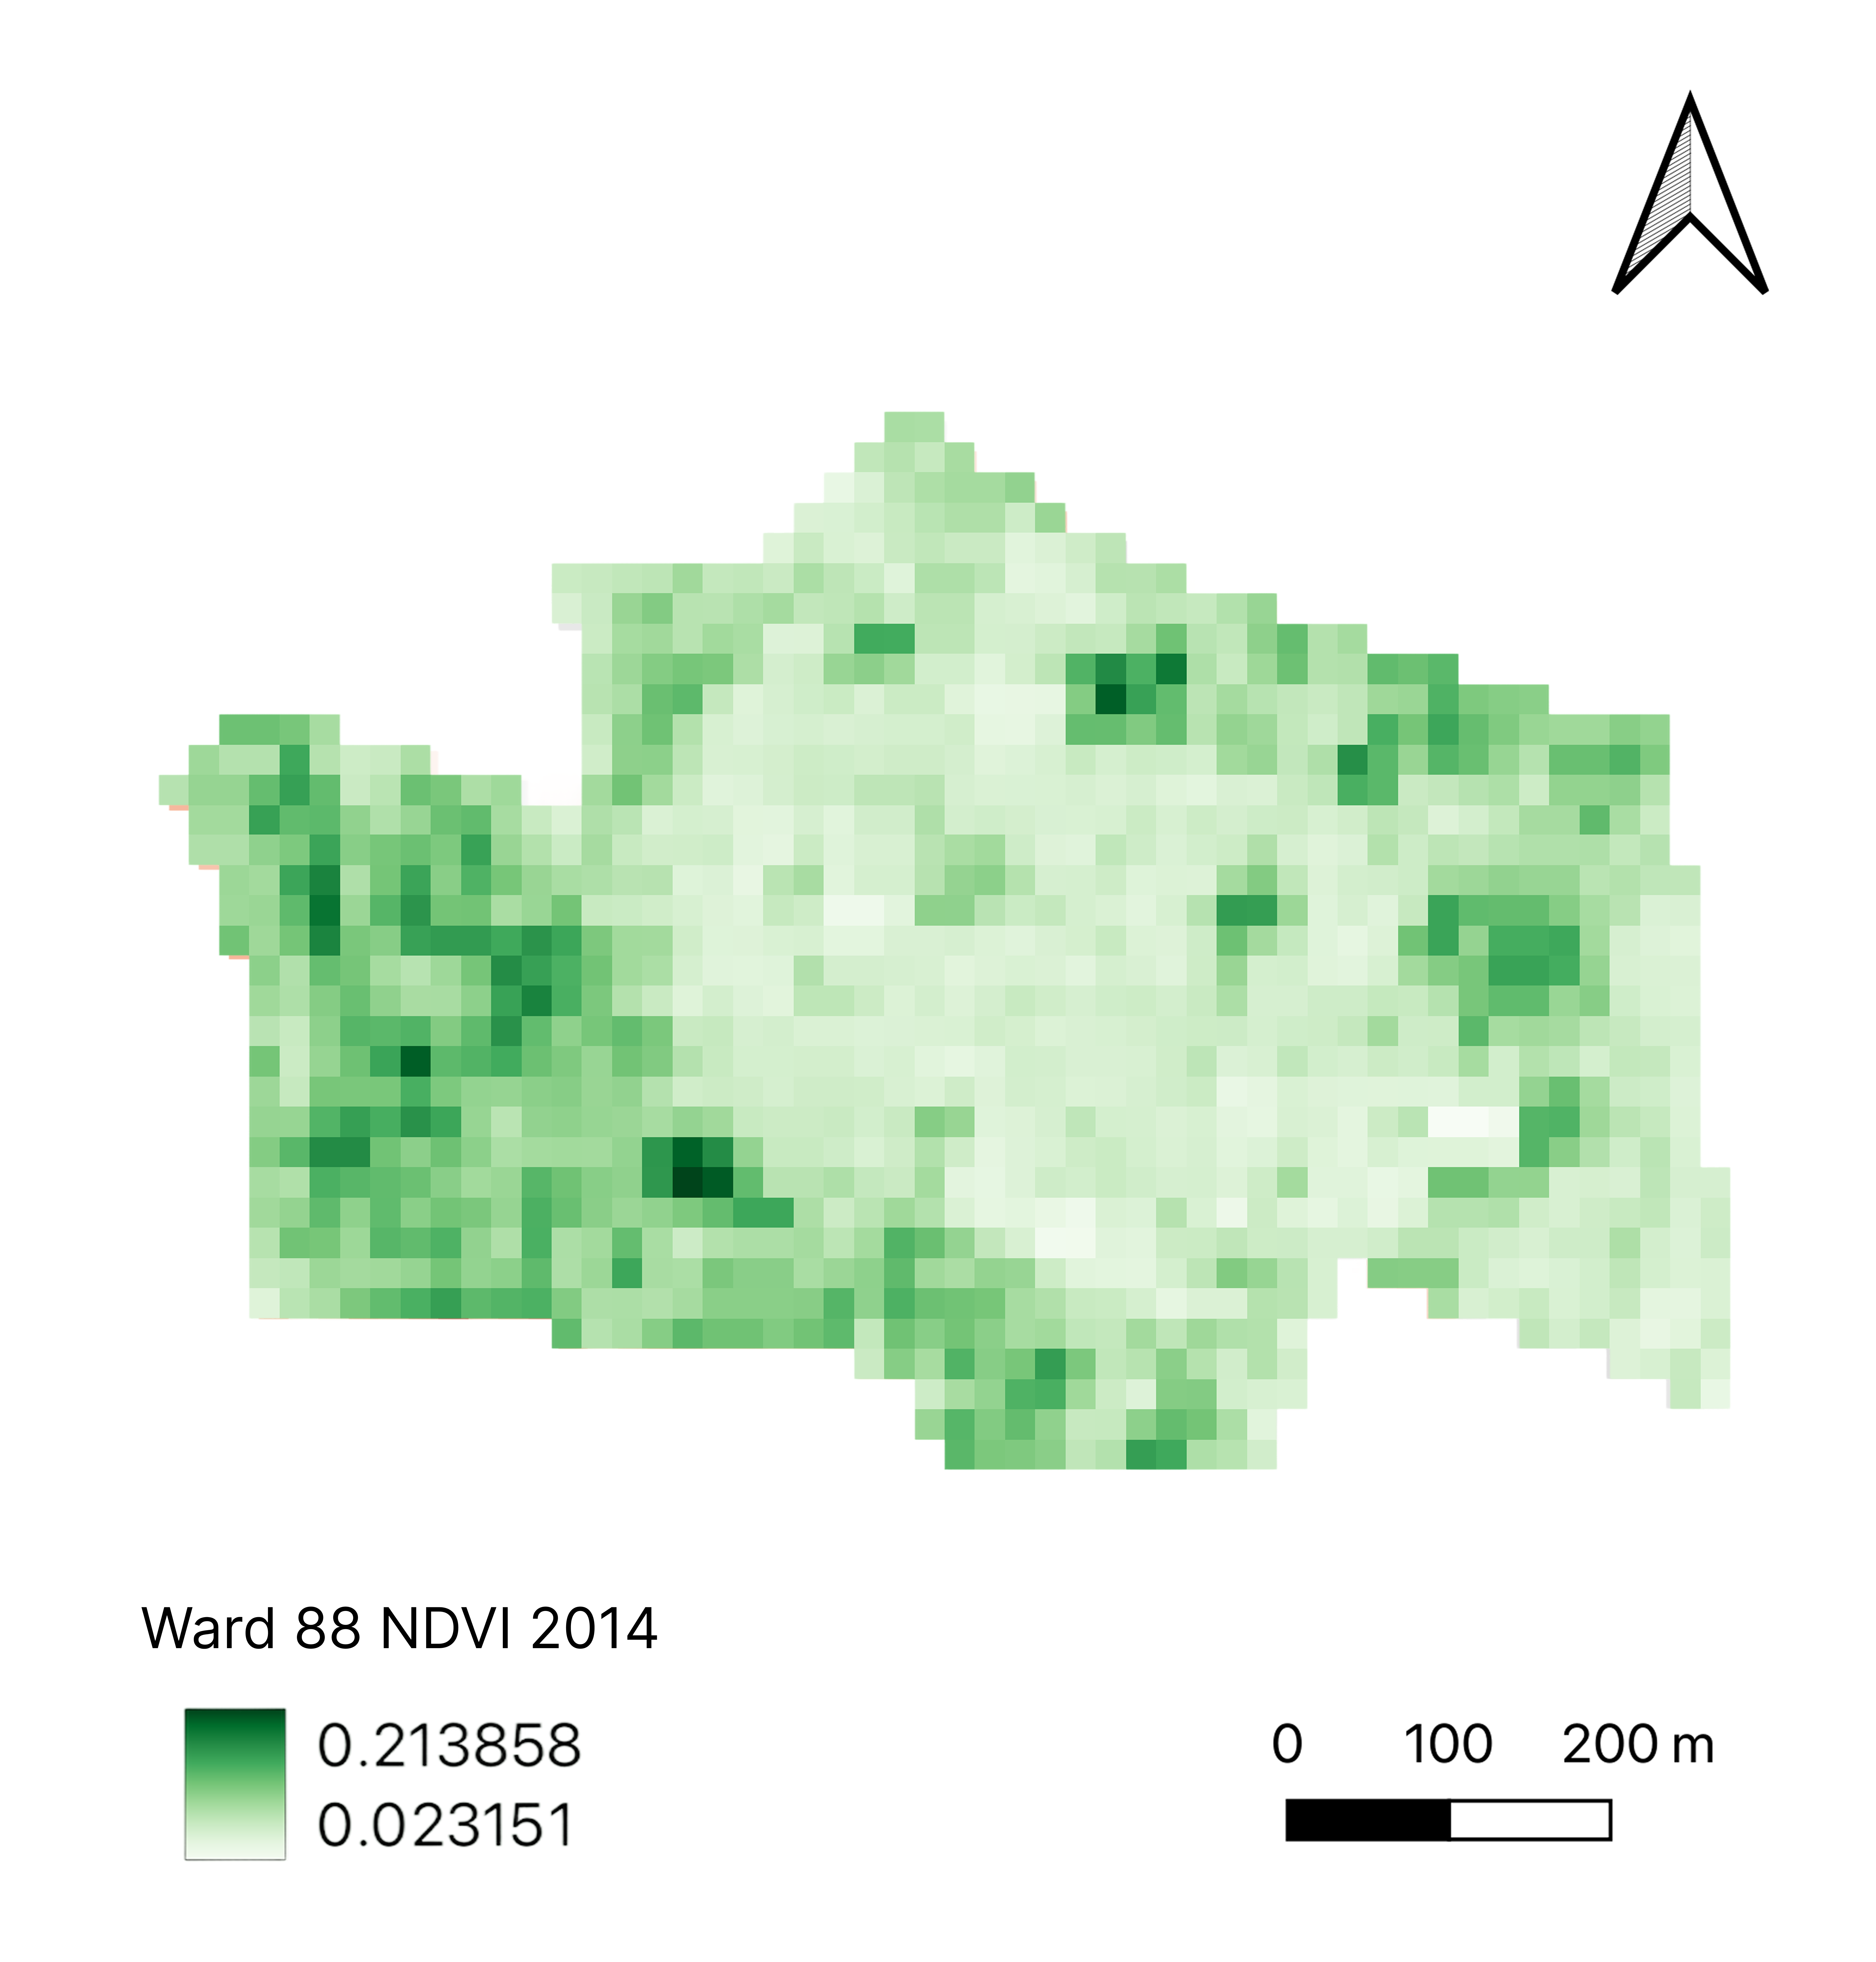
The green cover maps reveal a surprising fact.
- 2014: The map had a fair amount of green, especially in the western and northern parts of the ward.
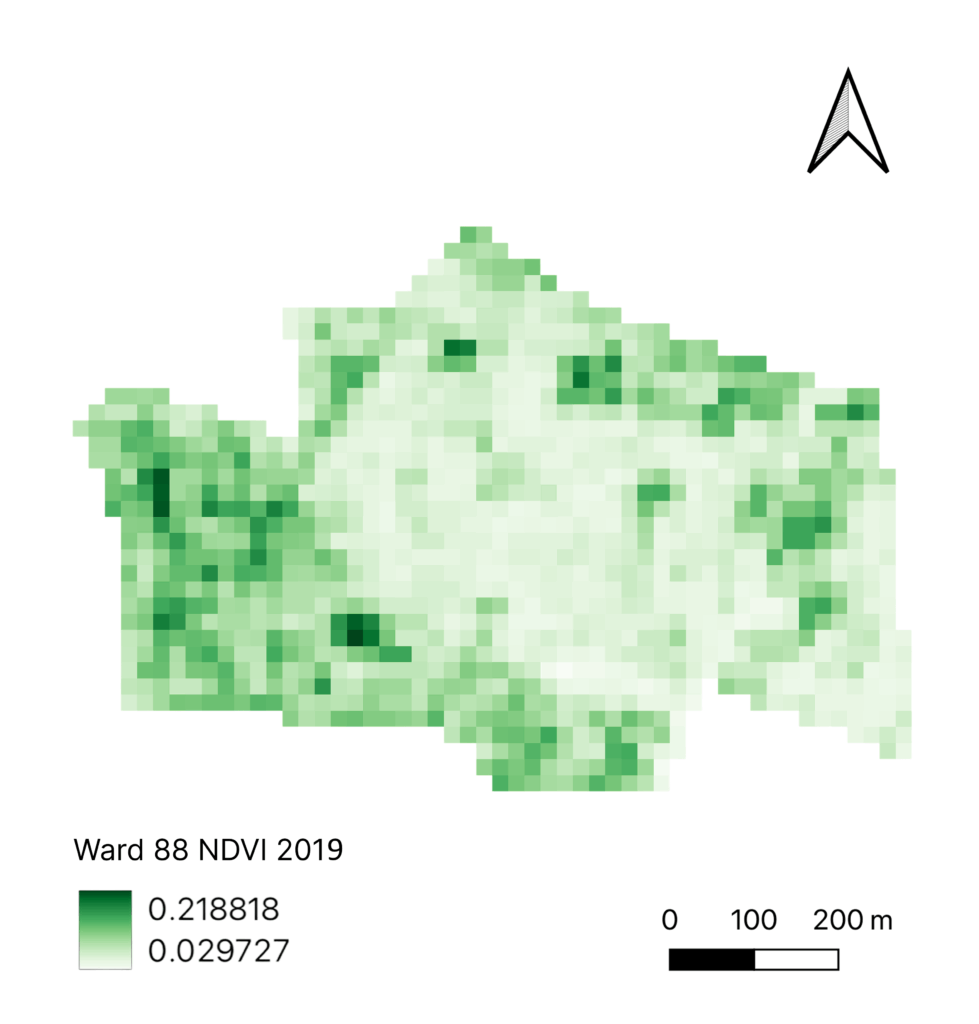
- 2019: The amount of green cover actually increased slightly (Image 8).
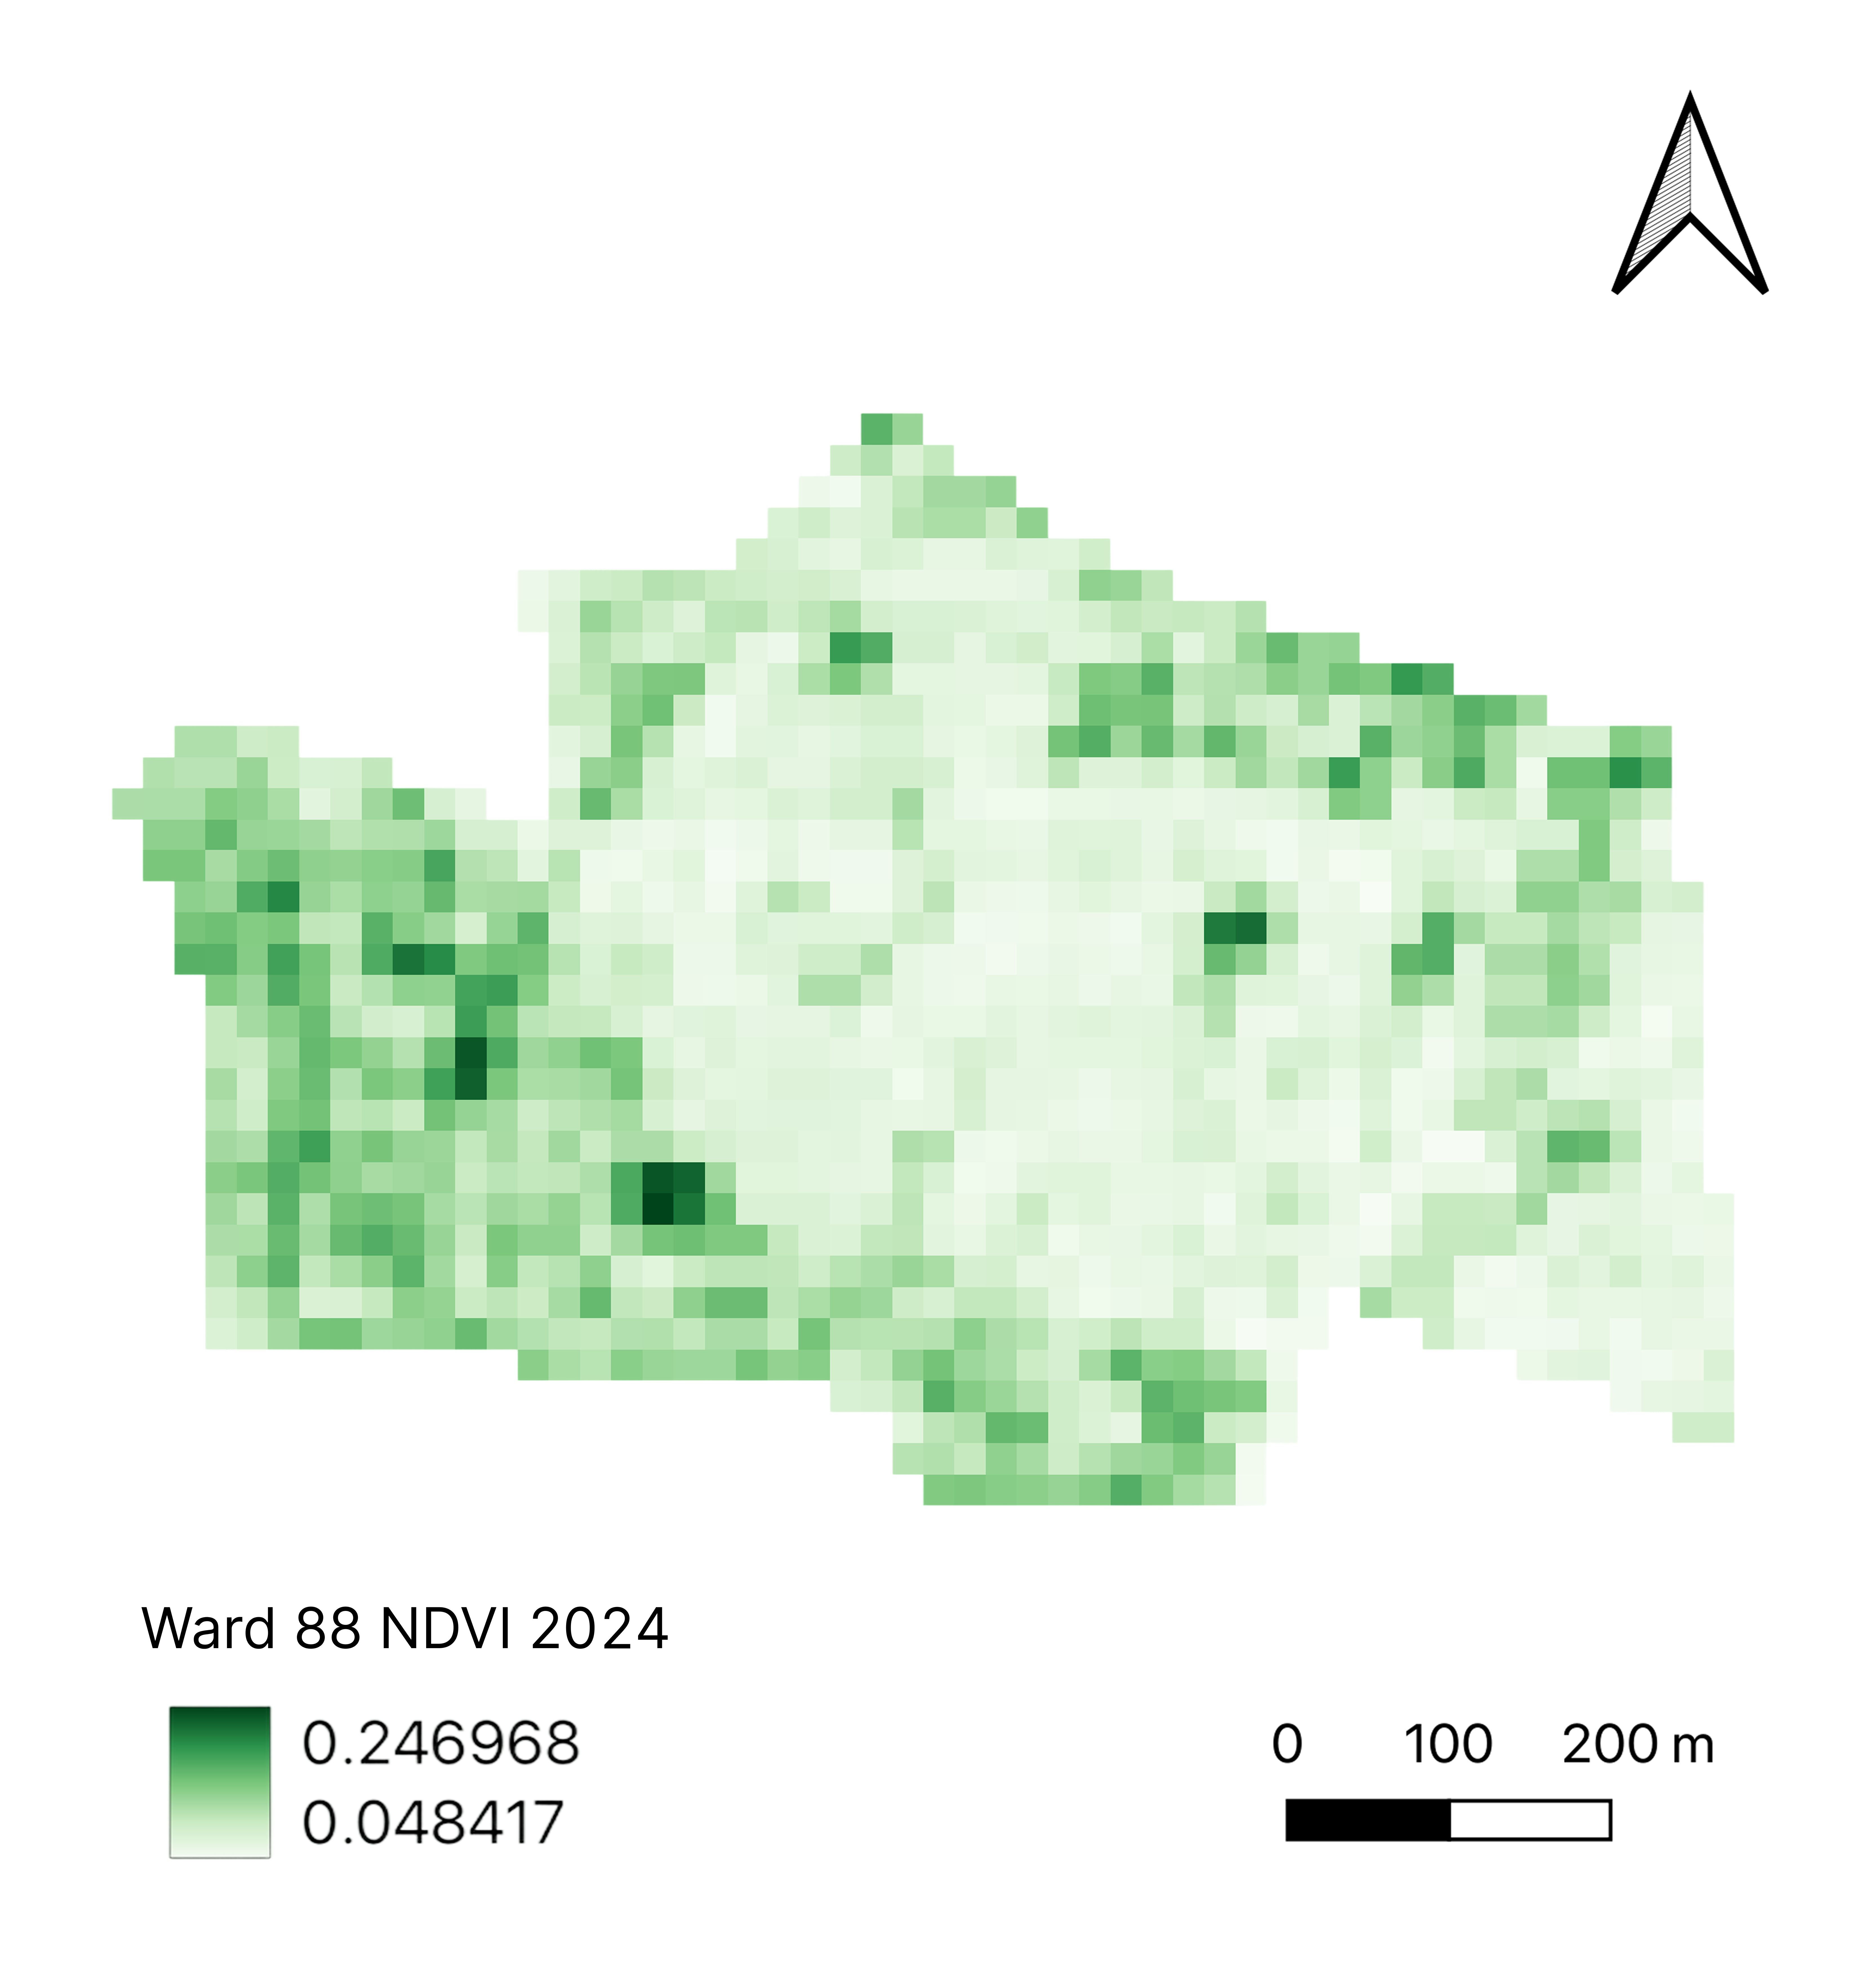
- 2024: The latest map shows an even greater increase in green cover overall.
This seems to be a contradiction: if Bholakpur has more green cover, why is it getting hotter? This is the “green paradox.” It shows us that simply having more green spaces isn’t enough. The small gains in greenery are likely not placed in the right spots to cool down the hottest parts of the neighborhood. The heat-trapping power of all the concrete and human activity is simply too strong for the scattered green patches to make a big difference. The type of green cover also matters; a few small trees don’t provide the same cooling as a dense canopy of large trees.
A Decade of Change
| Year | Median LST (°C) | Median NDBI | Median NDVI | What the Maps Tell Us |
| 2014 | 40.868588 | 0.099415 | 0.213858 | A mix of temperatures; existing built-up areas; noticeable green patches. |
| 2019 | 41.104431 | 0.119005 | 0.218818 | Warming trend begins; concrete areas grow; green spaces are mostly kept. |
| 2024 | 42.717736 | 0.087171 | 0.246968 | Huge temperature jump; new heat hotspots appear; green cover increases slightly. |
Why Bholakpur is Warming: The Main Causes
The heat in Bholakpur is a result of a few connected factors:

- Microclimate and Land Use: A key reason for the intense heat in Bholakpur is the difference in its urban layout. The central part of the neighborhood, which is also a commercial area, is a major heat hotspot. This is because of the dense, small, and congested housing there, which traps heat. In contrast, the buildings in the western part of the neighborhood have a cooler microclimate. This is likely because they are on bigger plots with more green cover and are part of a better-planned layout with wider roads, which allows for better airflow and heat to escape. This difference in urban design is a major reason why one area stays cooler while the other becomes a heat trap.
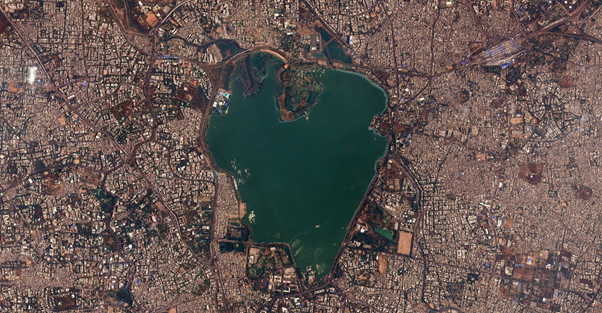
- A Lake’s Limited Reach: Even though there is a large lake, Hussain Sagar, located right next to Bholakpur, its cooling effect isn’t strong enough to reach the central, hottest parts of the neighborhood. The dense built-up area and the type of land use act as a barrier, preventing the cool air from the lake from circulating and providing relief where it’s needed most. This highlights that even with a significant natural cooler nearby, poor urban planning can completely block its benefits.
- More Concrete, Less Nature: The biggest reason is the replacement of natural land with concrete and asphalt, which hold onto heat.
- Loss of Natural Cooling: Even with the slight increase in green cover, the natural cooling from trees and plants is not enough to fight the overwhelming heat. This is because we lose the cooling power of shade and evotranspiration.
- Human Activity: Our daily lives add to the heat. Cars, air conditioners, and other industries all release heat into the air, making the problem worse.
- City Design: The way buildings are packed together can also trap heat and stop cool air from moving around.
A Path to a Cooler Future: Simple Solutions
To fight the Urban Heat Island effect in Bholakpur, we need a few simple but powerful strategies:
- Plant More Trees, and Place Them Smartly: While Bholakpur has seen an increase in green cover, we need to focus on planting trees in the hottest areas. Big, leafy trees and urban gardens provide much more shade and cooling than small, scattered plants. The state’s “The Telangana Ku Haritha Haram” program is a great start, but it needs to be targeted at the parts of Bholakpur that need it most.
- Build Smarter: We can use building materials that reflect sunlight instead of absorbing it, like “cool roofs”. We should also bring back traditional building designs that use natural airflow to keep homes cool.
- Plan Better: City planners should create wider streets and more open spaces that allow fresh air to circulate and let heat escape. This kind of planning helps stop the heat from getting trapped.
- Get Everyone Involved: The community needs to work together. Raising awareness about heat risks and encouraging everyone to save energy and use sustainable practices is a powerful tool. Involving local people, especially the most vulnerable, in planning these solutions is the only way to make them work for everyone.
Conclusion: A Choice for Bholakpur’s Future
Bholakpur’s story is a clear warning. The maps show a neighborhood that is getting hotter, even though it is a highly built-up old area. Even small efforts to add greenery and the presence of a large nearby lake are not enough to combat the big problem of widespread concrete and other human-made heat sources.
But this story doesn’t have to end here. By using smart, data-driven planning and working together, Bholakpur can become a model for a cooler, healthier, and fairer urban future. This means making sure that as the neighborhood grows, its residents—including its children and its working families—are protected from the rising heat. This is a choice we have to make, not just for the environment, but for the people who live there.