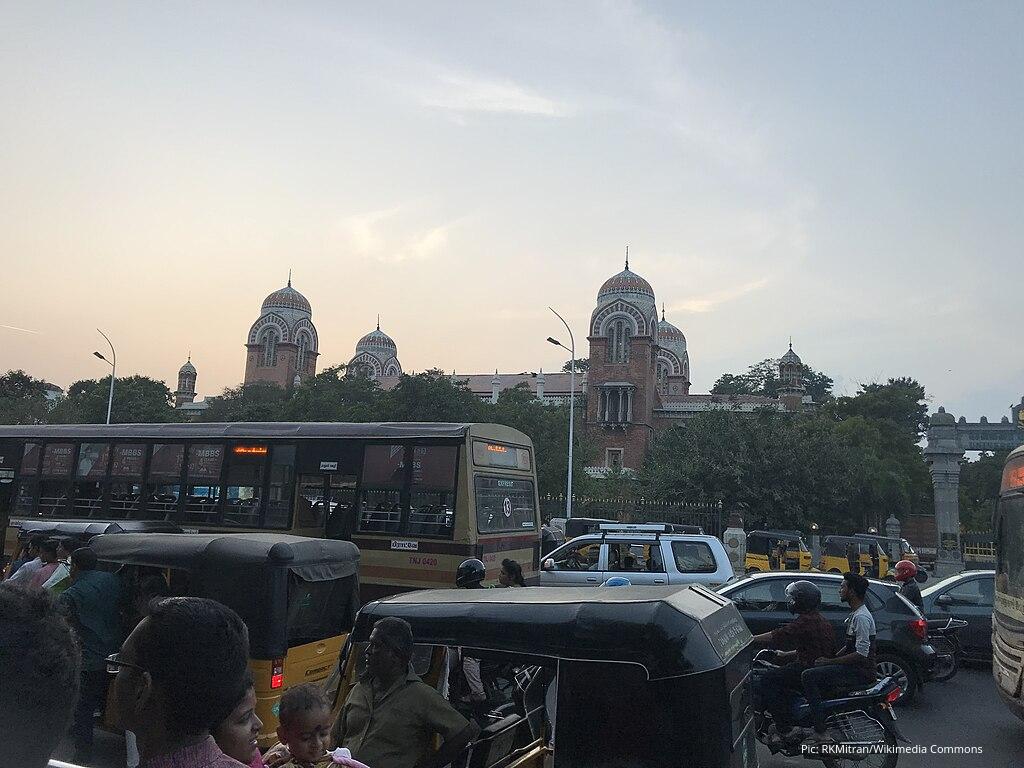
The CIT Nagar signal in 2012 was my crash course in Chennai’s beautiful chaos. Standing in the rain, timing a sprint through auto-rickshaws and cars to grab the MTC bus door before it moved—that’s when I learned commuting here is equal parts art, science, and survival instinct.
I’d position myself strategically, watch for the 23C or 1B, then run between vehicles to catch the footboard while the bus rolled. Some days I’d jump off an overcrowded bus and sprint to catch another at the same signal. Newcomers to Chennai learn this choreographed routine—or suffer through it.
That footboard phase became a 12‑year observation of how a city’s transportation system reflects our relationship with collective responsibility.
From Footboards to SUVs
My commute mirrored the city’s transformation. From those footboard days, I walked to Saidapet bus stop just to get a seat. Then came pillion rides from Tiruvallikeni to Mount Road, and a brief experiment with bringing my sedan from my hometown.
The car phase was revelatory. Sitting alone in a large vehicle, crawling through the same jams I’d watched from bus windows, I felt the inefficiency in my bones. The car wasn’t making me faster or happier—it was isolating me from the city while burning money and adding to the congestion I was stuck in.
I sold the car, switched to a two‑wheeler, now primarily take Metro for office commutes. For short trips, I still prefer auto-rickshaws: open windows, the city unfolding, no sealed‑off bubble.
The Entropy Problem
Over the past decade, Chennai’s traffic entropy has risen—not just in volume but in the nature of movement. Single drivers in luxury SUVs heading to parks for morning walks; bulky Fortuners squeezing down narrow streets for 2‑km gym runs; phones at ears, tiny slowdowns rippling into full‑road delays.
As someone from media, pattern‑spotting is muscle memory. The pattern I kept seeing: a disconnect between individual convenience and collective impact. I understand the need for personal vehicles—Chennai’s geography, weather and infrastructure make them necessary for many trips. But where’s the line between personal convenience and collective harm?
That question kept nagging at me. We all know we’re part of the problem, but we rarely quantify it. The costs stay invisible. What if there was a way to make those trade-offs visible? What if people could see, in concrete numbers, what their commute choices actually cost?
That’s when I started thinking about building a calculator.
Building the Tool
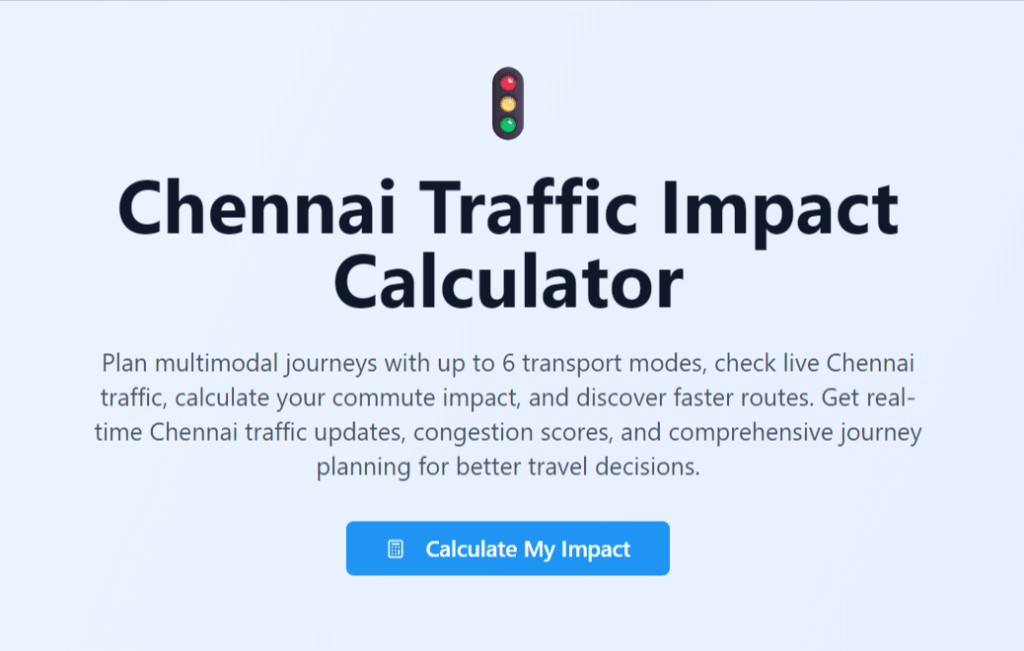
The idea sat in my notes for months. I kept dismissing it as too complex. Then I simply decided to build it—not to preach, but to provide clarity. Chennai’s road space is finite, yet most trips are one person in one vehicle. A calculator could make those invisible costs visible so commuters can right‑size trips and the city can talk about mobility with shared numbers.
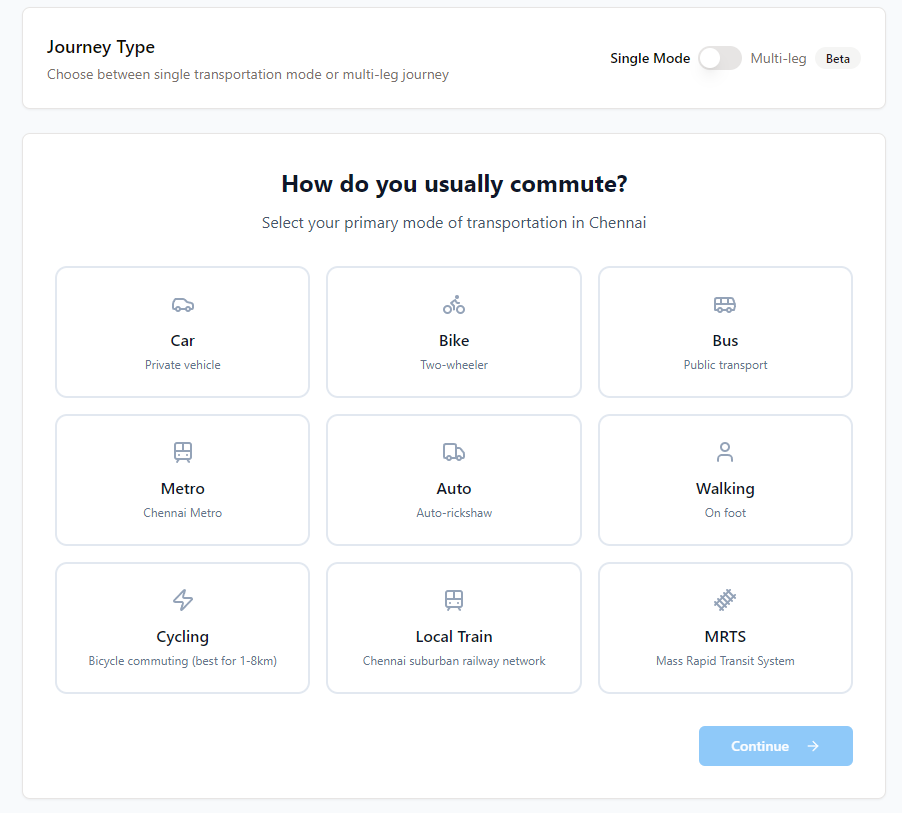
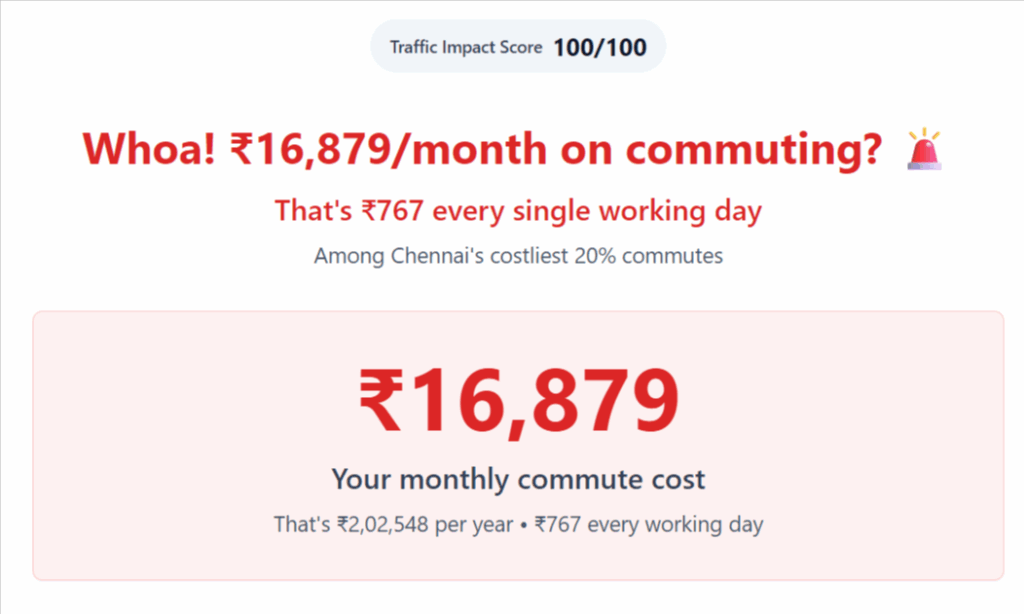
The Chennai Traffic Impact Calculator gives you a Commute Impact Score (0–100) with clear bands: Excellent / Good / Moderate / Poor. It shows money, CO₂, and time per month for your current commute, then suggests practical alternatives—Metro trunk + auto/walk last‑mile, carpool, off‑peak timing, EV on same route—and quantifies the change in rupees, CO₂, and minutes.
My own commute currently scores 44/100. Like everyone, I’m imperfect. The goal isn’t guilt; it’s transparency about trade-offs.
The Mechanics
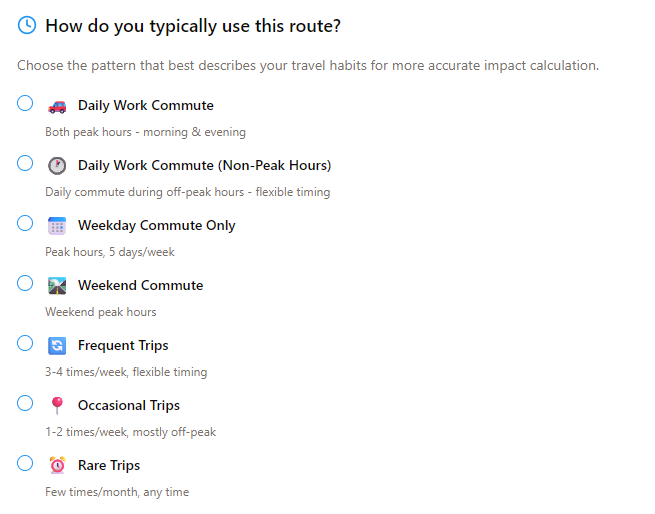
The score blends four factors: per‑person emissions for your chosen mode, out‑of‑pocket costs, time and reliability (including time‑of‑day effects), and occupancy (solo vs shared).
The calculator computes these from user inputs—origin, destination, mode, occupancy, frequency, time‑of‑day—then normalizes to the 0–100 scale, where a lower score is better. Alternatives use the same model with different assumptions, displaying the deltas so people can choose what to trade off without being judged.
The Philosophy
Three principles drive the scoring:
Finite road space: Each single‑occupancy vehicle consumes disproportionate throughput and curb space.
Congestion externalities: Individual “sensible” choices aggregate into slower buses, riskier crossings, higher emissions for all.
Feedback loops: Car‑first patterns reduce bus reliability, nudge more people into cars, make walking/Metro first‑mile–last‑mile harder.
A 10‑km car commute might score in the 60s, cost more, and emit far more CO₂ than the same trip by Metro. The calculator quantifies these trade-offs without judgment.
What 774 Trips Revealed
Since launch, the data tells a clear story:
How Chennai moves: Two‑wheeler (41.6%), Car (36.0%), Metro (7.2%), Bus (7.4%), Auto (4.0%), Walk (3.6%).
The occupancy problem: Cars are 76.7% single‑occupant; two‑wheelers are 90.7% single‑rider.
The trade-offs: Choosing car over Metro typically costs ₹2,020 more per month, adds 65kg CO₂, but saves 8.4 hours. That’s ₹240 and 7.7kg CO₂ for every hour saved.
Impact distribution: 44.6% of trips score Excellent, 31.5% Good, 9.4% Moderate, 14.5% Poor.
What alternatives offer:
- Metro: 41-point impact reduction, ₹600 monthly savings
- Carpooling (2–3 people): 67-point reduction, ₹200 savings
- Off‑peak timing: 44-point reduction, no cost change
- Electric switch: 40-point reduction, ₹400 savings
- Walking short trips: 75-point reduction, ₹900 savings

The Real Problem
The data reveals Chennai’s core issue: we’re using space to move vehicles, not people. Private, single‑person trips make up 78% of entries. That eats limited lane and curb space, slows buses, nudges even more people toward private modes—a self‑reinforcing loop.
The solution isn’t scolding convenience; it’s right‑sizing trips. Make shared and trunk transit reliable, fix first/last‑mile friction, reward occupancy.
Three key learnings
Clear data nudges behavior. When commuters see monthly rupees, CO₂, and hours side‑by‑side, many try lower‑impact options at least some days.
Public transport works; the edges don’t. Metro and bus often score well; the work is in first‑mile/last‑mile and predictability.
Individual accountability scales. Traffic is a collective‑action puzzle. Each of us acts rationally given our constraints; the aggregate outcome is irrational for everyone. Awareness at trip level is the scalable lever.
Technical Foundation
The calculator draws from auditable sources: emission factors per passenger‑km, public transport fares and rules, fuel prices and operating costs, corridor speed profiles with time‑of‑day effects, maps services for routing, weather flags for practical advice.
All sources are documented at chennaitrafficcalc.in/data-sources so others can audit and adapt.
Replication Guide
Keep the recipe, localize inputs: Swap your city’s emission factors, fares, fuel prices, speeds, peak multipliers, grid intensity.
Use the same framework: origin–destination + mode + occupancy + frequency → Impact Score + monthly costs/CO₂/time + alternatives with deltas.
Start small: Focus on known corridors, expand as data accumulates.
Lead with cost, not guilt: Financial messaging drives adoption and still reduces emissions.
Full methodology at chennaitrafficcalc.in/methodology and chennaitrafficcalc.in/how-it-works.
Next Steps
City starter packs: Lightweight configs for Bengaluru, Hyderabad, Pune and beyond to launch quickly.
Call to Action
Try your route at chennaitrafficcalc.in. Share results with colleagues or resident welfare groups. If you’re part of a civic group, ward committee, or urban planning organization, let’s collaborate on adapting this for your city.
Built with open civic intent for Chennai, designed to be reused everywhere.
Comments
2 responses to “A Calculator to Measure Chennai’s Traffic Reveals the Main Issue”
This insightful article highlights a critical urban issue through a practical calculator, making traffics personal and collective costs tangible. It’s a powerful call for mindful commuting choices.
What is the current status of the use and functioning of this tool and benefits ? Do you have a team who works on this cause ?