What is an Economic Census?
The Economic Census in India is a periodic activity to count all entrepreneurial units in the country. These units could be involved in economic activities of either agricultural or non-agricultural kind, but they need to be producing, distributing or services not for their own consumption. The census provides detailed information not only about the number of units, but also about the nature of the businesses, number of men and women who are employed, both hired and temporary, source of finance and type of ownership of the businesses.
The economic census is conducted by the Central Statistical Organisation under the Ministry of Statistics and Program Implementation, Government of India. The last economic census conducted, which was the seventh Economic Census overall, was in 2019. The data for that is not in the public domain yet. The one before that, the sixth, was conducted in 2013 and the data for that for Bengaluru, specifically the BBMP area, can be found here.
What does the Sixth Economic Census find about Bengaluru?
The enumeration of the sixth economic census (2013) counted 3,60,785 establishments in the BBMP area. These establishments employed a total of close to 15 lakh (1,498,875 to be precise) persons, of which 4.1 lakh persons were not hired workers. Women constituted only 26% of the workforce totaling 3.91 lakh workers. 16% of the women were not hired (temporary) while the percentage of men who were temporary was 31%.

In terms of the sectors where the workers are employed, the largest sector was retail sales which employed close to 24% of the total workforce. This was followed by apparel manufacture which accounted for 10% of the work force.

For women, the apparel manufacturing sector was by far the largest employer, accounting for 21% of the workforce, followed at some distance by “Retail sales for other specialized goods”. Among the top five sectors for women, education (primary, secondary, higher and other), health services and computer programming made up the rest.

However, for men the largest sector was sales. Sales of miscellaneous goods put under “Retail sale of other goods in specialized stores” accounted for 6.5% of the workforce followed by “Retail sale of other household equipment in specialized stores” which accounted for 6.14%. In fact, retail sales accounted for 25% of the employment for men.

The apparel industry was a major employer of men too, employing 6.1% of the male workforce. Interestingly, the second highest sector was of food. This included the categories – Restaurants and mobile food service activities, event catering and beverage serving activities. Apparel manufacture employed 68000 men, not too far behind the 82000 women employed by the sector.
Fourth in the top sectors for men is the transport sector – cabs and goods movers. This is followed by the software industry. It would be interesting to see how things have changed since this time by the arrival of e-commerce and food delivery startups.
Where are the jobs in Bengaluru?
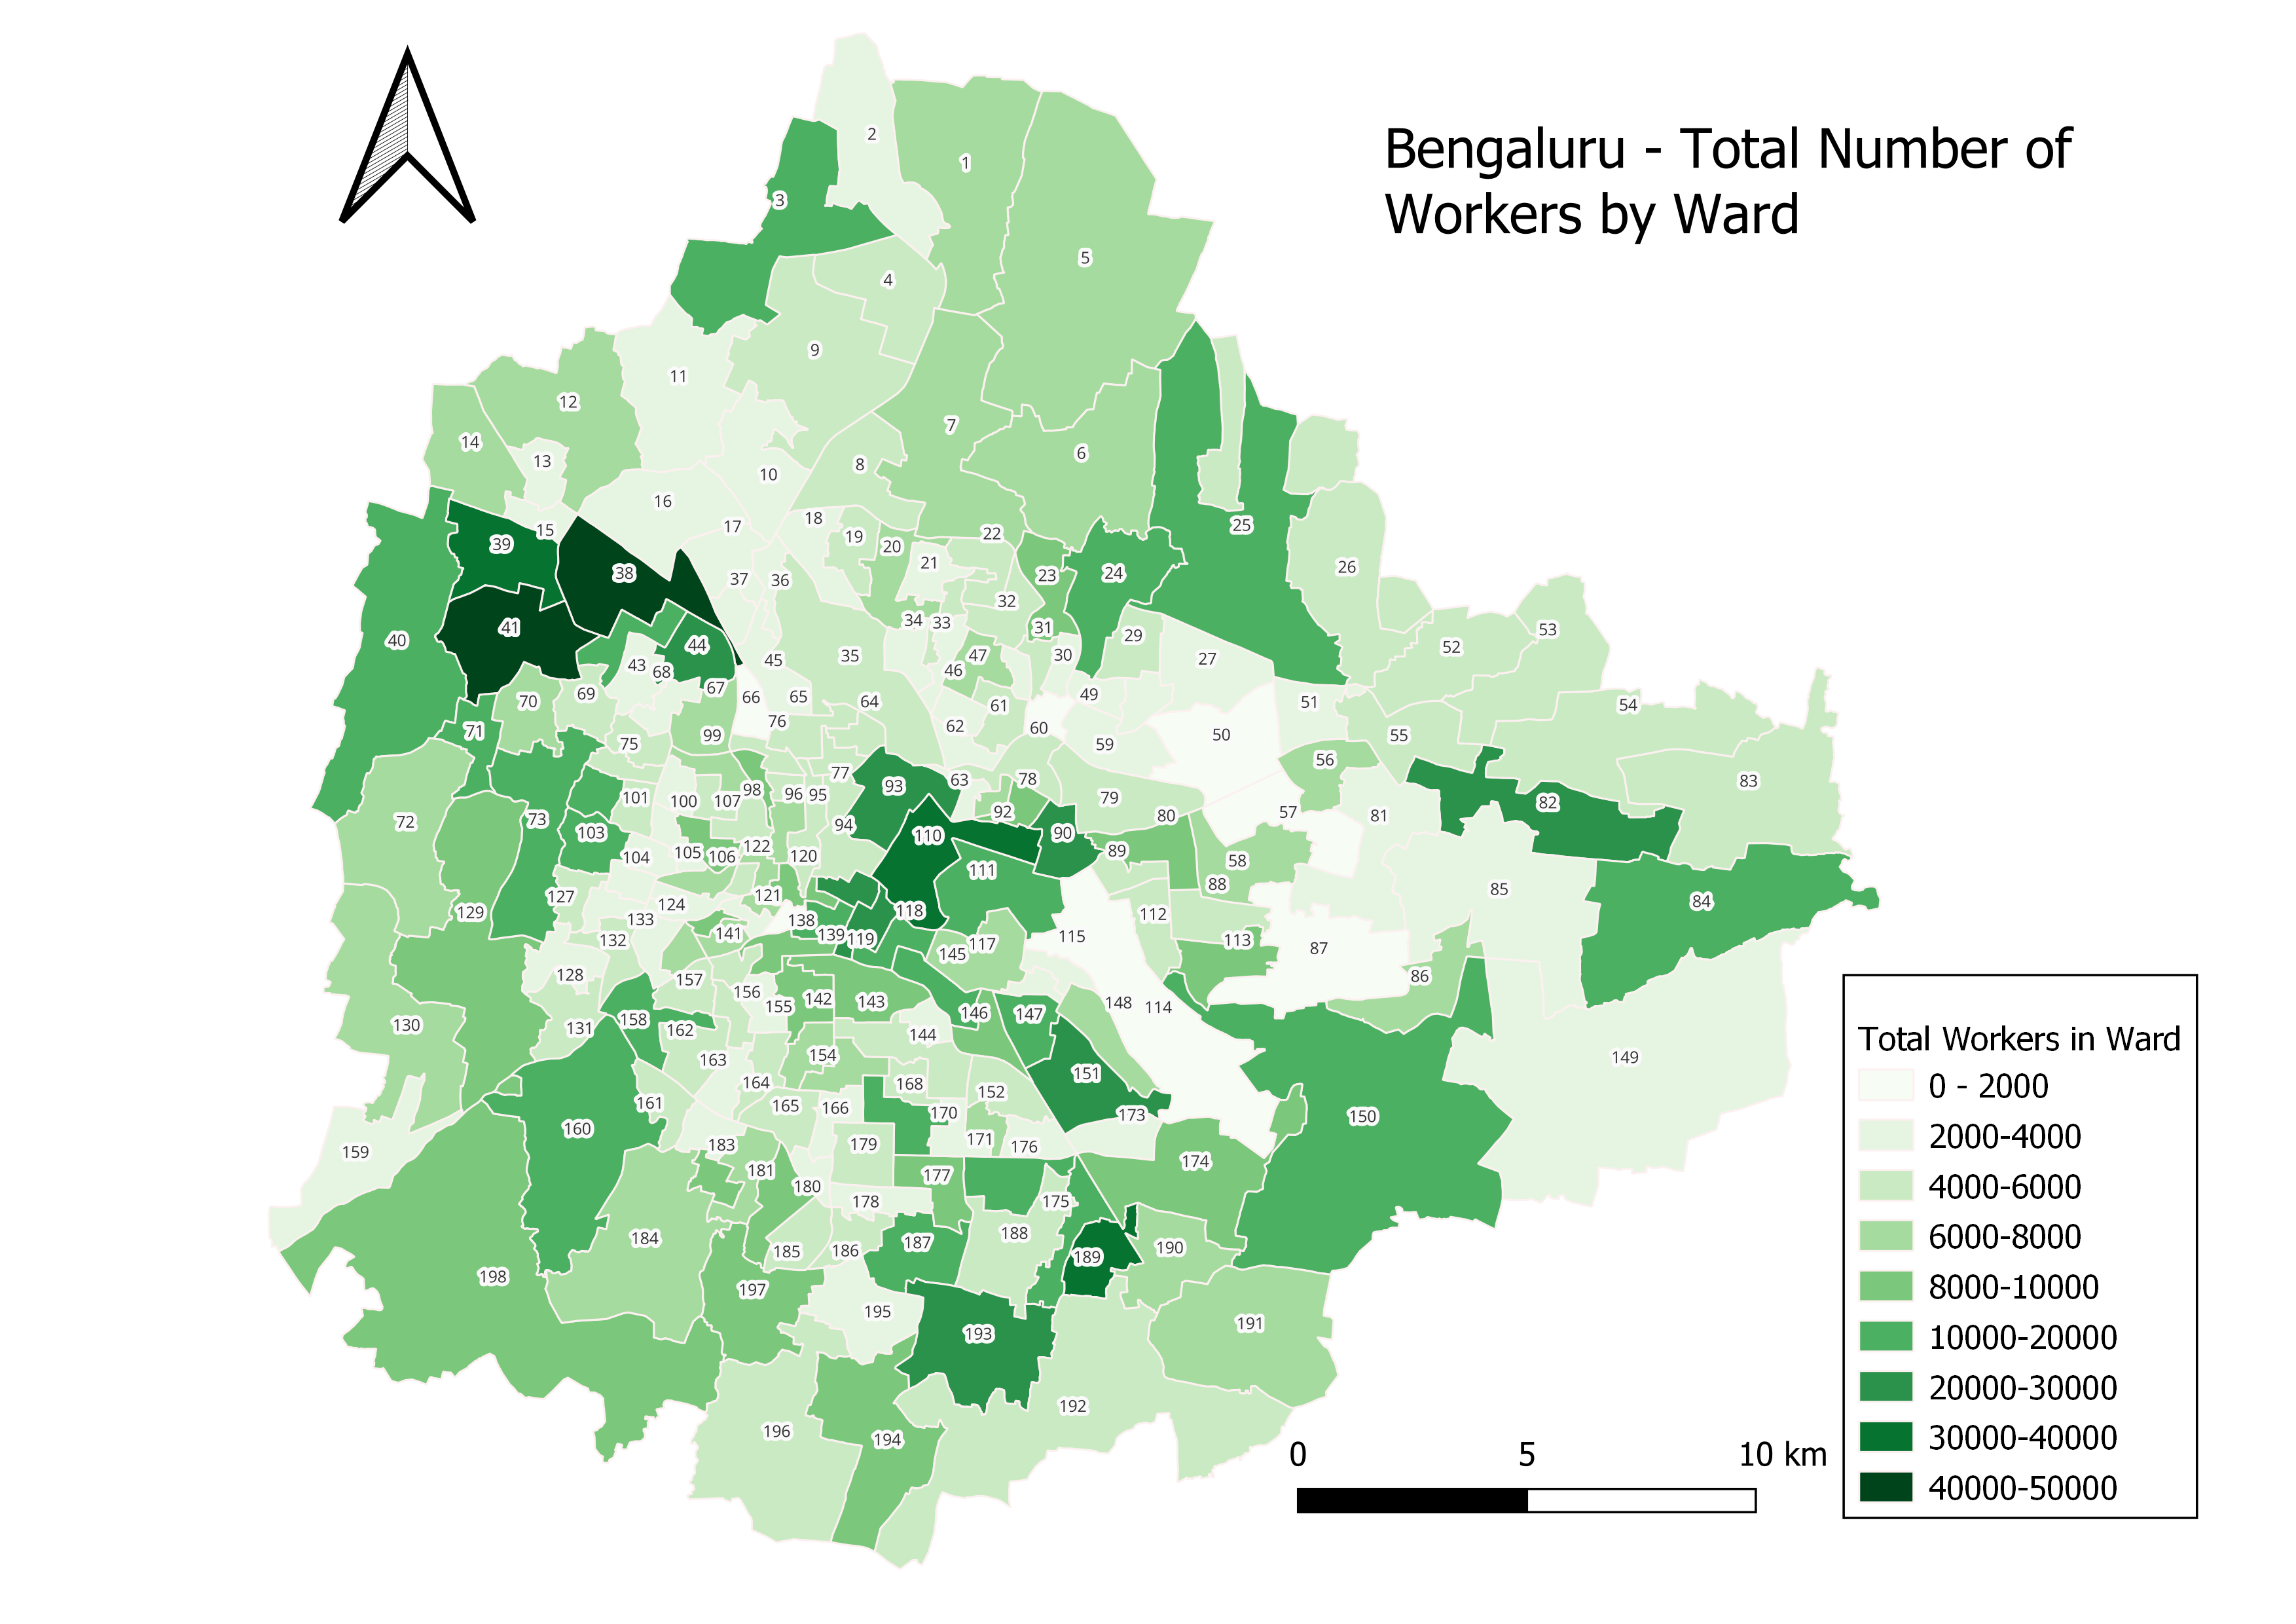
Looking at people employed at ward level shows that areas in the North-west of the city, the Central Business District, South and towards the East have the most number of workers. While the median number of workers per ward is around 5000, wards 38 and 41, HMT and Peenya Industrial Area, have more than 40000 workers each working in establishments there. In fact wards 38, 39 (Chokkasandra) and 41 together account for 9% of the total workforce employed in the city. The other major cluster that can be seen is of wards 189 (Hongasandra) and 193 (Arakere) where 4% of the workforce is employed.

For women workers, the situation is only slightly different. However, what was seen is that in both wards 38 and 189, close to 60% of the women were employed in the apparel manufacture sector. Wards 160 (Rajarajeshwarinagar) and ward 90 (Ulsoor) also show up as important areas with establishments where women are employed.

Civic Amenities in the working areas of Bengaluru
Given that work is concentrated in specific areas in the city, development and amenities need to be planned accordingly. For instance, wards which have a large number of workers would require better public transport connectivity as well as more civic amenities like public toilets.

The situation, however, is different. Wards 38(HMT) which employs the most number of workers has poor access in terms of number of bus stops in the area. The distribution of stops is such that buses go around the ward, with barely a couple of stops inside the area. The same is true of ward 90 (Ulsoor) where a lot of women work.

The situation is even worse when it comes to public toilets. In wards 38, 189 and 193 where on average 35000 workers go to work, there are less than 2 public toilets for the entire ward.
The economic census provides important information on not only what kind of jobs people do in the city, but also which parts of the city house the most businesses and employ the most number of workers. From a civic body’s perspective, this can yield valuable information to better target public services like public toilets, bus connectivity, etc.
From Bengaluru’s perspective, while the sixth economic census gave us an idea of the employment map of the city, it would be very interesting to see what changes the arrival of ride-hailing, e-commerce delivery, food delivery and other delivery apps have wrought on the ecosystem. The seventh economic census should capture these changes effectively.