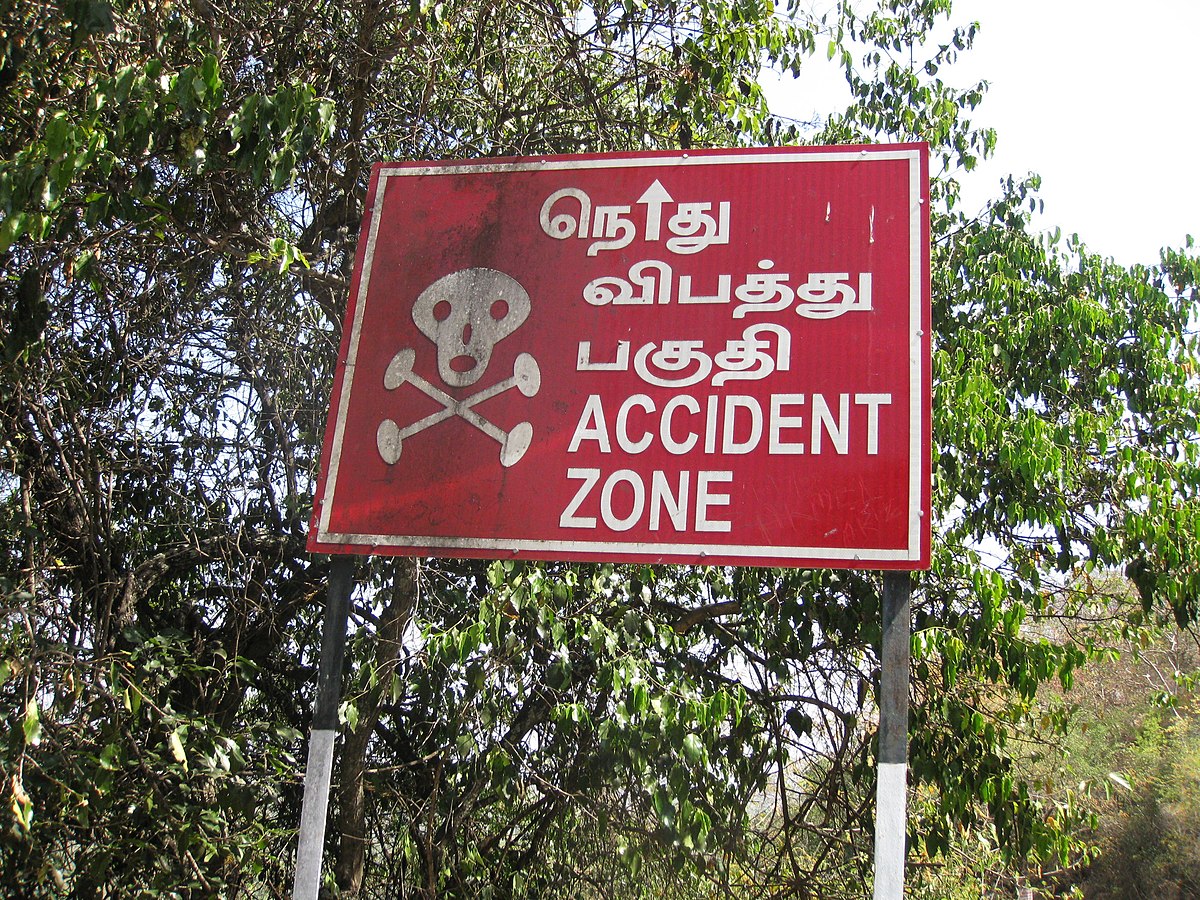
Bengaluru records around 700 deaths each year on average. As per latest data from the Bengaluru Traffic Police (BTP), 771 people were killed on Bengaluru’s roads in traffic accidents in 2022, which is more than 2 persons per day! This is slightly higher than the 768 recorded in 2019. While the Covid years of 2020 and 2021 saw fewer fatalities of around 650, the numbers have bounced right back up demanding that they be addressed.
Where do the most accidents occur?
BTP puts out annual accident and fatalities numbers categorised by traffic police stations. Based on that, the highest number of accidents and fatalities in 2022 happened in Yelahanka traffic police limits. Yelahanka recorded 204 accidents and 56 fatalities in 2022. In general, the northern parts of the city, towards the airport accounted for 633 of the 3283 accidents – close to 20%, and 159 of the 771 fatalities- 20.6%.
On average, over the past 5 years since 2018, Yelahanka traffic police station limits rank the highest in fatalities followed by K.R. Puram traffic limits. North Bengaluru, especially from Hebbal to the Airport has recorded high number of fatalities in this period. Even though the area within these limits is pretty large, one wonders if the busy airport road is a factor here. We need more data to be made open to analyse and understand what are the main causes of traffic accidents in these areas.

The map above suggests that the city’s highways tend to contribute most of the accidents, which is likely given the higher speeds, lack of pedestrian infrastructure and poor driving habits. However, without accurate mapping of accident spots we cannot pinpoint where the hotspots are and can only make an informed guess. FIR data, which specifies where the accidents occurred exactly can help in this regard, but that data is not in the public domain.
WRI (Word Resources Institute) – India recently put out a map showing where the pedestrian fatalities happen in Bengaluru based on FIR data from 2017-20. The data was however not made public by the traffic police.
Need for Open Data
While this is the case with Bengaluru Traffic Police, Mumbai Traffic Police take a more Open approach. Their annual safety reports detail the accidents and fatalities that occurred over the last year, who was involved, who was affected, and more importantly where the accidents occurred at road level.

In the case of Delhi, the Delhi Traffic Police puts out a map of accident prone areas with details about number of accidents and how many of them were fatal. The map is very rudimentary without any roads to guide users and does not inform as much as the Mumbai maps. But it is hoped the presentation improves with time.

It is absolutely essential that traffic police in other cities, including BTP, follow these examples and make details about accident hospots public. This is necessary so that not only can people know where to be careful, but also can hold authorities accountable for fixing the issues at these hotspots. Importantly, making this data public can also help independent experts analyse the issues and recommend remedial measures.

