On the 29th April 2024, Bengaluru recorded extremely 38.5°C which was the second hottest day ever recorded in the city. IMD records showed that between February and June 35°C was exceeded on 45 days, 27 of which were in April. The remaining three days of April recorded more than 34°C, so there really wasn’t a single day of respite in April.
Stations in Delhi recorded more than 50°C on some days in June. While the numbers were disputed, the surroundings were still close to the 50°C mark. Extreme heat in urban areas is a reality we are increasingly having to contend with, and like most natural disasters like flooding or landslides the economically and socially vulnerable sections are forced to live with the effects.
Urban Heat in Bengaluru
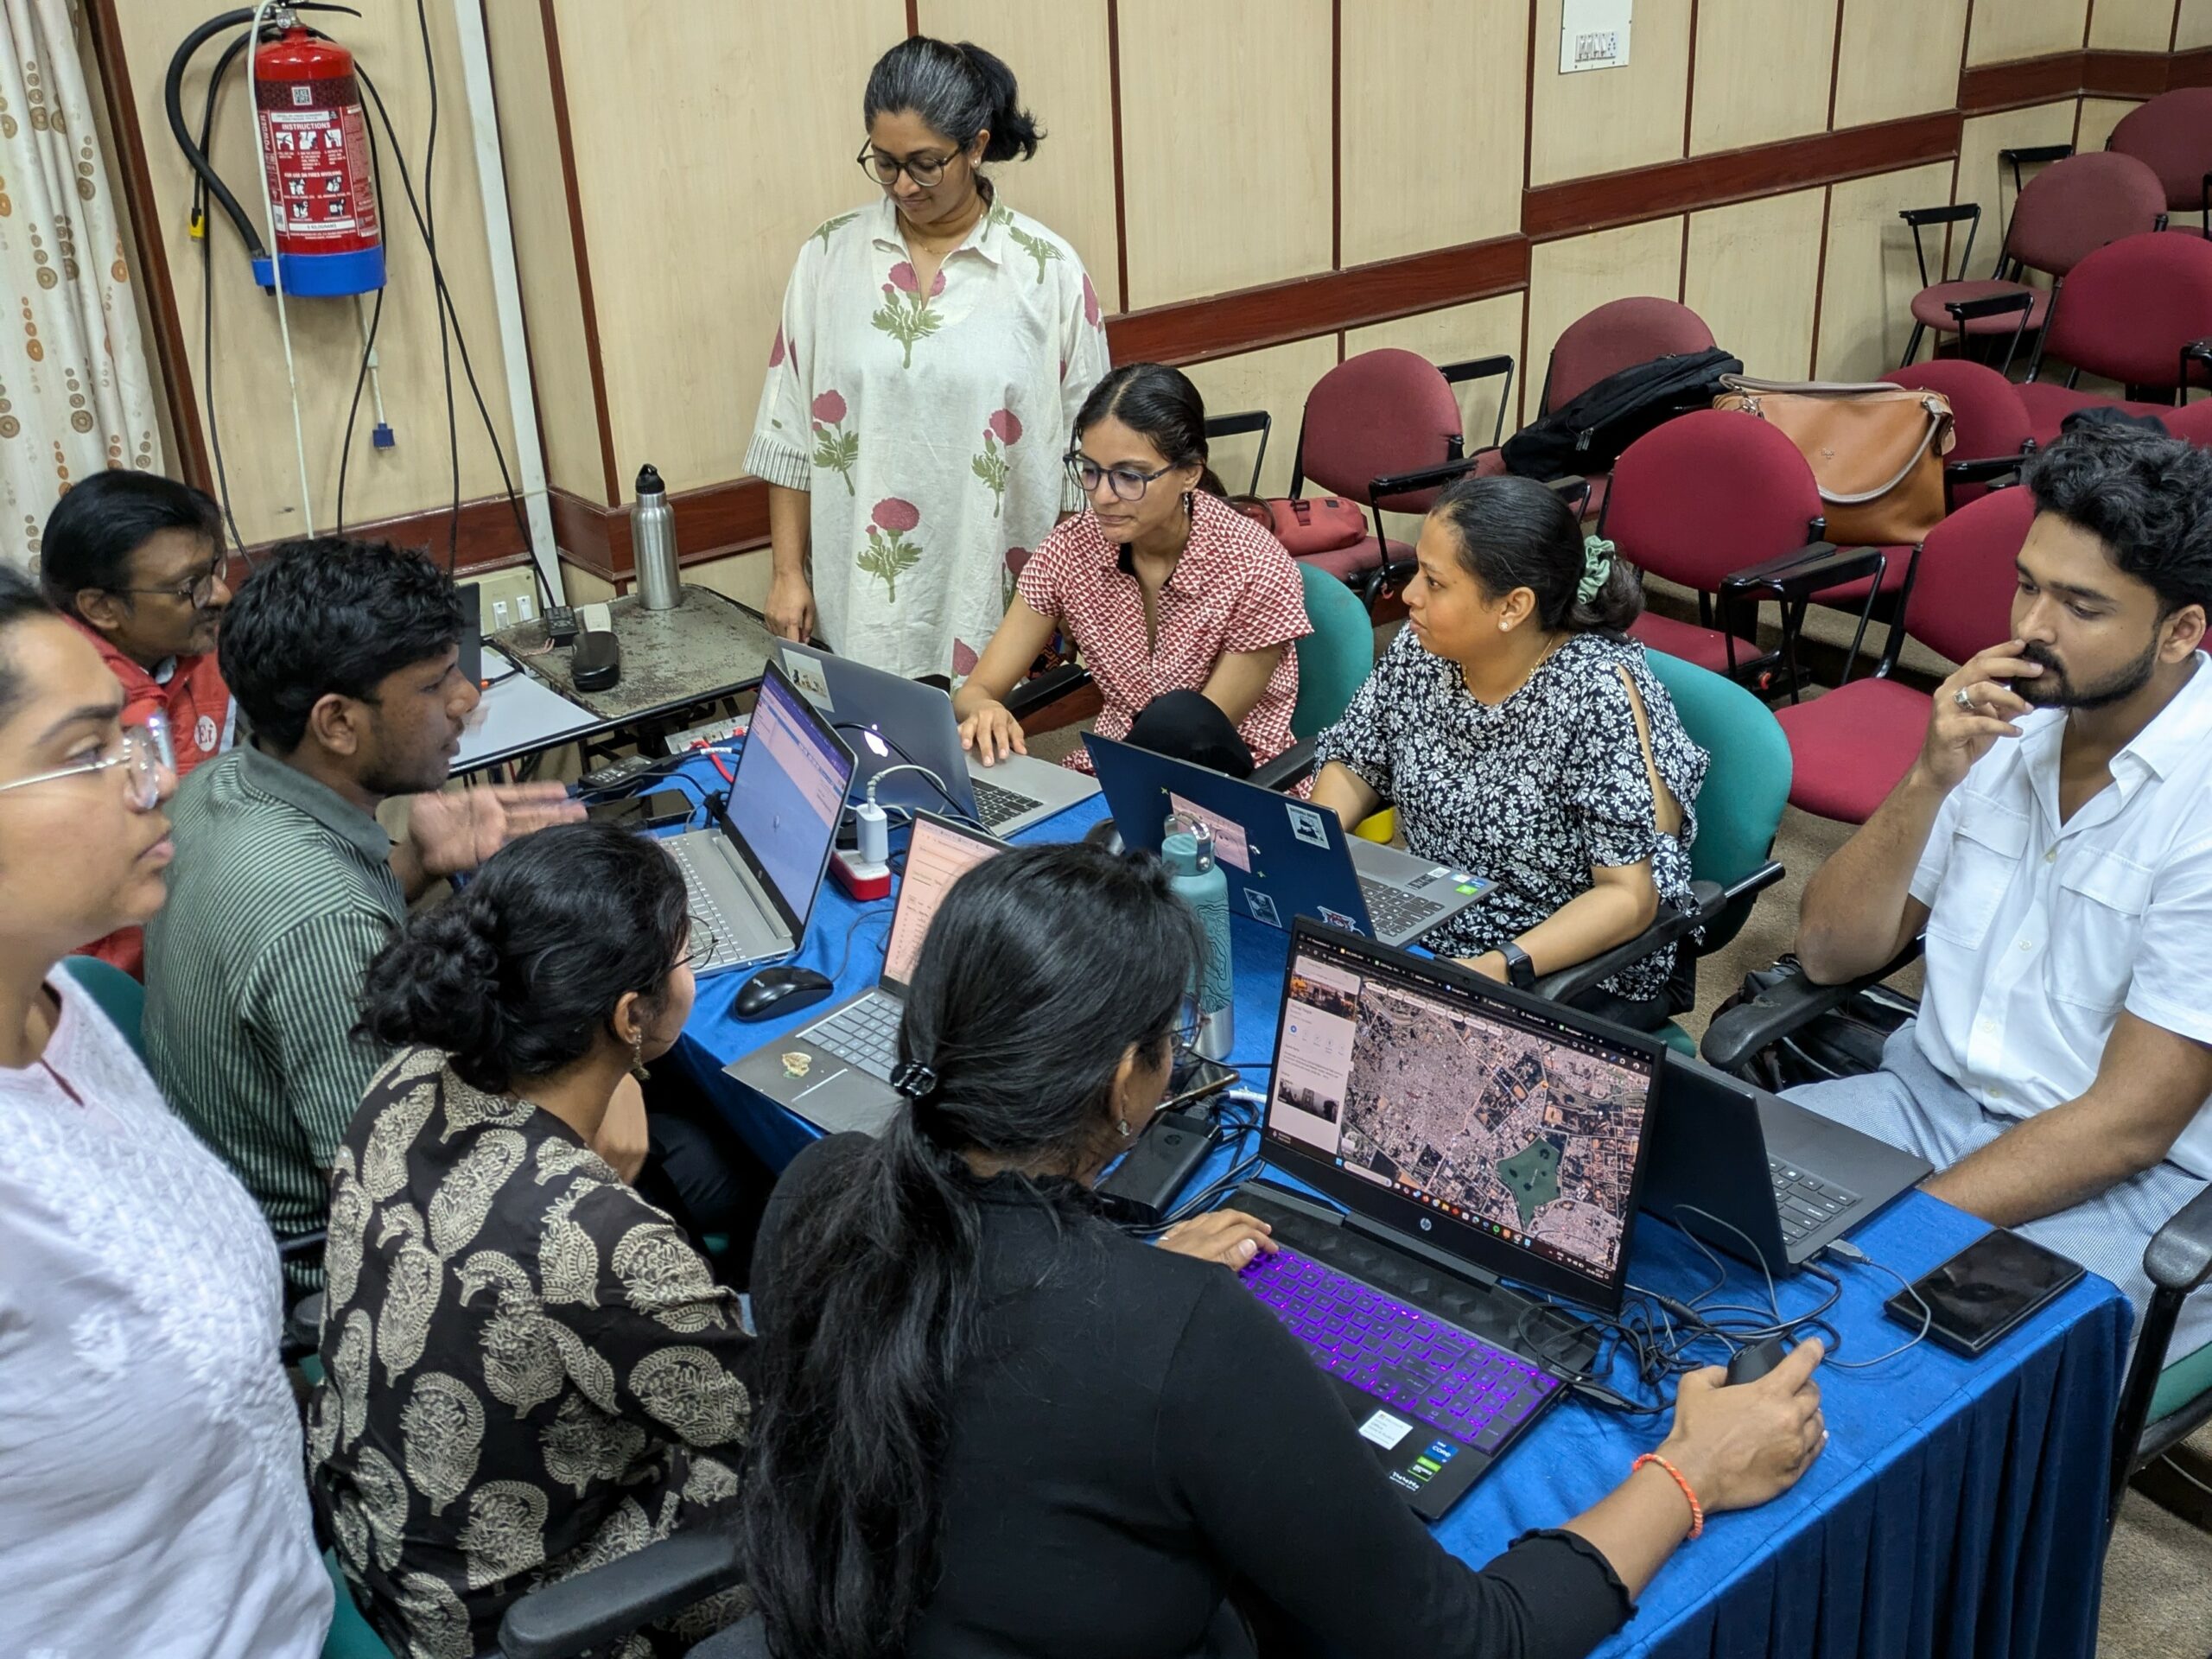
The data jam with the topic – “Addressing Urban Heat in Bengaluru” was held in this context. The BBMP Climate Action Cell, which recently launched the Bengaluru Climate Action Plan, and WRI India were the partners for the event, and the event was supported by the Ashoka Trust for Ecology and the Environment(ATREE). The event was held at the IPP Centre, Malleswaram, Bengaluru – 560003.

In a day-long event, 25 participants with varied backgrounds – from urban planners, GIS experts, software developers to active citizens – looked at satellite data for surface temperature during the hottest months. They correlated this data with ground realities like land-use patterns, presence and absence of green cover, and the economic and social demographics in four wards with different landuse characteristics – Marappana Palya near Yeshwantpur, Shivajinagar, Garudacharpalya and Peenya Industrial Area.

Problem Statements
Unlike in earlier datajams, the participants were given a problem statement and asked to pick a ward and answer those questions for the ward. The main question they were asked to answer was:
What are the causal relationships of local parameters (such as building material, land surface, availability of green etc.) with urban heat (LST, UHI, heat stress etc.)? Develop a thermal risk profile of the ward using Risk = Hazard x Exposure x Vulnerability.
Here, hazard meant the exposure to extreme heat as seen through land-surface data captured by satellites, exposure refers to the at-risk infrastructure and number of people who have to experience this heat, and vulnerability could be physical, economic and social of the people living and working in these areas.


Outputs
Team Resilient Urbanists
Aastha, Abhishek, Amith, Srivatsa, Vaibhav and Vedika of Team Resilient Urabnists analysed the hazards and vulnerable populations for Peenya Industrial Area, Ward no: 41 (as per 198 wards regime).

The team noted that the ward, spread around 4 sq. km has more than 5000 small scale industries and a few medium and large scale industries. The industries deal with the production, maintenance and service in multiple sectors like mechanical, electrical, automobile, garments and pharmaceutical.
They found that Peenya Industrial Area recorded much higher temperatures compared to other wards in the area of similar size like HMT, Jalahalli, Kottigepalya and Vasanthnagar.

Looking at the Census 2011 Household data, they noted that 35% of the population does not have access to concrete roofing, and in fact, 28% of the households were living in houses with G.I Metal and asbestos roofing where the impacts of heating are felt the highest.
Team RCB
Team RCB comprising Chinmayi, Clinson, Kripa, Namitha, Raghu, Sabarinath and Vedika analyzed the hazards and vulnerabilities in Shivajinagar ward.

They noted that Shivaji nagar has always been densely populated with a lot of commercial properties to the South and residential and mixed use properties in the North. Located in the South of the ward is the Shivaji Nagar bus terminus, an important hub with over 200 buses transiting every hour.
Using satellite land surface temperature data they found that the southern parts of the ward experienced temperatures of more than 50°C during peak summer. They mapped the land-use patterns and found that commercial areas including Russell Market experienced this heat the most.

They also noted that the Shivaji nagar Nala(Drainage Canal) flows through this area and could be contributing to the heat instead of helping to cool it down. Drying up of the Nala during summers and emissions from the garbage, sewage and other effluents there could be the reasons for that, they conjectured.
They recognised an urgent need for increasing shade in the areas including through rest zones and shaded walkways to protect residents as well as vendors, gig workers and commuters.
Team Garuda
Druid, Khushbu, Lasya, Rashmi, Sharad and Veeresh of Team Garuda analysed the hazards and vulnerabilities of heat in Garudacharpalya ward.

They noted that the ward is made up of what used to be villages like Garudacharpalya, Hoodi, Nallur halli and Seetharam palya. Most of the development in recent times have happened with IT SEZs as the focal point, leading to a higher density of spaces around these SEZs. This makes this ward one of the areas driven primarily by the IT boom of the past few decades.
Using land-surface temperature data from satellites they found that the temperature in the ward varied between 37°C and 27°C on the same day in peak summer. However, the lower temperature was seen in only a few areas where there was green cover.
The area also suffered from a lack of public transport forcing people to walk more than a kilometre on average to access their nearest bus stops. Coupled with the lack of green cover along the roads, this meant that people would be exposed to extreme heat when walking long distances to bus stops.

They recommended that green cover be developed along roads and bus stops, and that parks be developed in the ward as there were none in the ward. Public transport also needs to be improved to address the needs in the inner roads of the ward.
Team Sandal Soap Factory
Aman, Athira, Divya, Keerthi, Kiran, Mitavachan and Vivek of Team Sandal Soap Factory analysed the heat hazard and vulnerability for Marappana Palya ward which covers areas under Yeshwantpur.

They noted that the ward has industrial areas towards the North of the ward, and residential layouts towards the South, specifically the Southwest. There are also multiple ongoing residential and commercial projects along the National Highway to Tumkur.
They found that higher surface temperatures corresponded to industrial and commercial use, and the green cover also showed the same correlation with more green cover in residential areas and being completely absent in industrial areas. Interestingly, they also found a higher correlation of metal/asbestos roof material in the areas with more heat rendering the people living and working there most vulnerable to high temperatures in summer.

Online Session
An online session was conducted where the participants presented their outputs to the Chairperson of the BBMP Climate Action Cell in a summary form. The session was streamed live on YouTube and you can watch the streaming below.
Conclusions
One of the main findings across all teams was that even within smaller areas like wards there was considerable variation in land surface temperature. This variation also correlated with multiple factors like green cover, where a larger presence indicated cooler temperatures, land-use where industrial and commercial usage tended to have higher temperatures, and roof material – areas with concrete roofing had lower temperature.
The vulnerability factors were also seen to be stacked together – areas with lower income households and denser living conditions were seen to have less green cover and roof materials that exacerbated heat. Industrial and commercial areas where people had to work during the day also showed similar conditions like lack of green cover and non-concrete roofing materials. These areas were also seen to have narrower roads and poorer access to public transport.
All the teams agreed that there was a need for vast improvement in working and living conditions starting from more greening or shade, access to better roofing material, and access to public transport at shorter distances so that people wouldn’t have to walk long distances on hot days.
According to Ms. Preeti Gehlot, IAS, Special Commissioner of the FECC wing, BBMP, and Chairperson of the Bengaluru Climate Action Cell, “it was interesting that the teams looked at vulnerability of sections of the population, which is something that we have had on our minds. The outputs were really good and informative, and we need to scale them up to other wards as well. Initiatives like the Datajam are important to support the city planners as well as governments because they work as supporting systems to help the governing bodies take better decisions. Hoping for more such events for other areas and topics in the City.”
According to Bhanu S, Engagement Editor, Oorvani Foundation “Datajams are a way for subject matter experts and concerned citizens with a background in fields like urban planning, GIS, etc to brainstorm solutions for our cities. The heat datajam has given us the opportunity to partner with the BBMP. Bringing citizens and the government to the same table gives us the opportunity to come up with concrete solutions for urban heat in Bengaluru.”
Shrimoyee Bhattacharya, Program Head- Urban Development, Sustainable Cities and Transport, WRI India added that “the evidence put forward by the Bengaluru Climate Action and Resilience plan (BCAP) indicates that several areas towards the periphery of the city have higher Land Surface Temperature (LST) than the central areas. Such variations can occur due to many reasons, including landuse, land cover, built material, type of activity among others. Formulation of localised actions for building the city’s resilience to urban heat will require deeper and granular understanding of such causal relationships and this is presently lacking. The topic dealt in this Datajam where WRI India collaborated as a knowledge partner is an extension of the work done in BCAP. Innovative approaches with data analytics can help bring-forth new evidence at a hyper-local level to aid targeted action by different stakeholders, including better understanding of urban heat as a hazard.”
Manan Bhan, Ashoka Trust for Research, Ecology and Environment, who facilitated the data jam by guiding the participants, noted that “this is the first time we are involved in a Data Jam. It really showed us the value in getting citizens together and harnessing their enthusiasm and expertise to solve data problems relevant to all of us. Through this process, participants were able to understand that heat is a major climate problem facing all of us, leaving many of our fellow citizens increasingly vulnerable to its effects.”
For Mitavachan H, SusPoT – Center for Sustainability, one of the participants, it was the first time participating in a data jam. He said, “I really liked the core philosophy of OpenCity.in and its initiatives with Data Jams, where various actors in the society come together and try to solve common challenges of our times using their expertise. Moreover, the key characteristic of this initiative is that it is based on open-source data and knowledge transfer. I sincerely appreciate this initiative and wish all the best for the future DataJams.”
