The Bruhat Bengaluru Mahangara Palike (BBMP) launched the Bengaluru Climate Action and Resilience Plan (BCAP) in November 2023. A Climate Action Cell (CAC) was also created under the Forestry and Environment Department to oversee the implementation of the BCAP.
The BCAP aims to make Bengaluru a climate-resilient city in this era of rapid warming and frequent weather-related disasters. It is a futuristic document laying out clear goals to be accomplished and Key Performance Indicators (KPIs) to measure the outcomes.
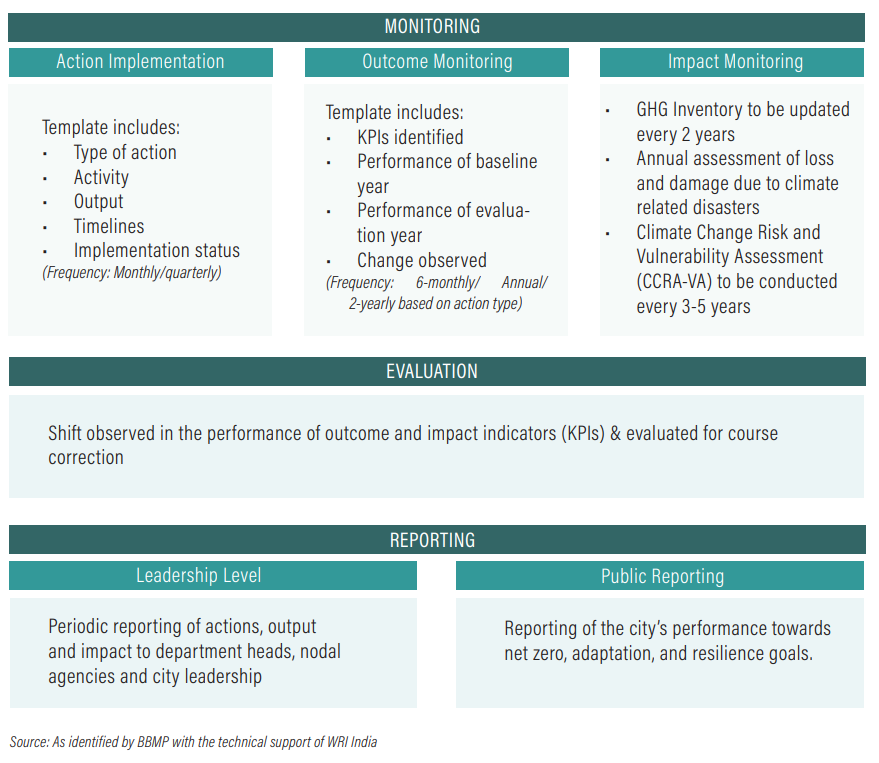
One of the key workstreams that CAC has taken up is Monitoring, Evaluation and Reporting (MER) of BCAP for effective implementation and to track the progress of BCAP goals and targets.
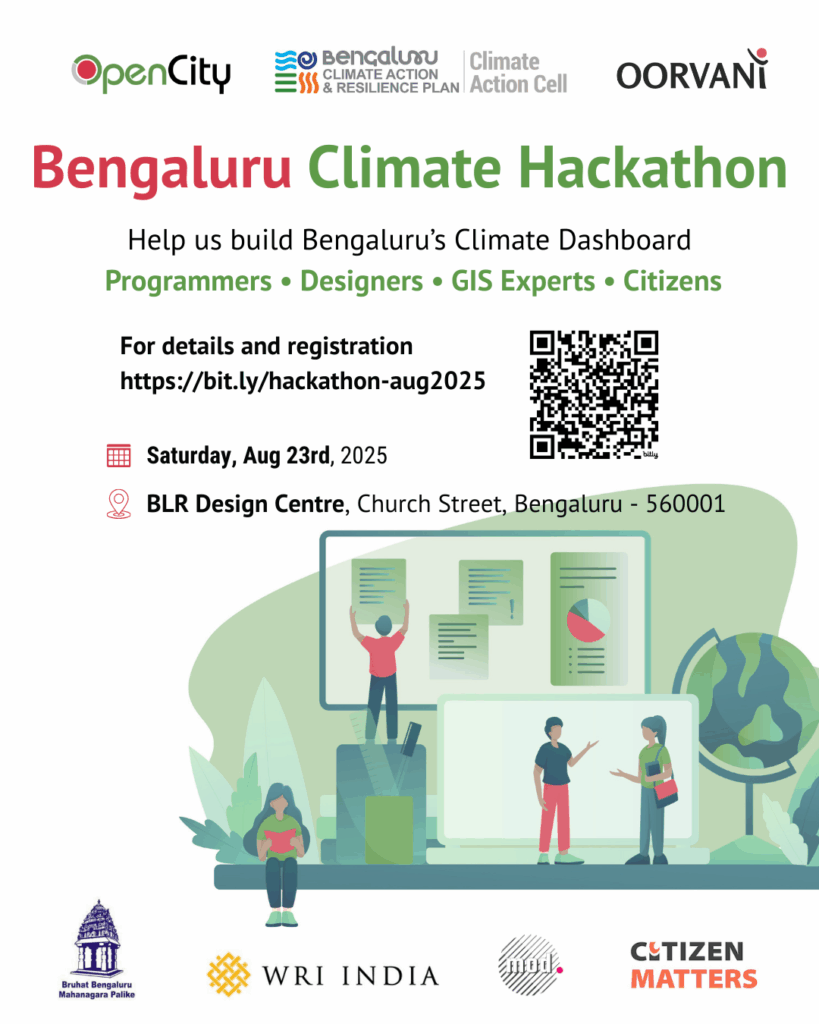
The Bengaluru Climate Hackathon, aimed to involve the citizen community in this process to develop a dashboard that can monitor the outcomes from the BCAP. The dashboard was intended to be developed by the community, for the community and the implementation authorities to measure how the city is progressing on its climate goals.
Bengaluru Climate Hackathon
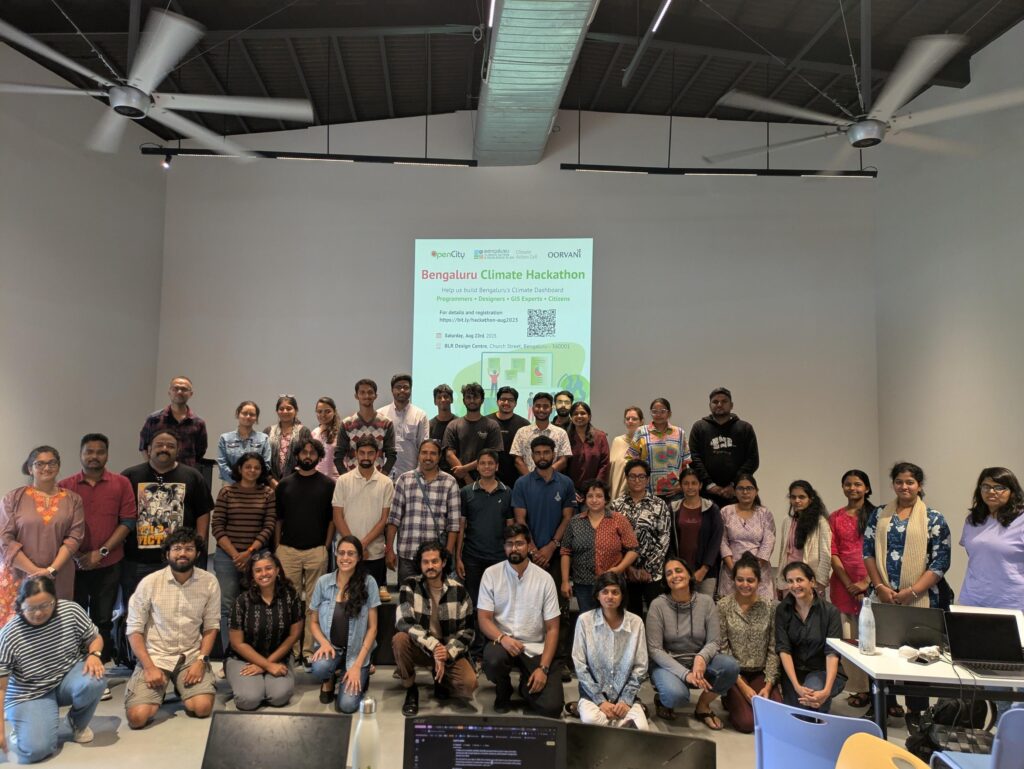
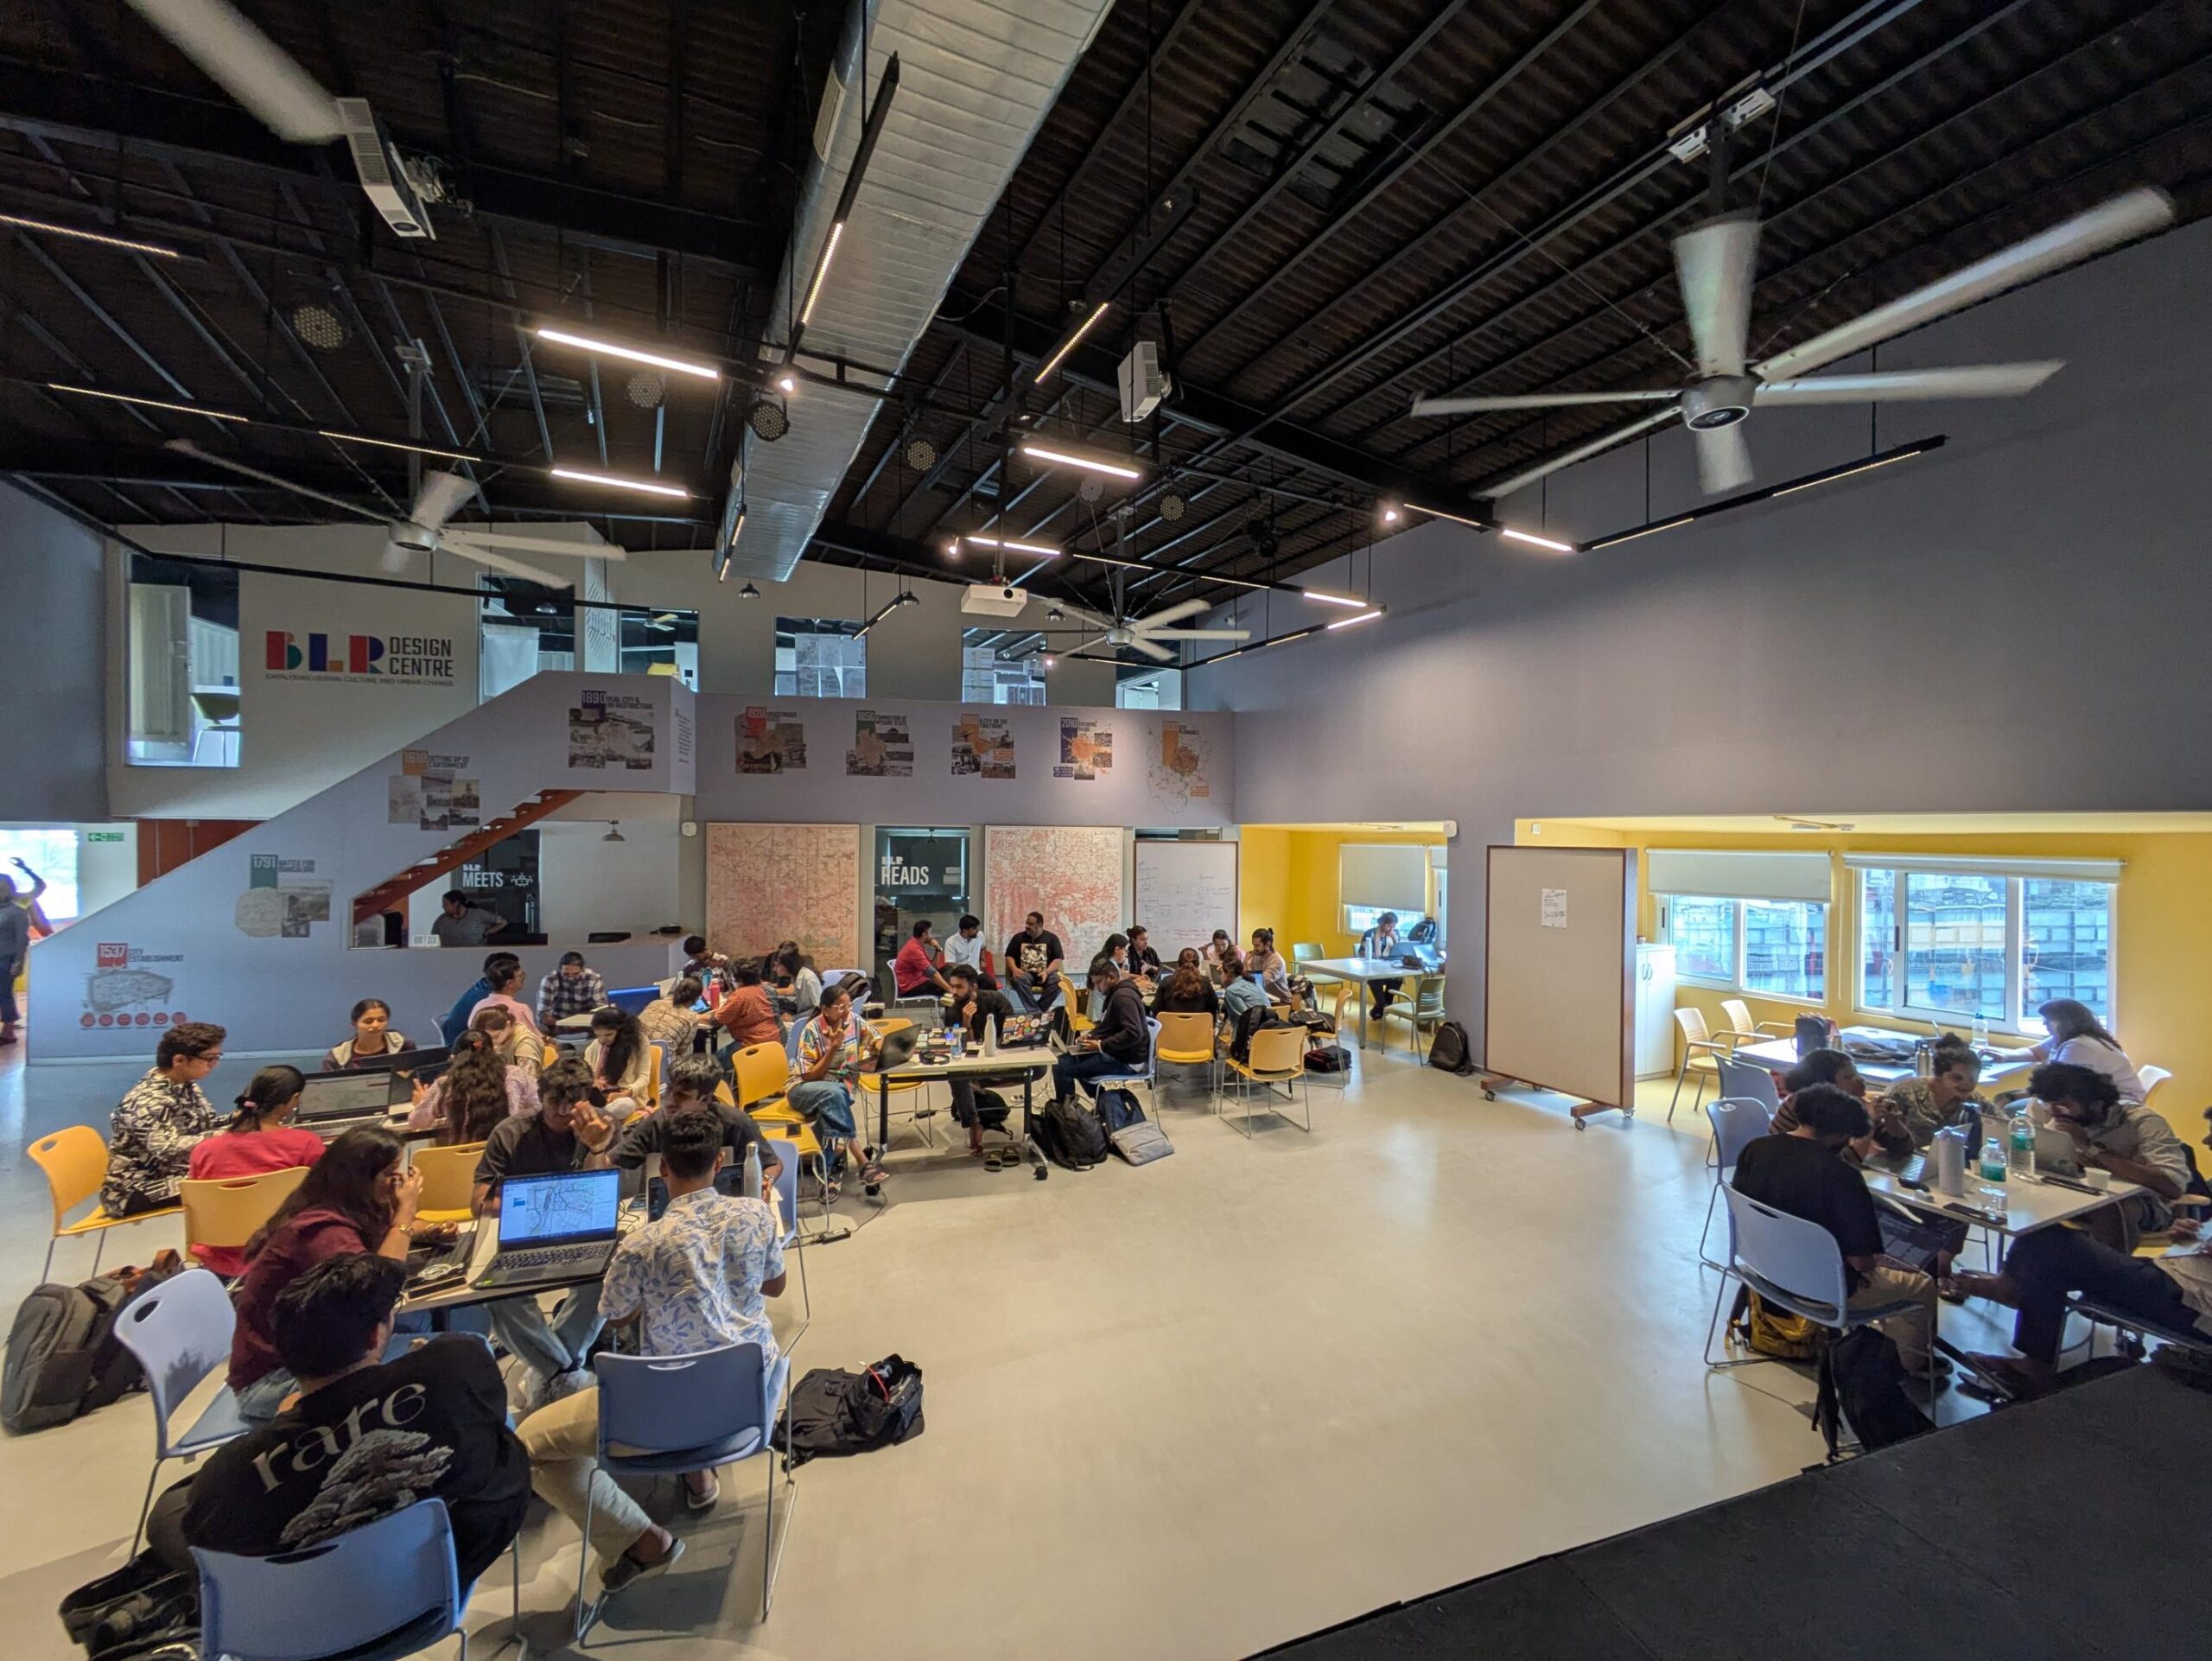
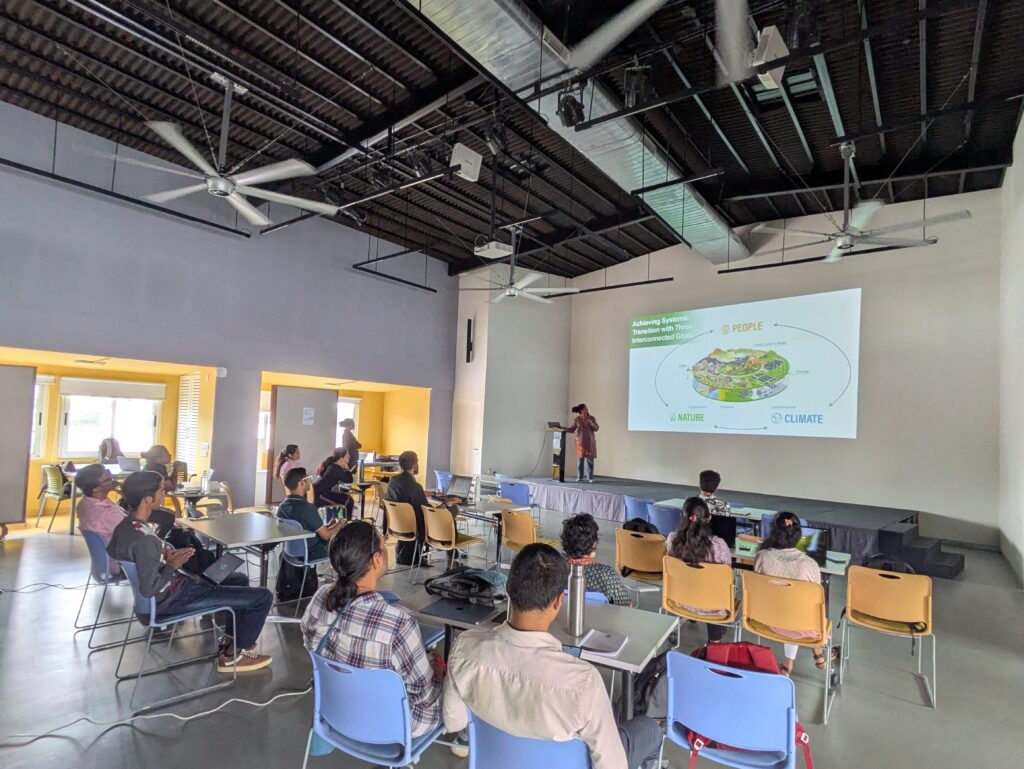
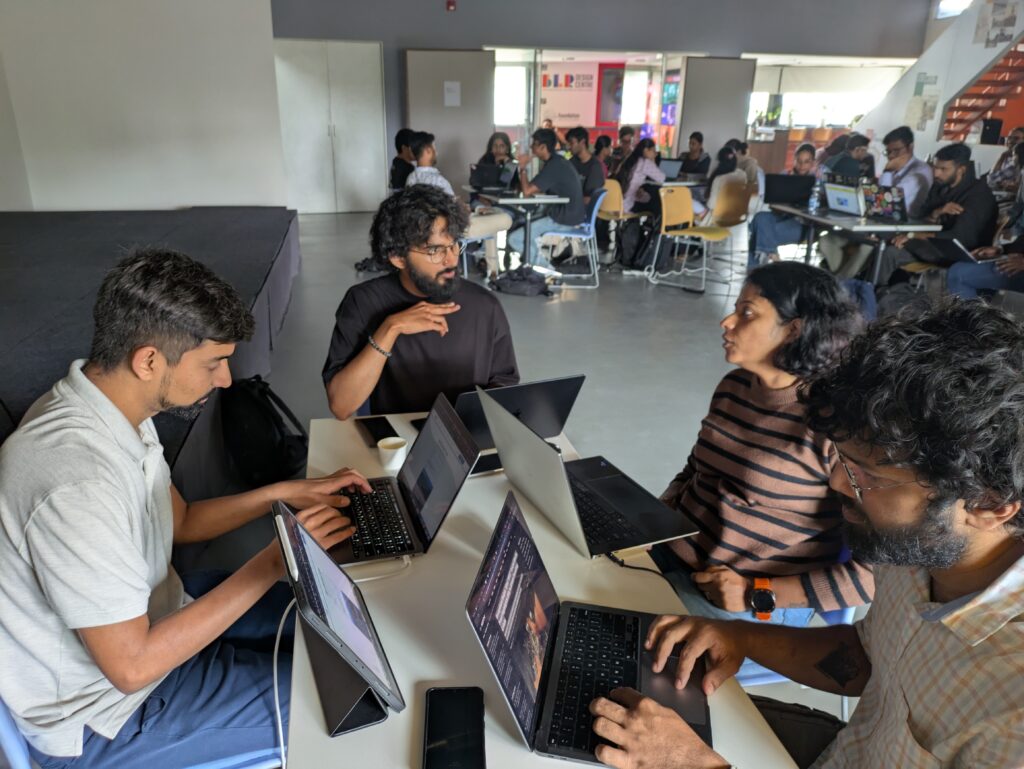
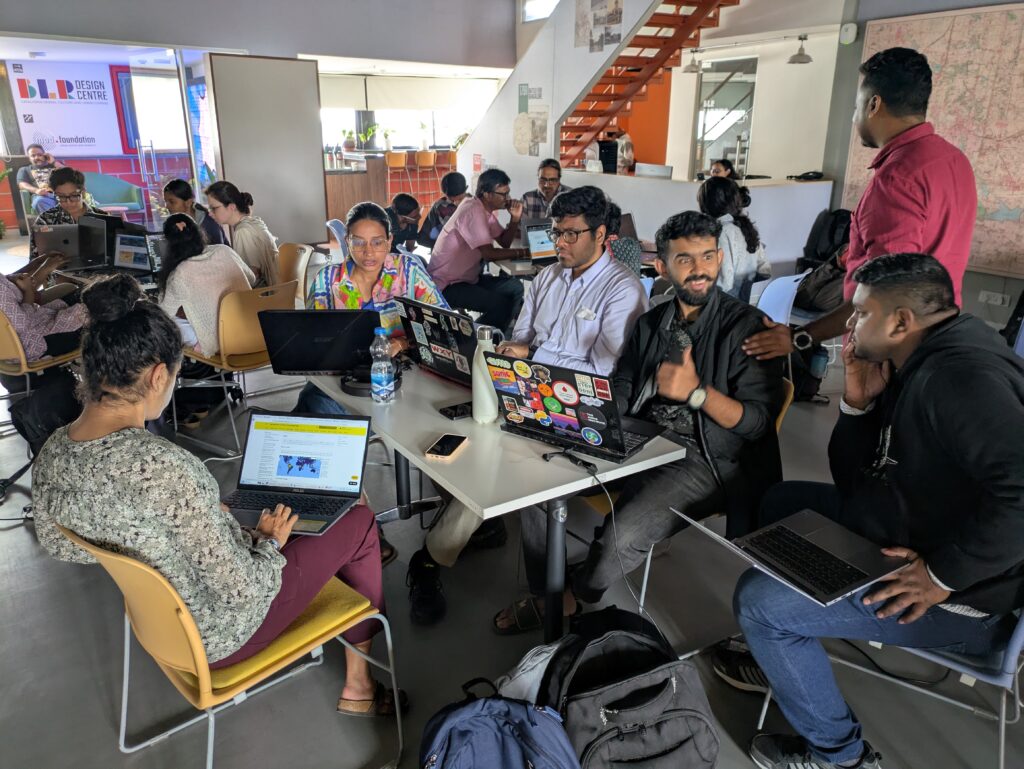
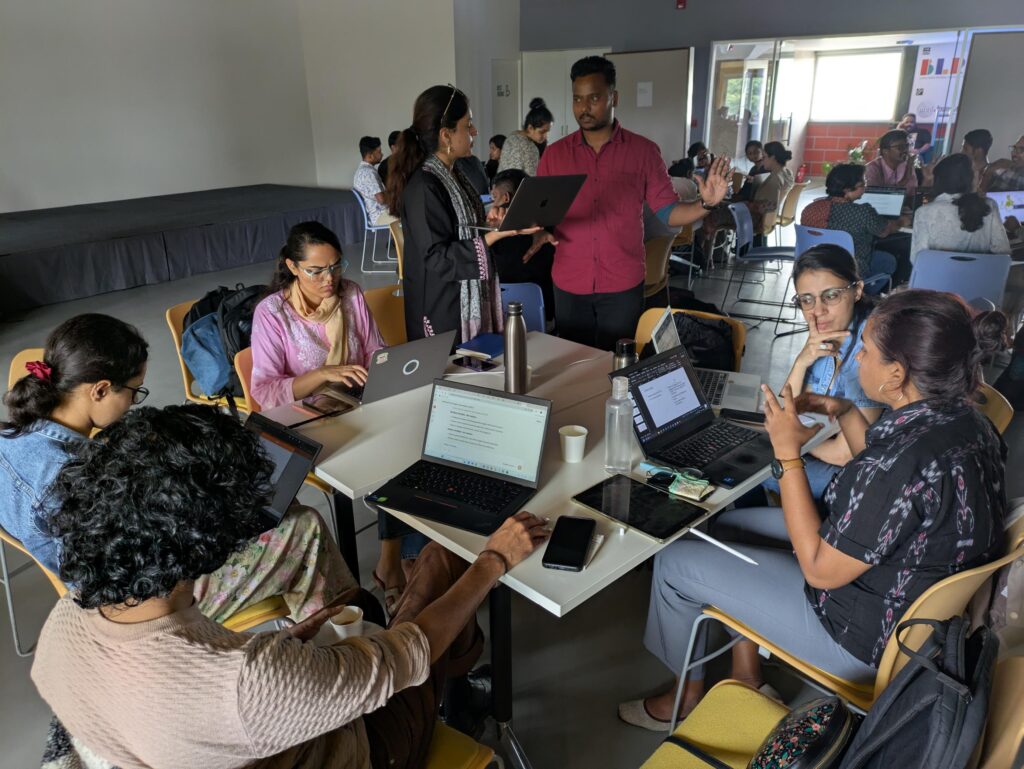
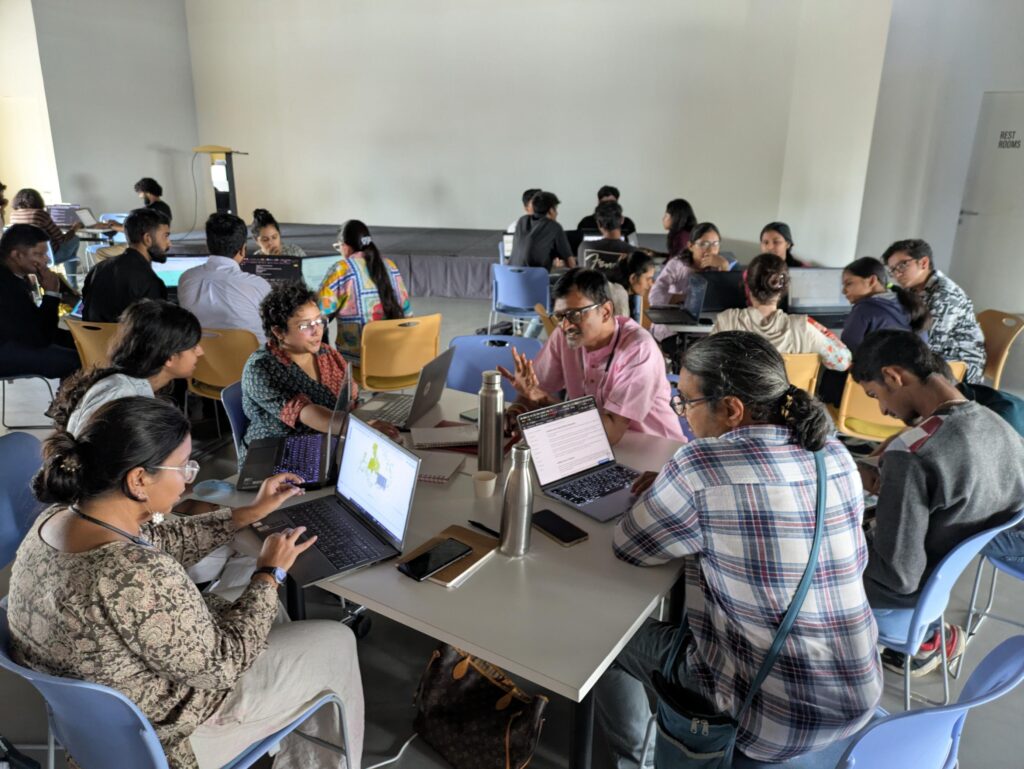
The hackathon was conducted in partnership with the BBMP Climate Action Cell, WRI India and MOD Foundation at the BLR Design Centre on Church Street.
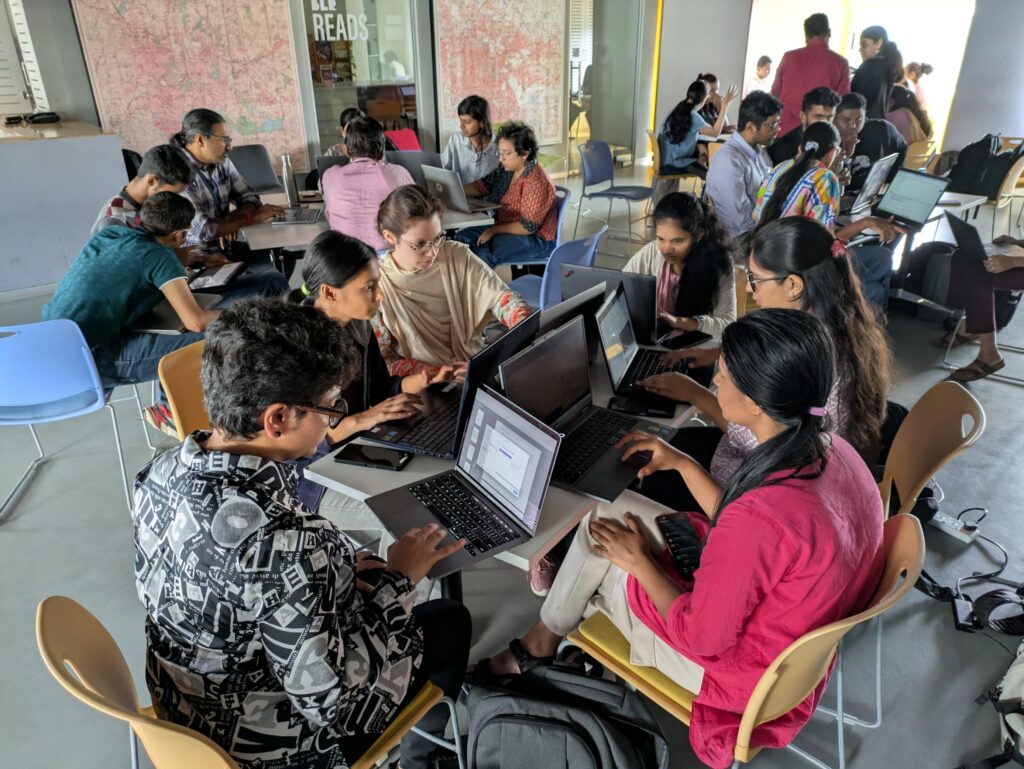
Thirty-three participants from diverse backgrounds – urban planners, GIS experts, programmers, data visualisation experts, students and active citizens – came together to look at different aspects of the city’s climate.
The dashboards they sought to create were:
- Public transport usage and uptake in the city over the years
- Uptake of Electric Vehicles (EVs) – historic and current
- Tracking flooding events across the city
- Air quality metrics from the monitors around the city
- Data centers and their effect on the city’s environment and water
- Tree canopy cover changes over time
During the event, the participants were expected to provide a proof of concept (POC) of their dashboards, given the limited time. Further work over the next weeks would solidify the work into a working dashboard for Bengaluru.
Dashboards
Public transport usage
Advik, Akshath, Jaidev, Joselyn and Sanjan tried to develop a dashboard that tracks bus and metro usage numbers over time.
Their dashboard also tries to track how access to public transport varies across the wards in the city, both by distance from bus stops and distance to metro stations.
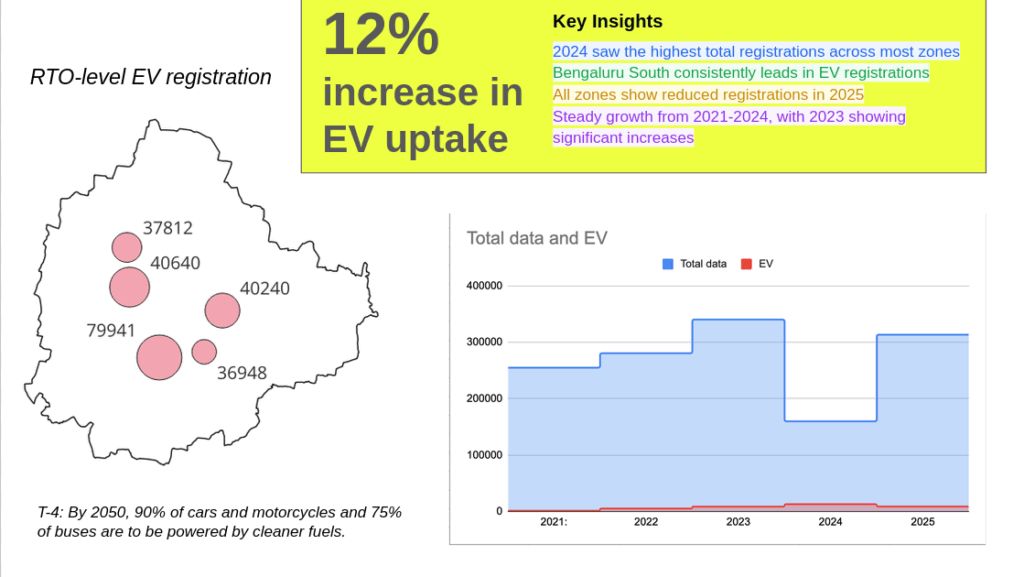
EV Uptake
One of the key indicators for Bengaluru is to increase the percentage of electric vehicles in the active fleet of the city over the years. Lakshmi, Mahek, Reem, Shruthi, Siddharth and Vibhuthi tried to develop a dashboard to track this uptake across the 10 RTOs in Bengaluru over time.
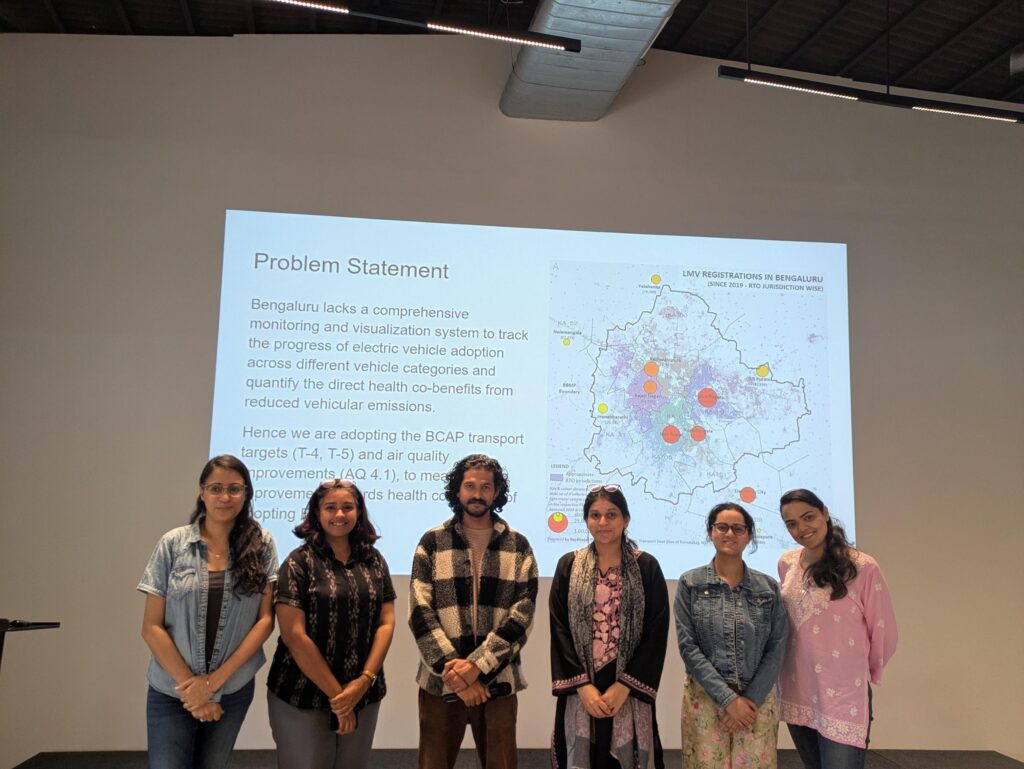
They used the Vaahan dashboard from the Ministry of Road Transport and Highway to track this data over the years. They noted that there are multiple components for EV uptake – for public transport, for intermediate public transport like autos and cabs and private vehicles.
Tracking flooding events
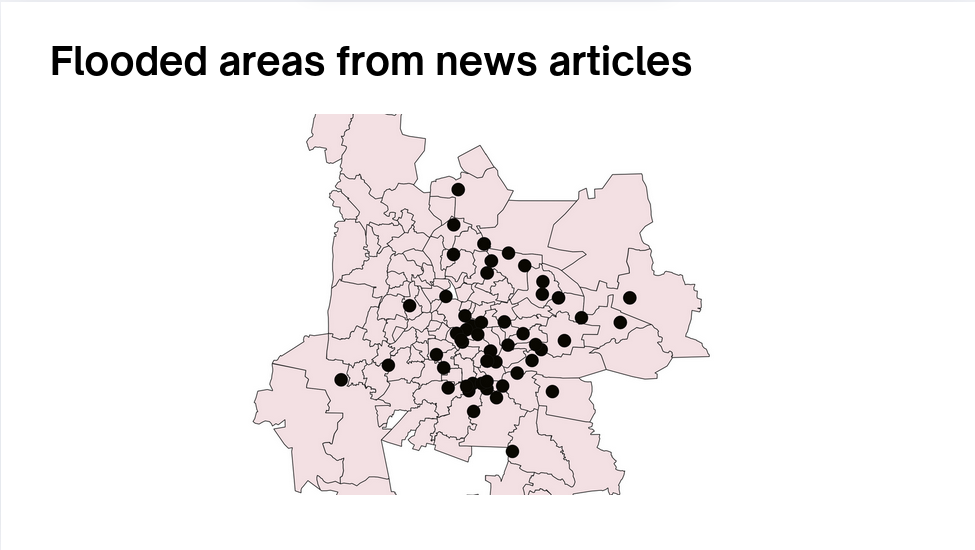
Flood resilience is an important KPI for the city and is a challenging parameter to track. Aagam, Abhishek, Anil and Rashmi tried to map the city’s flood resilience by tracking where flooding events are occurring over time.
For this, they traced news reports and BBMP grievances data to identify the areas which are flooding and their frequency of flooding. Correlating this data with distance to the nearest storm water drain could give observers a clearer picture of the flooding as well as how to fix it.
Air Quality Metrics
Bengaluru has nine air quality monitors installed across the city. Mahima, Malkan, Manisha, Rajitha, Shivani and Shwetha tried to build a dashboard that reads data from the KSPCB’s air quality reports and presents it to users in a user-friendly map.
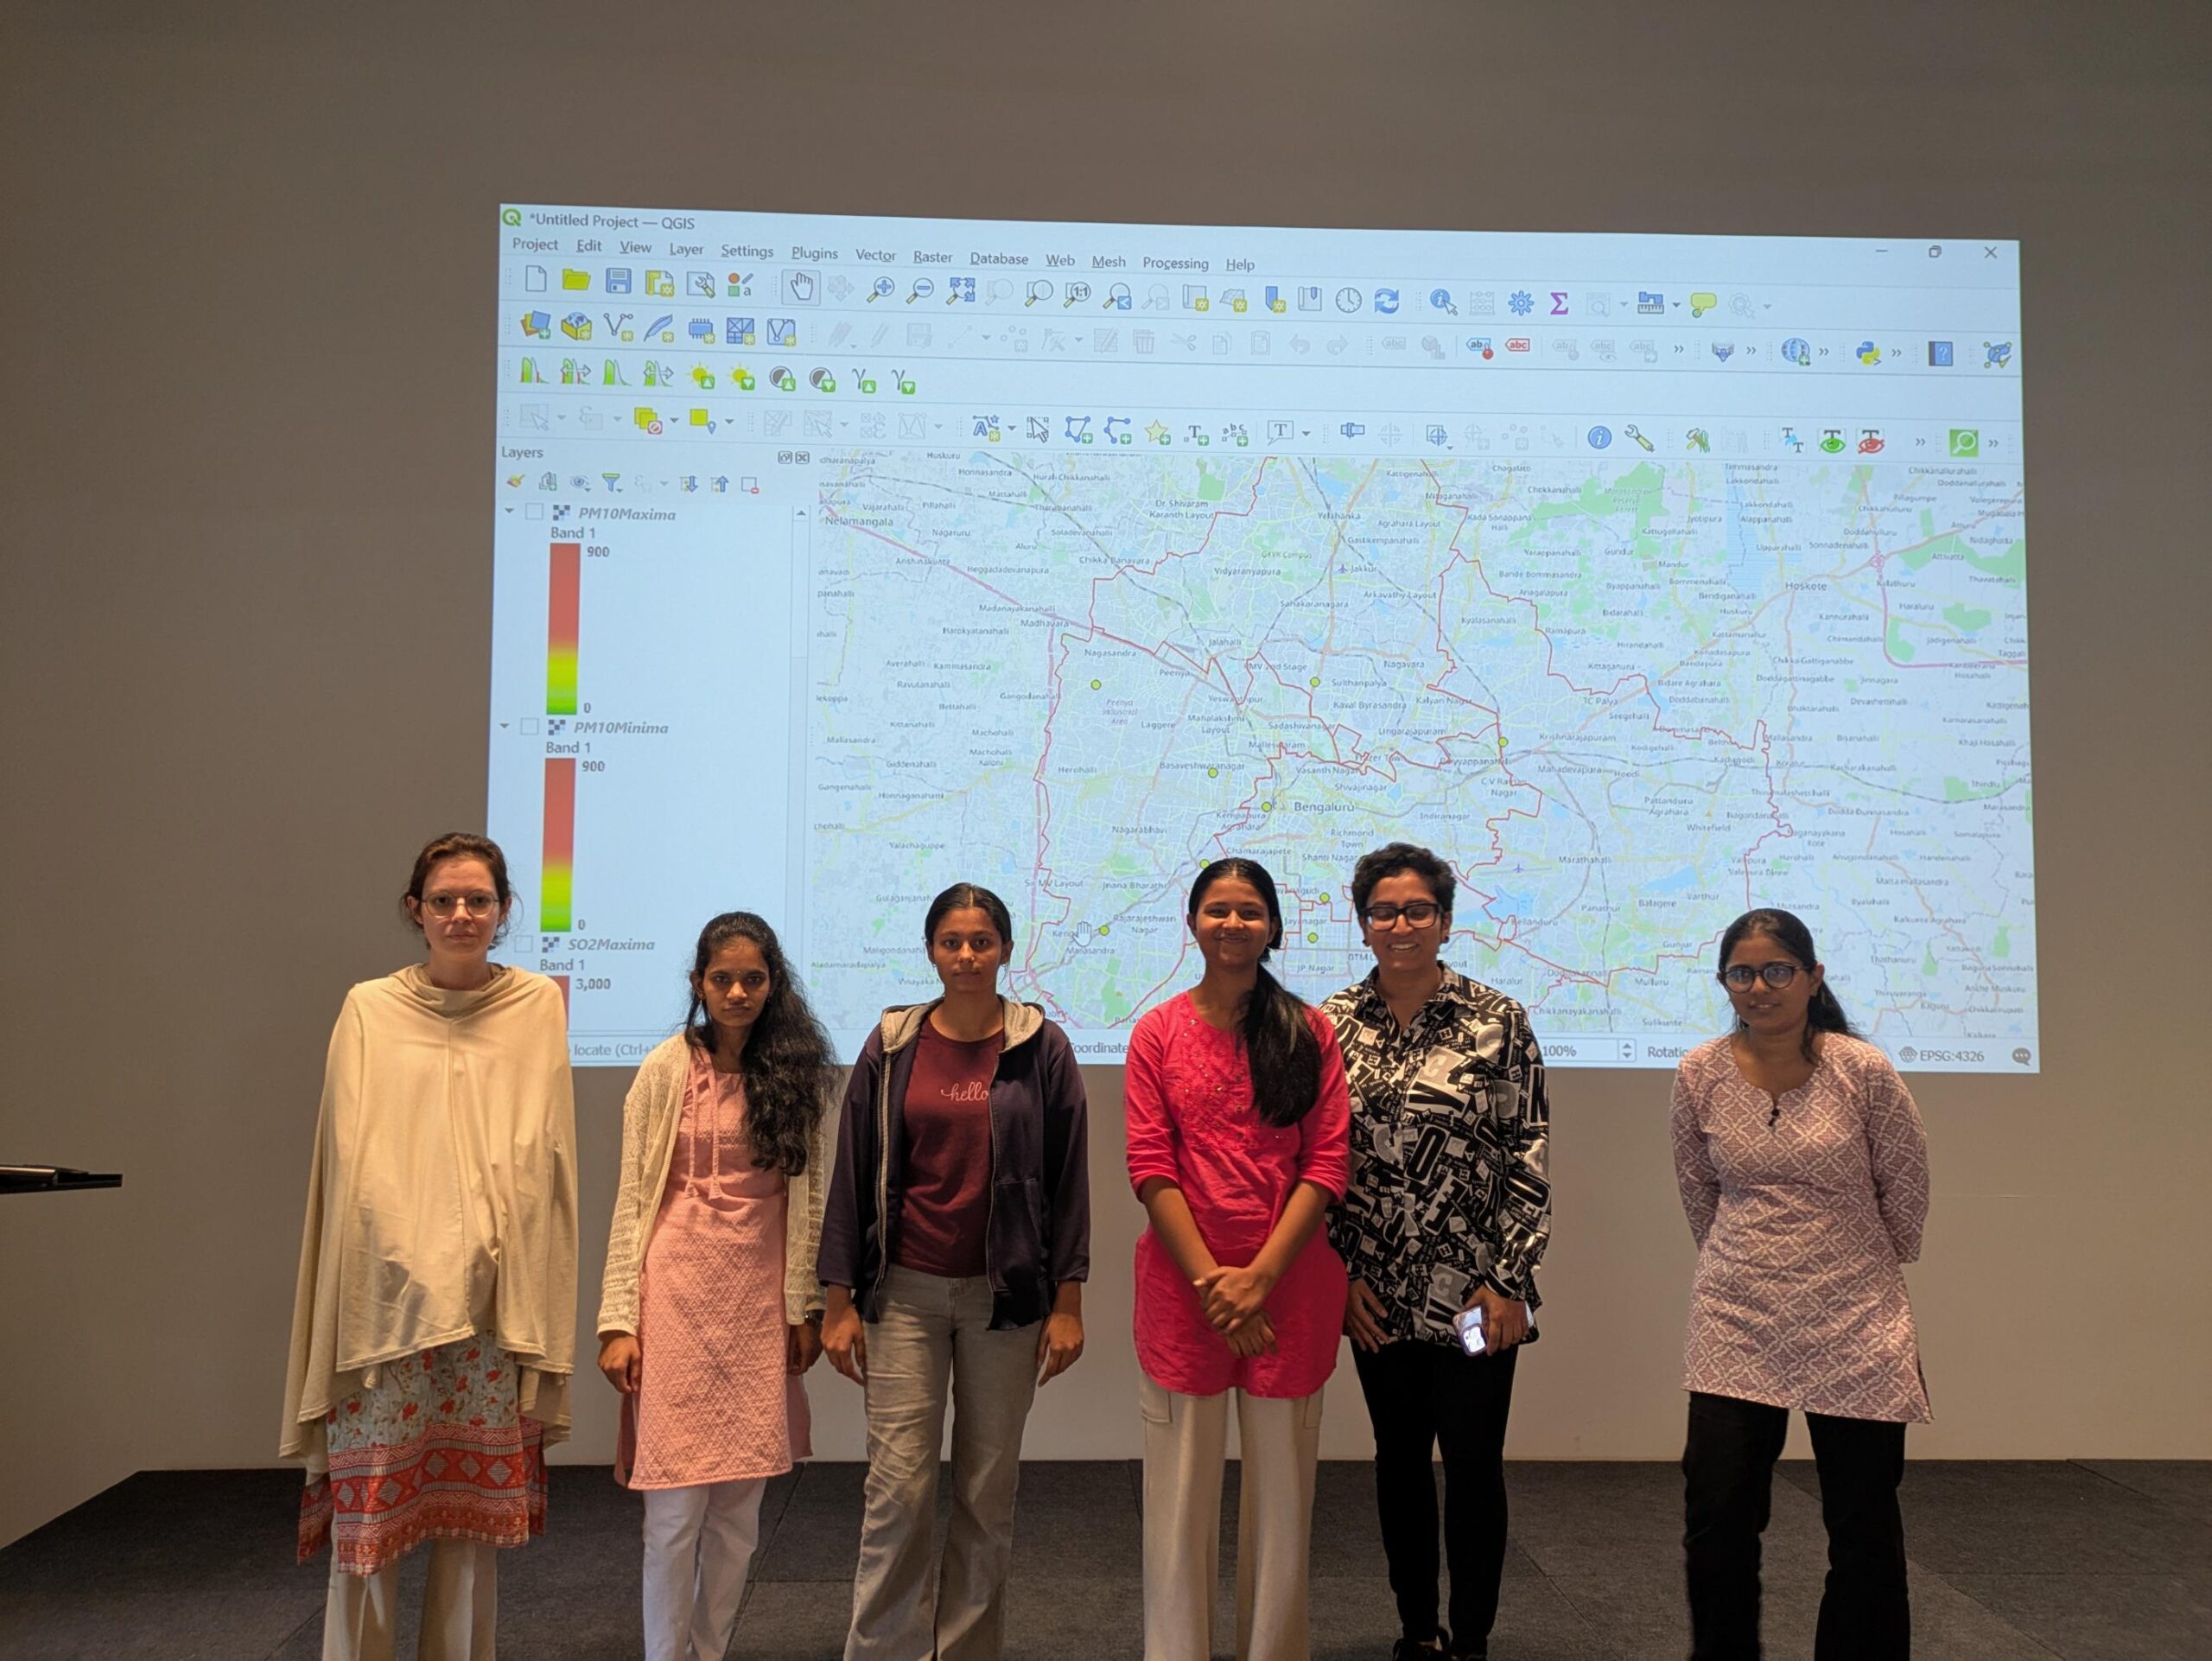
The dashboard would present the different parameters of air quality – PM10, PM2.5, CO, SO2 and NO2, and how different parts of the city are doing on each.
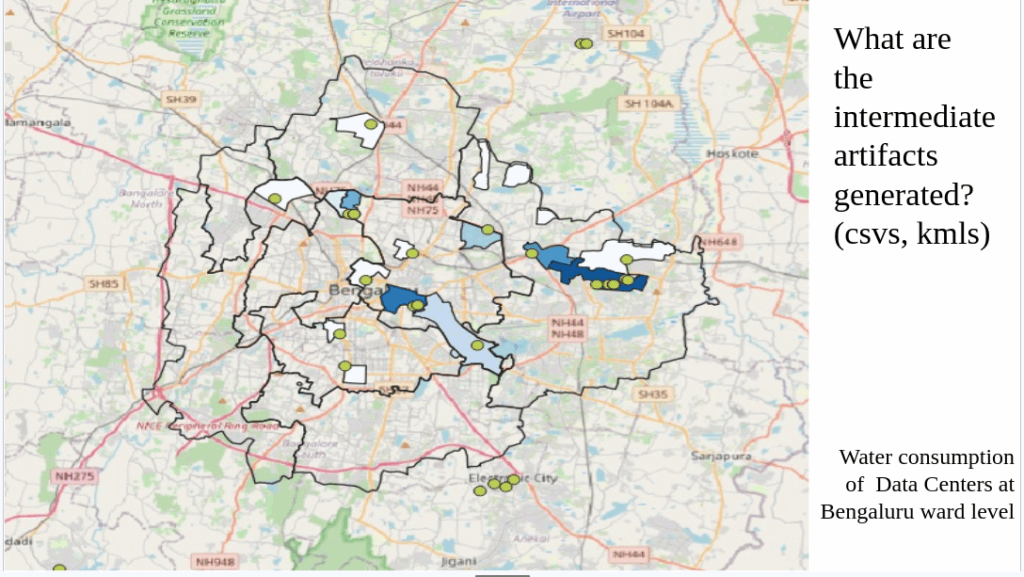
Data Centers and their effects on the city
Ashok, Kshitij, Manisha, Nandinie, Nikhil, Druid, Raghu and Suraj tried to list the datacenters around Bengaluru and map where they are located.
Datacenters typically need large amounts of electricity and water, and mapping where they are located, their size and requirements can help the city understand how they are contributing to the city’s climate.
Mapping the tree canopy
Ayush, Pratham, Siva Kartik, Srivalli tried to map the city’s tree cover and provide a real time dashboard on how it is changing.
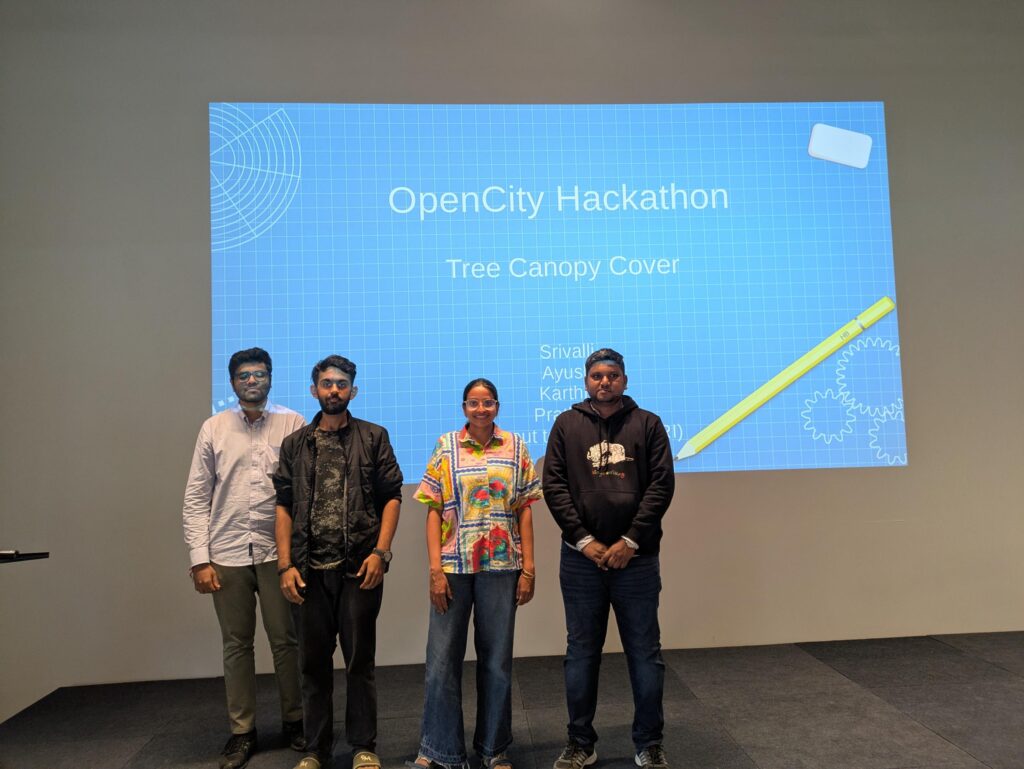
They tried to access Tree Canopy data from satellites and decided to use the NDVI maps to give us an estimate of how the tree cover is changing with time.
Conclusions
From tracking electric vehicle uptake to flooding and data centres in the city, the climate hackathon threw up interesting ideas that can track important parameters to know how Bengaluru is doing in terms of climate resilience.
The dashboard prototypes developed during the hackathon will be integrated into the BBMP Climate Action Cell website. With continued support and contributions from civic groups, data enthusiasts and citizens, the Climate Dashboard is set to evolve into a dynamic, living tool for the city’s resilience efforts.
According to Vaidya R, Program Lead, Data at Oorvani Foundation, “A dashboard to track how Bengaluru is doing on climate related parameters is essential to understand how the city is ticking in these times. Real-time data on how the city moves, what it is breathing, what it is drinking and how the tree cover over its head is changing is important to track. Our aim with this Hackathon was to bring the community together to develop a dashboard that can be used by the community as well as the authorities to track how the city is doing on the Climate Front.”
Lakshmi Menon, a participant, noted that “the hackathon was a great way to see how city data can move from action to monitoring. Our team worked on an RTO-level dashboard for EVs, and the process made it clear that vehicle data is fragmented, but can be collated to track progress. The energy of people and ideas coming together was the real highlight for me.”