With every passing year, Mumbai is experiencing worsening summers, with heat waves starting as early as February. Increasing concretisation is adding to the urban heat island effect, making the mercury soar in Mumbai. Weather patterns are changing too, as people experienced heavy rains causing water-logging as early as mid-May this year.
More than 40% of the population of Mumbai lives in slums. How are they affected by urban heat stress? Compared to other cities, Mumbai also has a much higher number of high-rises. What does such vertical development mean for urban heat? Can the city provide mitigation measures, or even plan around this phenomenon? These were some of the questions that participants in the datajam on Urban Heat in Mumbai tried to answer.
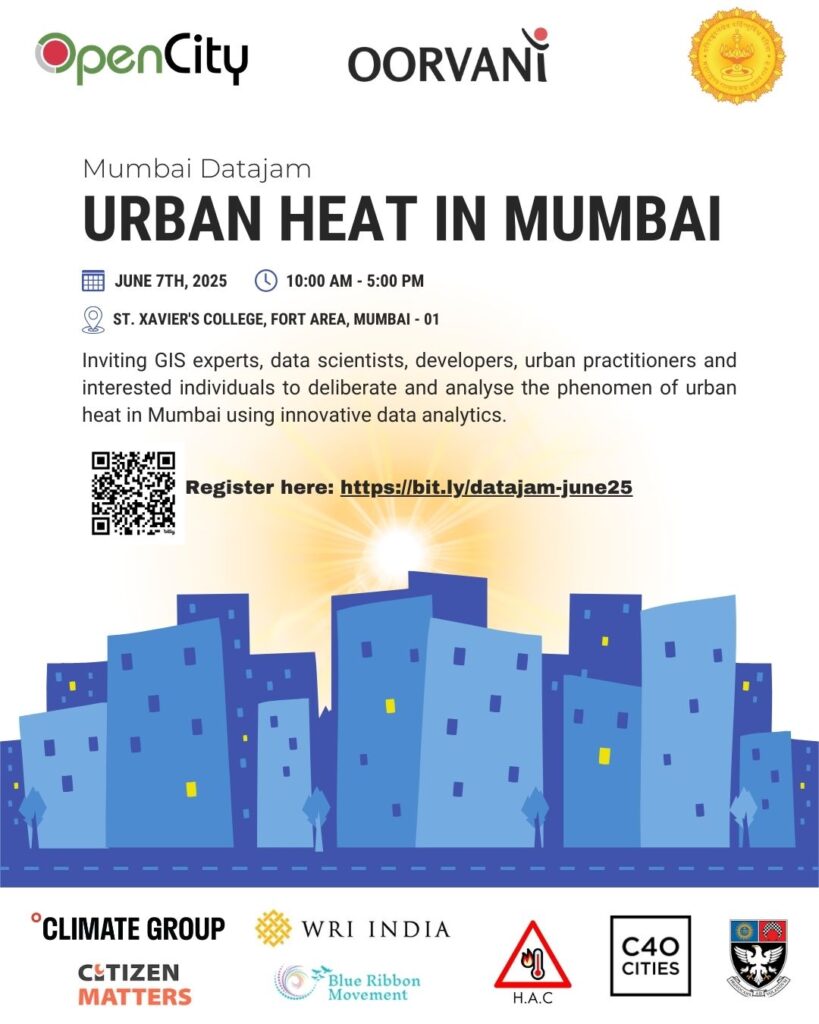
Urban Heat in Mumbai
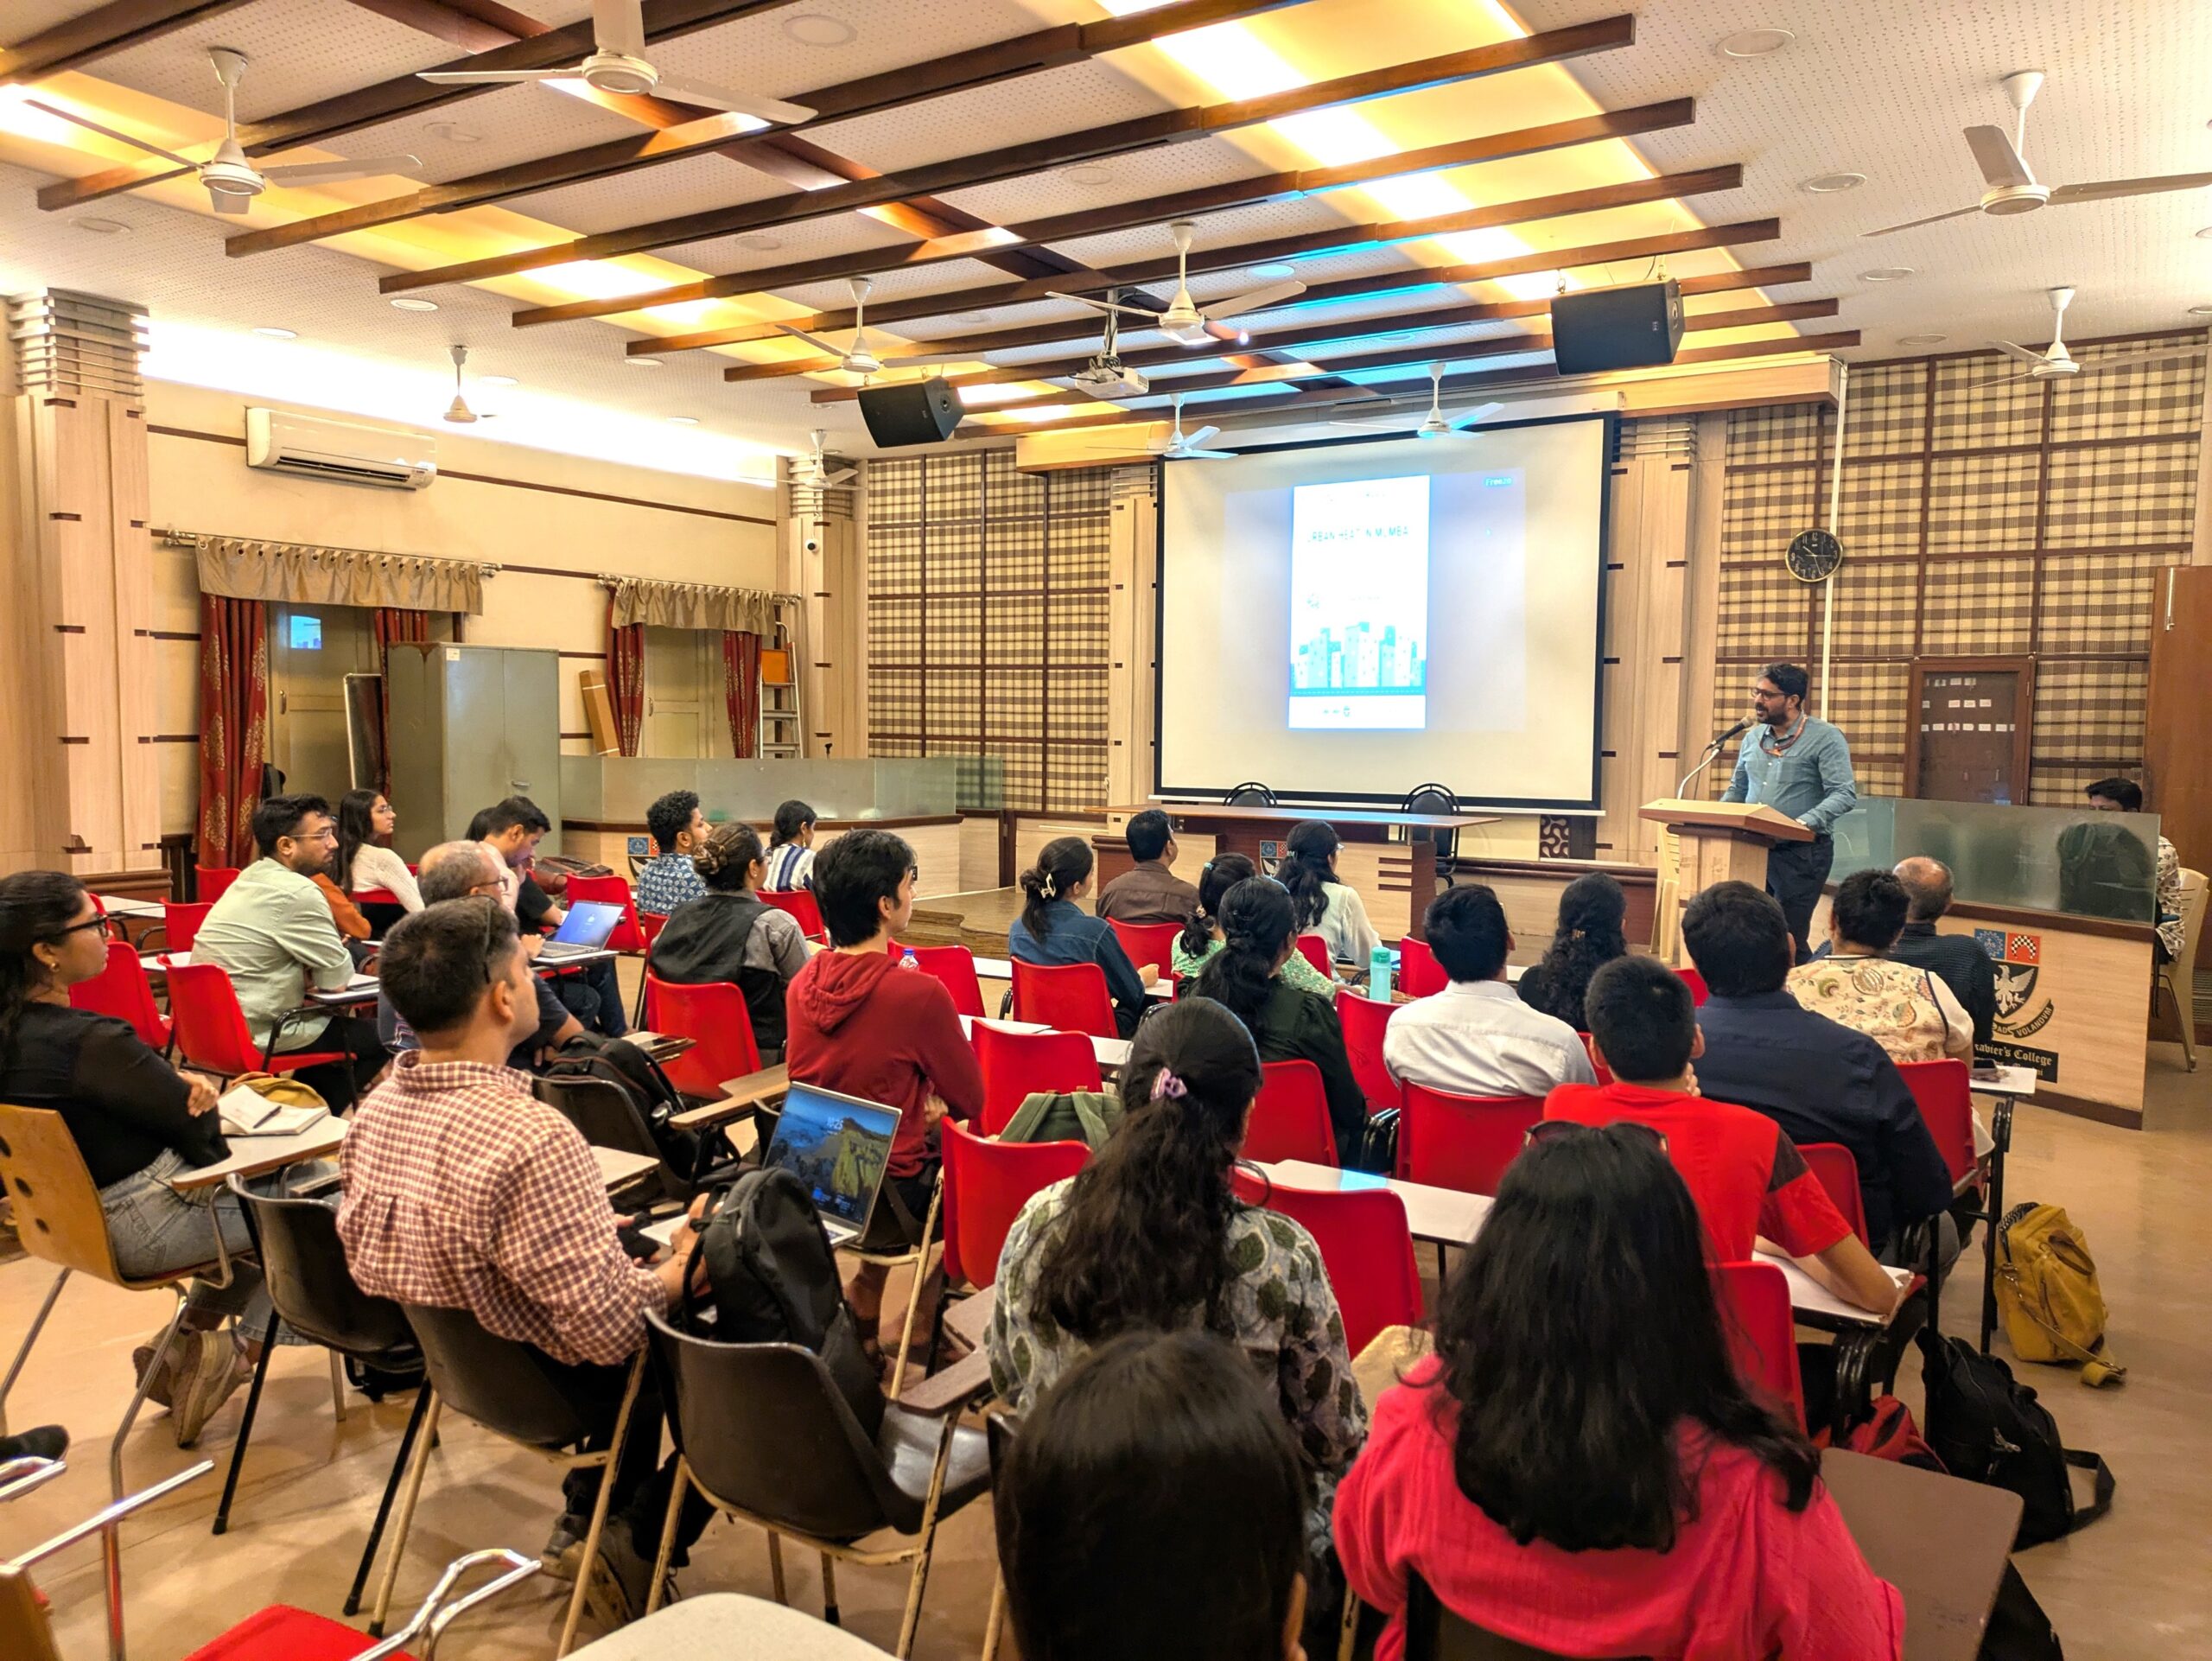
The datajam was conducted in partnership with the Maharashtra State Climate Action Cell, and supported by Climate Group, C40 Cities, Heatwave Action Coalition India, WRI India, and the Blue Ribbon Movement. It was held at St. Xavier’s College (Autonomous), who were the venue partners.
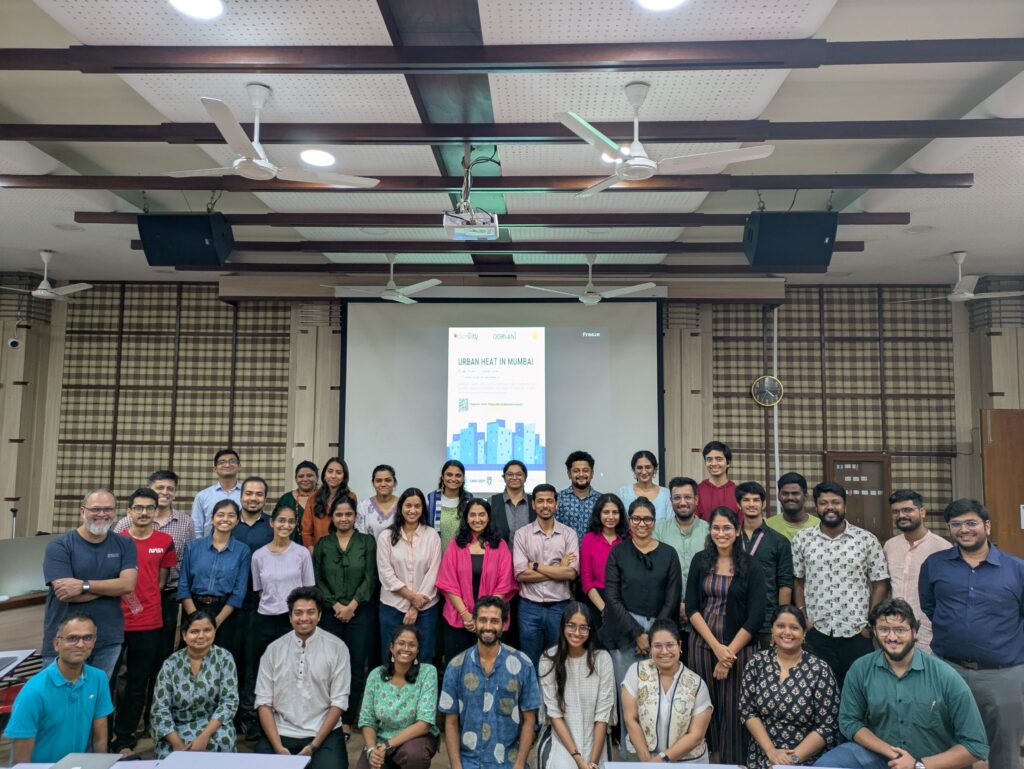
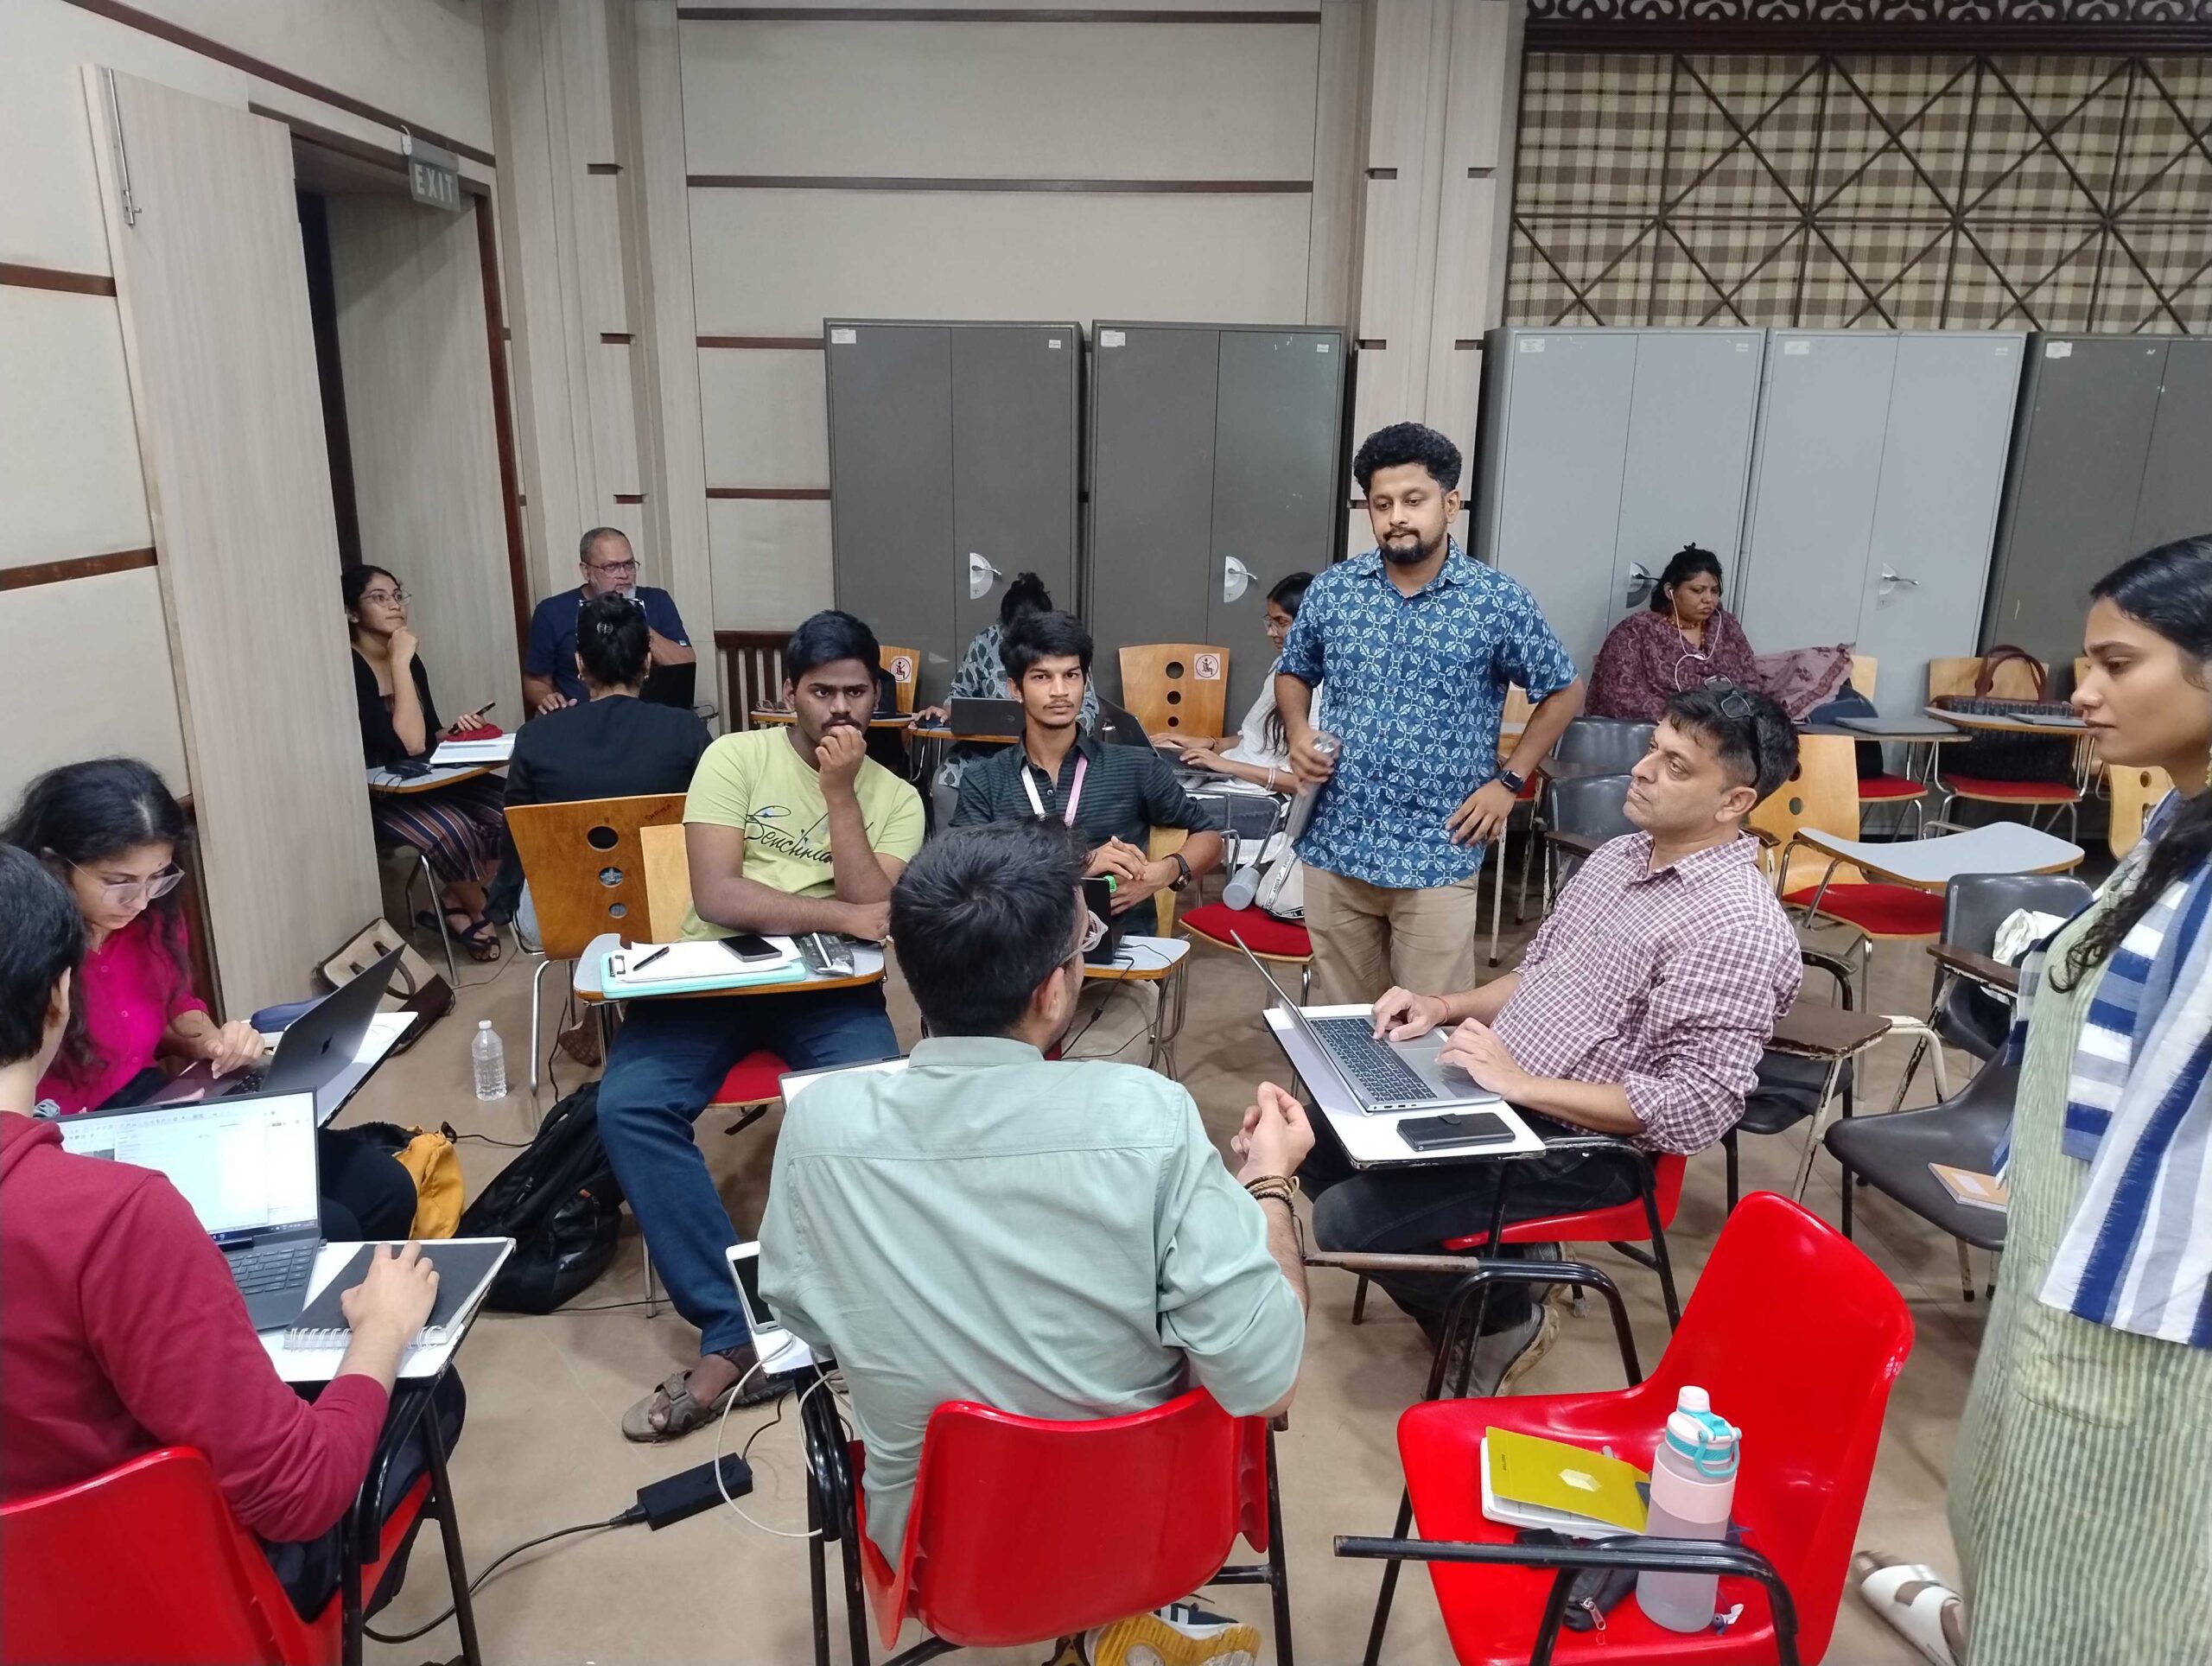
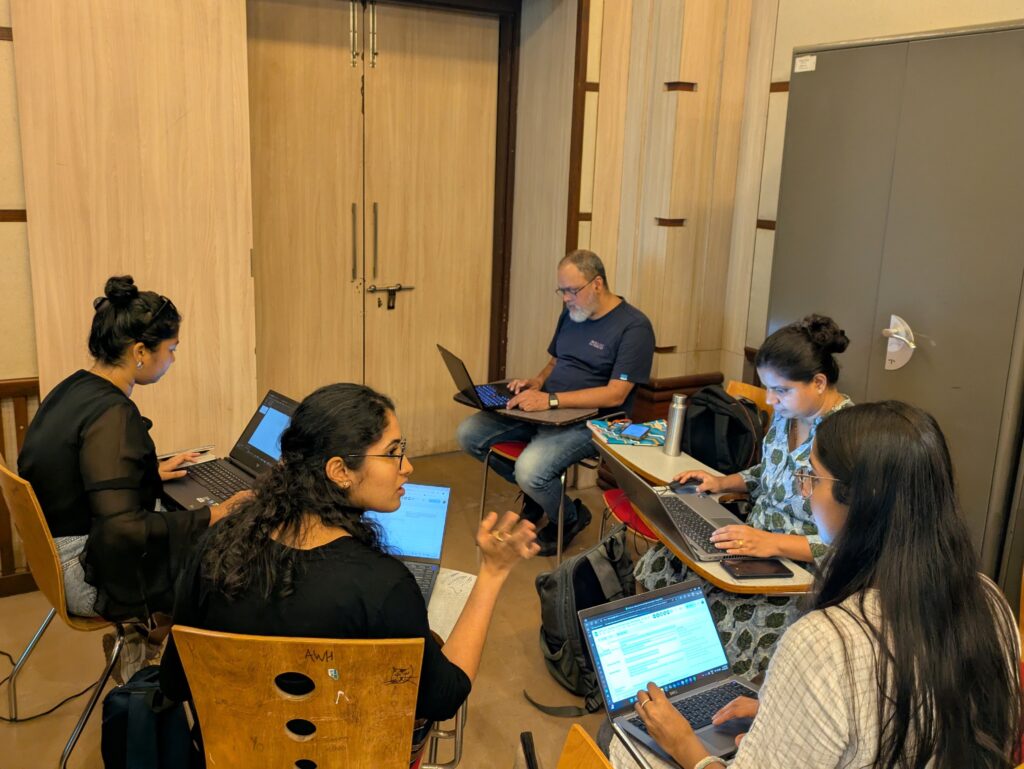
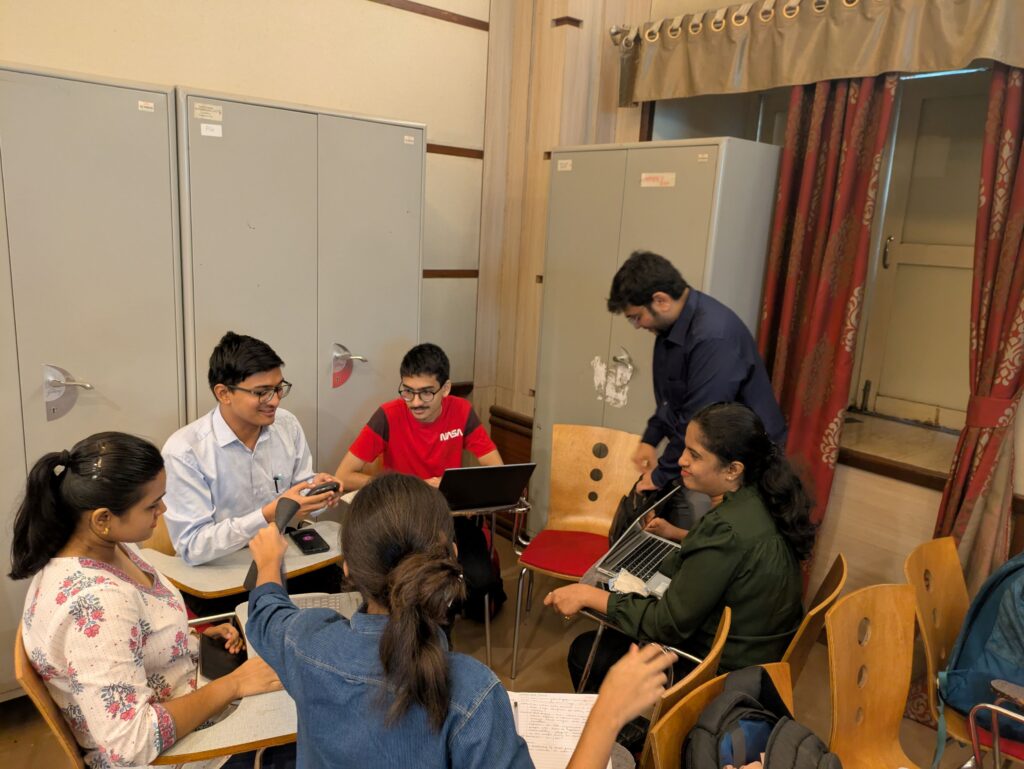
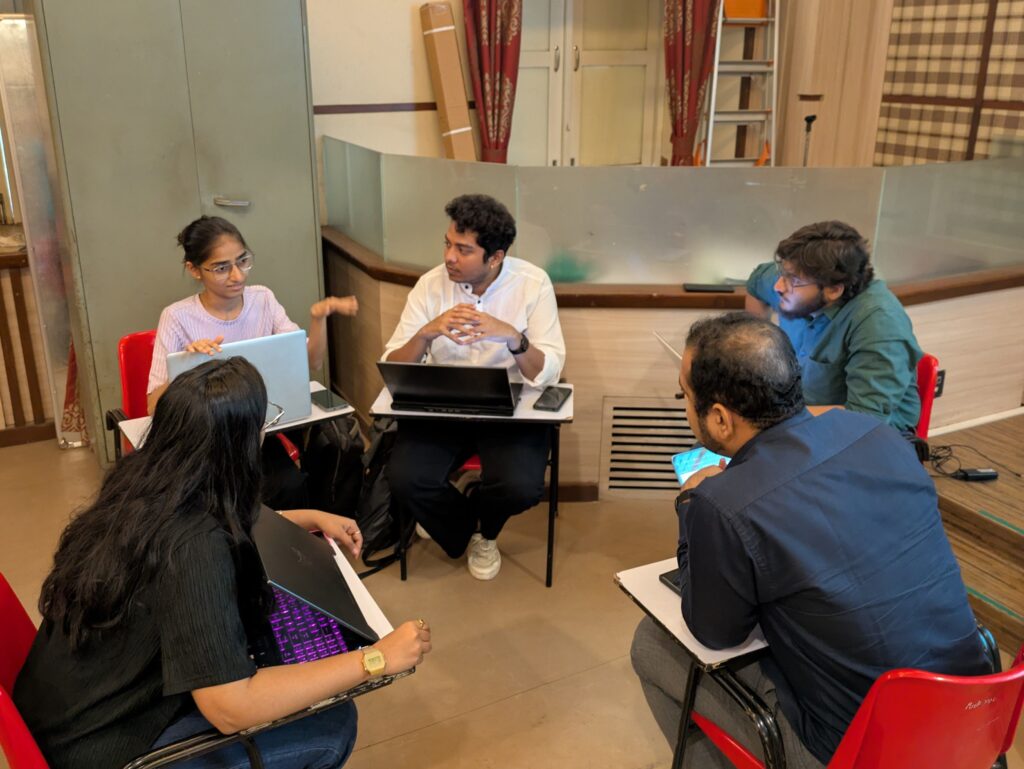
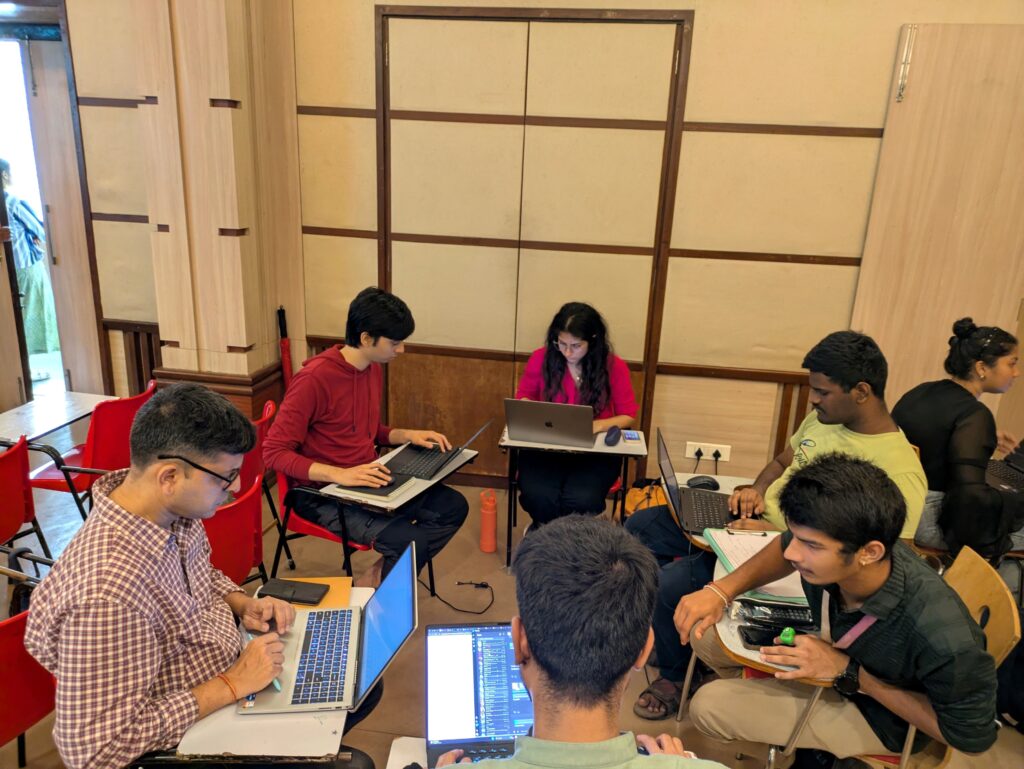
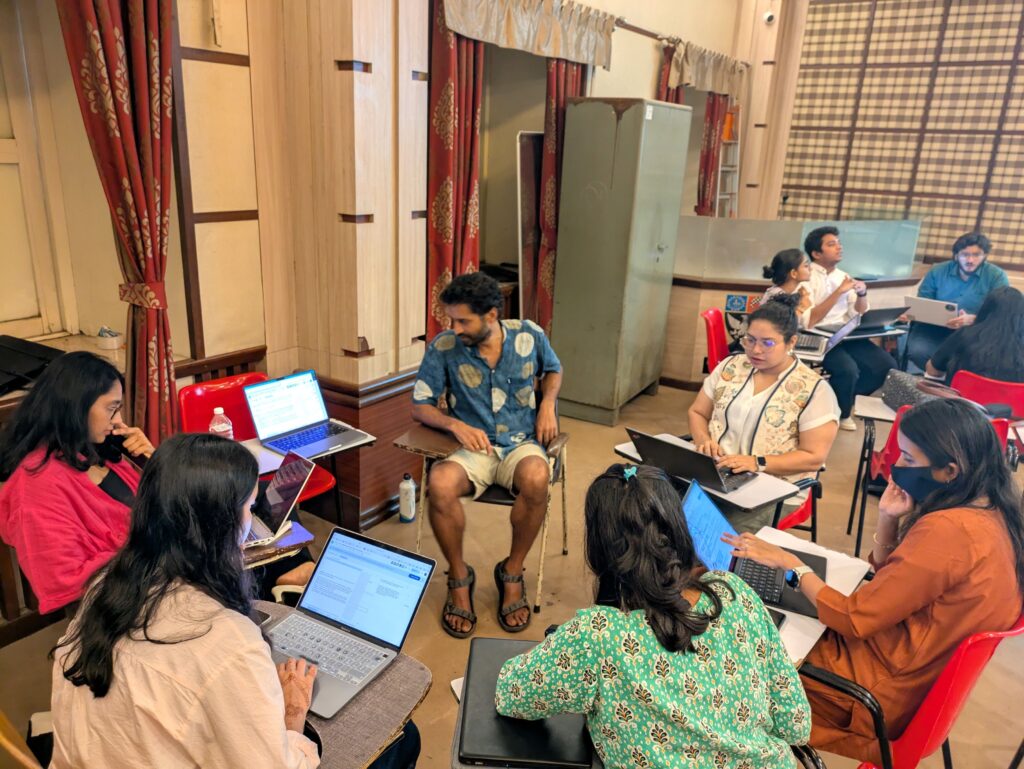
In the day long event, 28 participants from diverse backgrounds – GIS experts, developers, civic society members, researchers, and active citizens split into five teams looked at data to understand how heat affects five different wards of Mumbai.
They used satellite data – Land Surface Temperature maps from Google Earth Engines – both current and historic to map the hotspots in the wards they chose. They correlated the maps with on-ground data like the Census 2011 data, Economic Census data, green cover and the built-up area among others to map out the vulnerabilities from Urban Heat on the ground.
Problem Statements
Like in the earlier datajams in Bengaluru and Chennai, the teams picked a ward each with different characteristics to understand the effect of Urban Heat in different contexts. The wards chosen and their profile were:
- H/East: Mix of informal settlements and formal settlements, part of the Mithi catchment area, and has a major issue of waste management. Vakola Nalla and Mithi river flow through it. Upscale BKC and Mumbai University are also part of this ward.
- M/East: Deonar area is home to one of Mumbai’s largest landfill sites. This ward also houses a substantial low-income population residing in informal settlements, characterized by structures constructed using corrugated metal sheets and asbestos roofing materials. It also has a low vegetation cover.
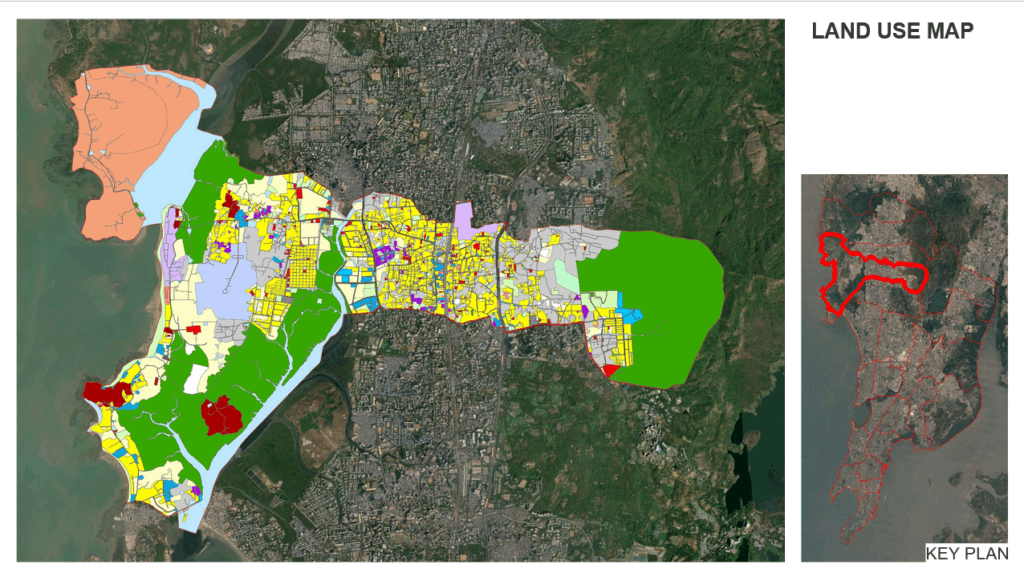
- P/North: Malad-Malvani-Gorai-Manori Area. It has seen rapid and recent urban development in formal and informal settlements like Ambojiwadi, with corresponding reduction in vegetation cover. Diverse land uses like tourism, fishing hamlets, fishing docks, naval base, proposed Slum Rehabilitation Authority (SRA) complexes and increasing residential complexes characterise this ward.
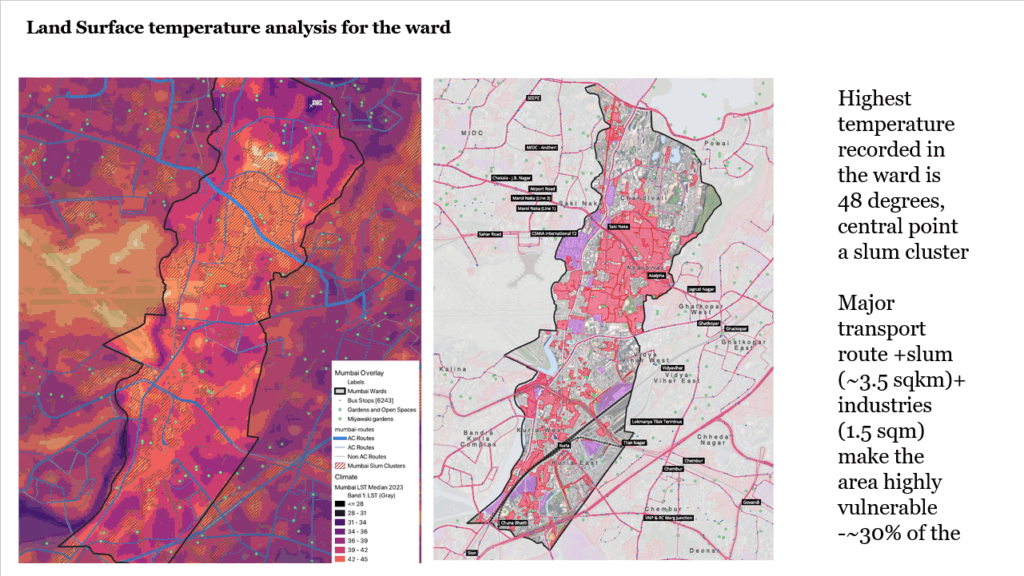
- L: Kurla-Chandivali-Saki Naka-Powai area. It has informal industrial as well as residential settlements. It also has a natural waterbody which has records of sewage and other pollution.
- G/South: Closer to the city centre, it has a diverse landscape, high-built density, ranging from informal settlements and commercial hubs to high rise residential settlements. It is also close to the large coast.
Outputs
H/East Ward
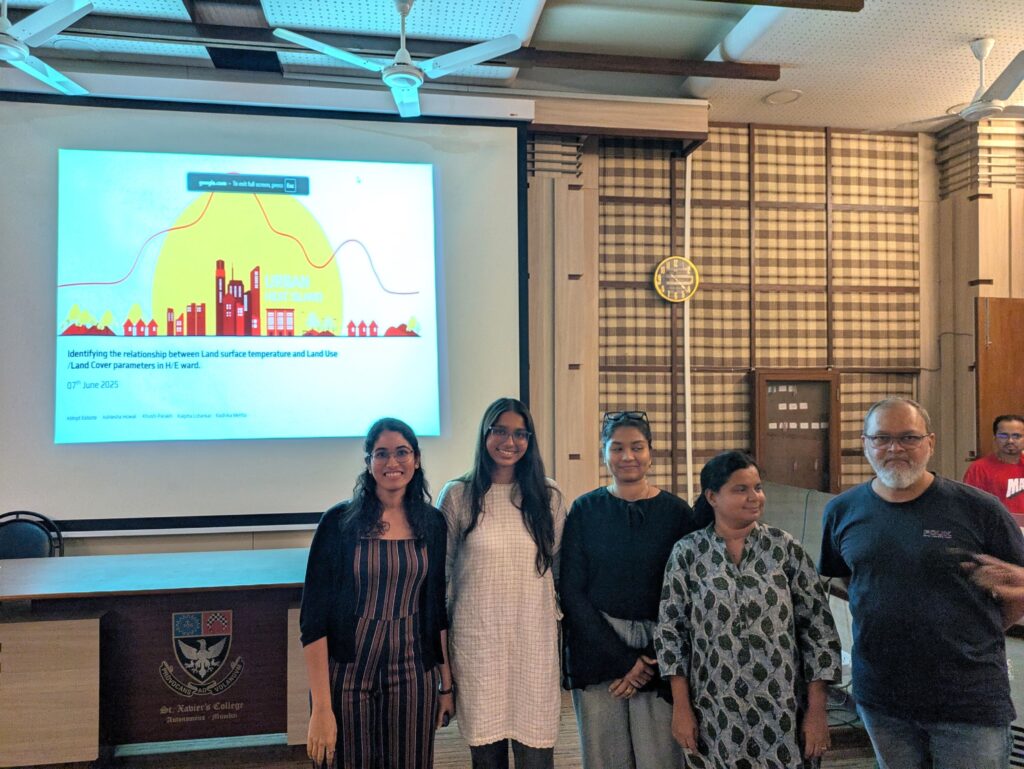
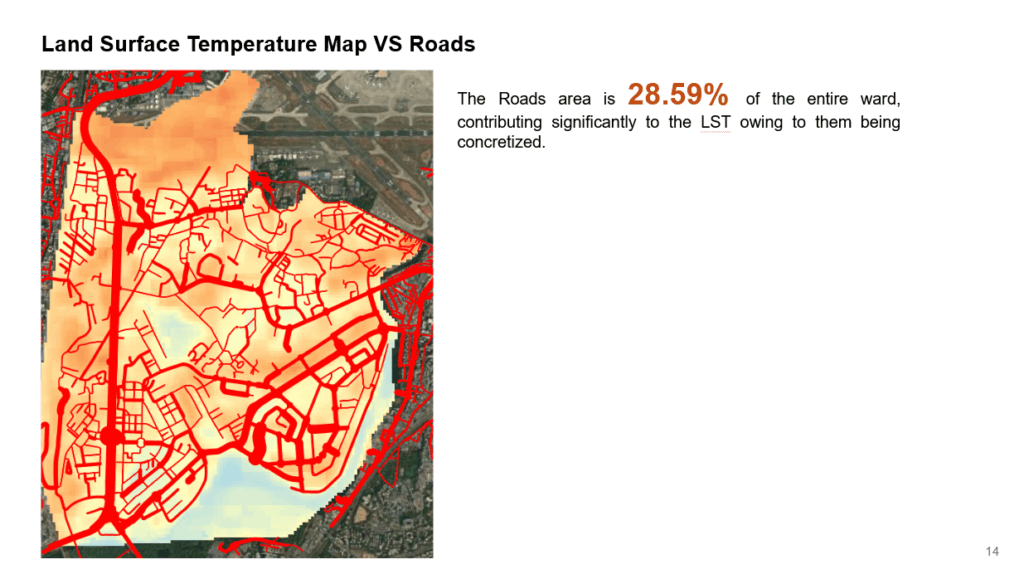
Abhijit, Ashlesha, Khushi P, Kalpita and Radhika tried to identify the relationship between land surface temperature and land use in H/East Ward. Bharatnagar and Behrampada, among the most populated informal settlements are part of this ward. In fact, 73% of the population in the ward resides in informal settlements occupying just 10% of the total ward area.
These informal settlements showed temperatures ranging from 43°C to 47°C while green and open areas were 6-7°C cooler. They found that areas including the airport, informal settlements, their surroundings, and surroundings of slums accounted for 47% of the ward area and are extremely heat-stressed. They suggested that areas like bus shelters need to be developed as heat shelters similar to what was implemented in Ahmedabad along with other heat mitigation mechanisms.
M/East Ward
Varun, Harsh, Hiranya, Ishika, Salil and Mark tried to delineate the ward into 44 neighbourhoods with different landuse characteristics and analysed how urban heat affects these neighbourhoods.
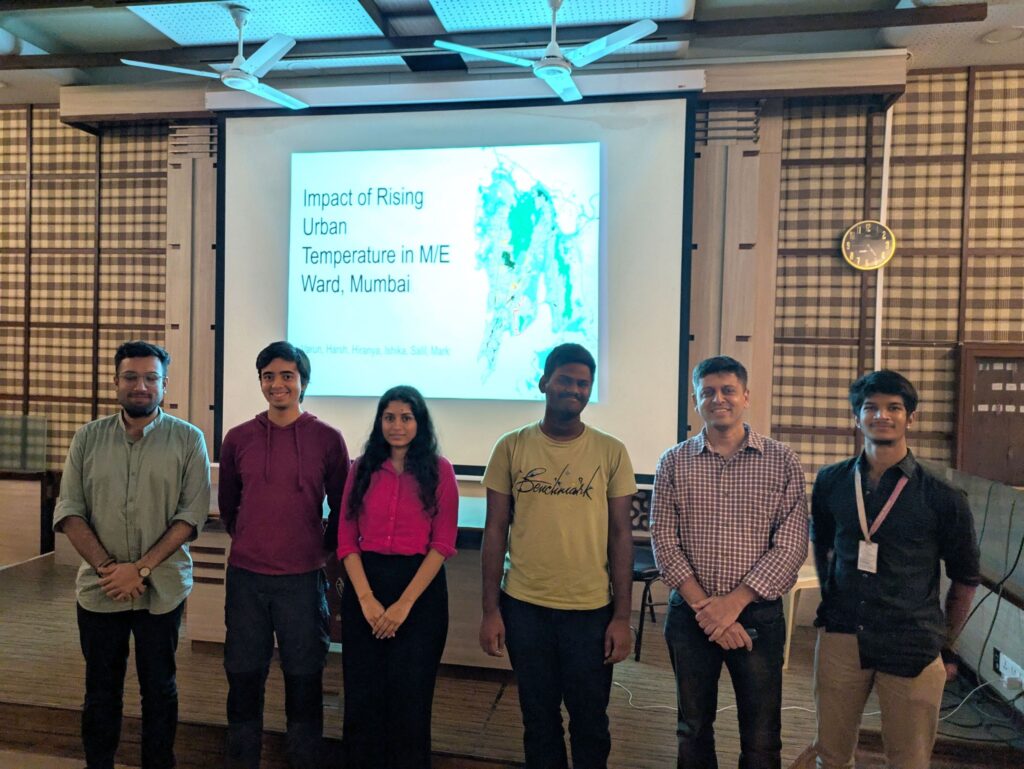
In terms of urban morphology they noted that the wards could be classified into four categorites – high rise high density (SRA settlements), low rise high density (informal settlements), high rise low density (gated communities), low rise low density (campus colonies). They computed a formula for the Land Surface Temperature considering factors like vegetation, building footprint, building height among others. Based on this, they noted that higher built-up area like in informal settlements and SRA settlements indicate a higher heat stress. Correspondingly vertical constructions tend to do better, likely due to shade from the taller buildings and reduced surface exposure.
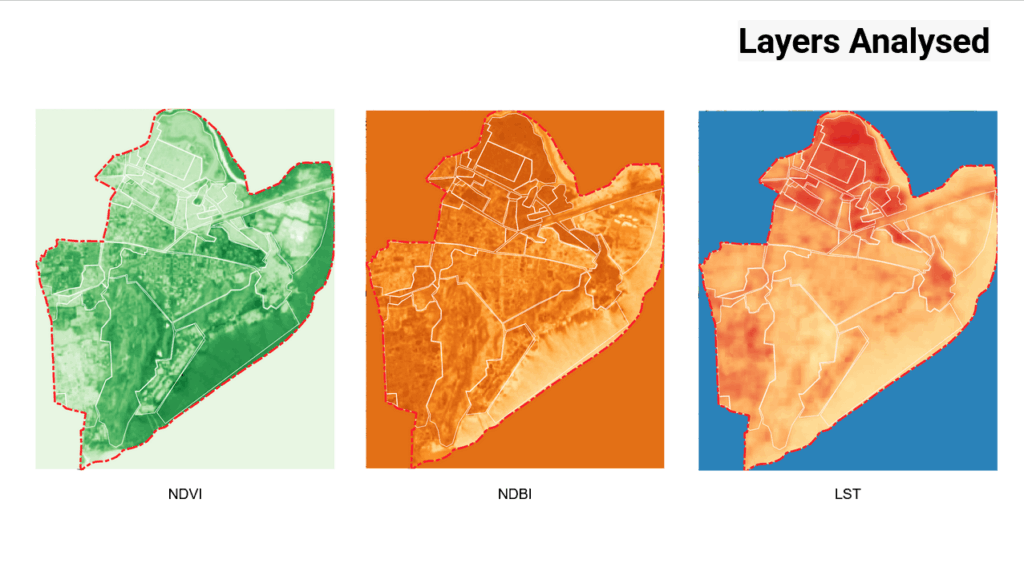
P/North Ward
Aniket, Guruprasad, Karan, Nishi and Samruddhi tried to analyse the heat vulnerability in P/North ward and how it has changed over the last ten years. They noted that the ward is characterised by the green cover of the Sanjay Gandhi National Park in the East and the coastal areas with mangroves in the West. These were seen to be cooler areas.
However, this meant that the people were squeezed into the centre of the ward and the density at the centre was extremely high. Since 2015, the highest temperature people in the ward have been exposed to has risen from 42°C to 50°C, and more areas have been facing heat stress over the years. Satellite images show that areas in SGNP have been deforested and the same is true of the Western parts of the ward where upcoming residential and public projects have been encroaching into the green cover.
L Ward
Arun, Anjali, Asmita, Ekta, Henna, Shilpa and Tanvi looked at how urban heat is affecting L ward in the Eastern suburbs. They noted that Chandiwali informal settlement was the hottest part of the ward, baking at 48°C during the hottest months. Lack of green areas, metal roofing, lack of air flow, river waste pollution and stagnant blackwater were seen to be contributing to the extreme heat in these areas.
They analysed how accessible transport is in the ward, and noted that apart from one trunk route, there are no major routes where AC buses ply in the area leaving people commuting by public transport vulnerable to the extreme heat. They recommended implementing heat-resistant pavements, rail tracks and vehicles to help mitigate the impact on the transport infrastructure. Providing shade, natural coolers, and water fountains in transit stations and shelters could also help reduce heat exposure for passengers. Training workers on heat safety, providing rest breaks, and offering alternative work schedules could also help protect workers from heat-related illnesses.
G/South Ward
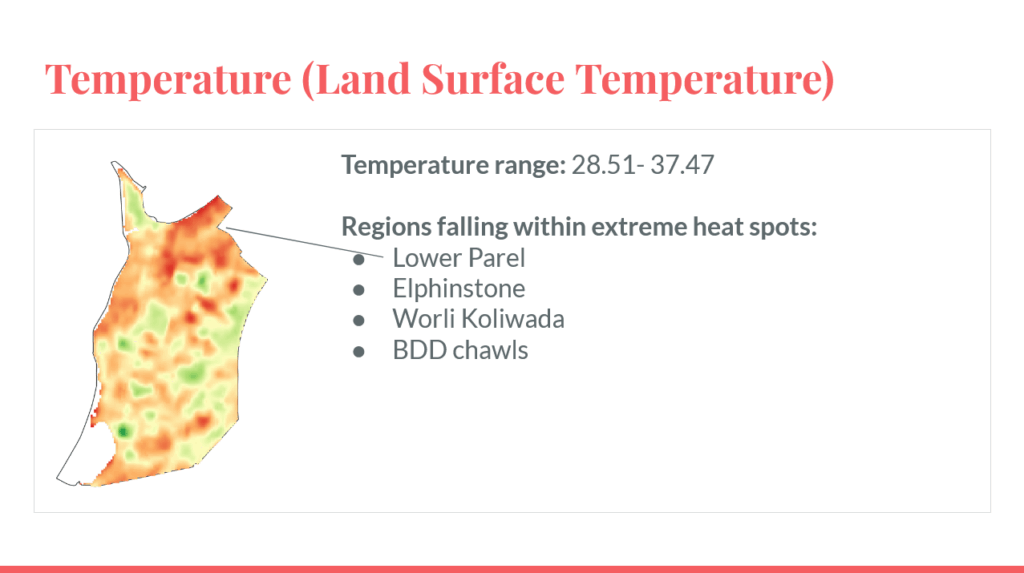
Aditi, Amit, Deep, Khushi Y, Shaiv and Shruti delved into the heat characteristics of G/South ward. They noted the lack of vegetation in most of the ward except in the southern parts near the Race Course. Areas in the northern part of the ward – Lower Parel, Elphinstone, BDD Chawls and Worli Koliwada faced the highest heat stress in the ward.
In areas with very high heat stress dense high-rises, asphalt roads, ongoing construction, glass façades and low albedo surfaces were seen to be contributing to heat retention. High density old chawls and informal settlements with minimal tree cover, tin roofs, and paved surroundings that were trapping heat were also experiencing high heat stress. They noted that the Mahalaxmi race course was the main green area of the ward providing much needed lung space.
Conclusions
One of the important characteristics that differentiates Mumbai from other cities is the stark difference in living standards. With more than 40% of the population crammed into informal settlements, with the well-to-do occupying high rises, the way heat is distributed across the island is expected to be different.
All the teams noted that the high-density informal settlements faced the most heat stress compared to every other type of residential or even working environments. The only entity hotter than the informal settlements was the air-conditioned airport. The airport is also surrounded by informal settlements who face the largest brunt of the heat among the informal settlements. These settlements were also seen to be having minimal green cover or access to open spaces. Public buses with AC tended to ply far from these areas needing people to walk long distances in the heat or use other modes of transport.
Vertical constructions were seen to be better off, possibly because of the shade and lower exposed surface area. SRA constructions while being better than informal settlements weren’t particularly cooler either. The presence of landfills and dumping grounds significantly changed the game for the areas surrounding them, similar to what was seen in Chennai.
The high temperatures people are exposed to has gone up from 42°C to 50°C in the last nine years and solutions need to be implemented urgently. Green roofing, better construction material, greening of areas, cool bus shelters were suggested by the teams, and these need to be taken up on a war footing.
Shruti Gokarn of Citizen Matters noted that “such data driven exercises are necessary for Mumbai. They are a step in the direction of finding mitigation and adaptation measures.”
Sarita Fernandes, Climate Fellow, Maharashtra State Climate Action Cell added that “Citizen Science spaces are limited in climate action and access to them is a challenge. Data Jams bridges the gap between policy and people, data and its impacts and is a long-term solution to climate action.
Shilpa Shashidaran, Manager – Climate Implementation at C40 Cities felt that “Datajam is a wonderful platform to bring people from diverse sectors together to translate the vast pool of data into usable actions for policymakers and citizens. Such events are also a great avenue for raising awareness and understanding the gaps for working on such critical climate risks such as urban heat”.
For the participants it was a learning experience. According to Aditi Sharma, interning with the Maharashtra State Climate Action Cell “the Data Jam event was an amazing learning experience for every beginner who wants to trace and explore the reasons behind heat spots across different parts of the city. This is a great initiative to identify and understand the policy gaps in tackling the climate risks.”