Bengaluru’s civic infrastructure challenges are well-documented, but what do the numbers actually tell us? Through a comprehensive analysis of over 126,000 grievances filed with the Bruhat Bengaluru Mahanagara Palike (BBMP) in the first half of 2025, we uncover the real pulse of citizen concerns across India’s Silicon Valley.
Using BBMP’s grievance data published through OpenCity’s data portal, this analysis reveals not just what Bengalureans are complaining about, but how effectively the city administration is responding to these concerns. An interactive dashboard mapping these grievances across all 198 wards provides unprecedented visibility into urban service delivery patterns across one of India’s fastest-growing metropolises.
The Scale of Civic Engagement
Bottom Line Up Front: Bengaluru citizens filed 126,974 grievances across 198 wards in just 5.5 months of 2025 (till June 19th), averaging 638 complaints per ward and over 750 complaints per day. While this might seem alarming, it actually represents active civic engagement and a functioning grievance redressal system with an impressive 86.2% resolution rate.
The data spans from early January through mid-June 2025, capturing the peak summer months when infrastructure stress typically intensifies. Interactive mapping reveals that complaints aren’t uniformly distributed – they cluster heavily in peripheral growth areas and IT corridors, telling a story of urban expansion outpacing infrastructure development.
Street Lights and Garbage: The Twin Challenges
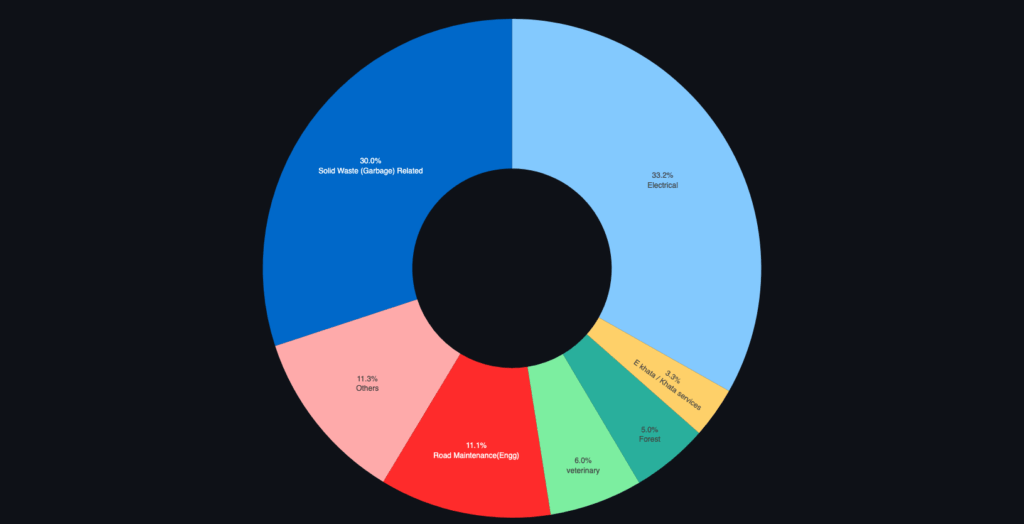
Two categories dominate Bengaluru’s civic complaint landscape, together accounting for nearly two-thirds of all grievances
Electrical issues lead the pack at 33.2% of all complaints (42,138 cases), with street light failures alone constituting 31.4% of total grievances. This translates to approximately 225 street light complaints every single day. The sheer volume suggests either inadequate infrastructure maintenance or aging electrical networks struggling to keep pace with the city’s rapid expansion.
Solid waste management follows closely at 30.0% (38,151 cases), breaking down into three main sub-categories:
- Garbage dumps: 12.7% of total complaints
- Garbage vehicle delays: 9.6%
- Inadequate sweeping: 2.9%
These numbers reflect the ongoing waste management crisis that has plagued Bengaluru for years, particularly in rapidly developing areas where waste generation has outpaced collection infrastructure.
The Geography of Complaints
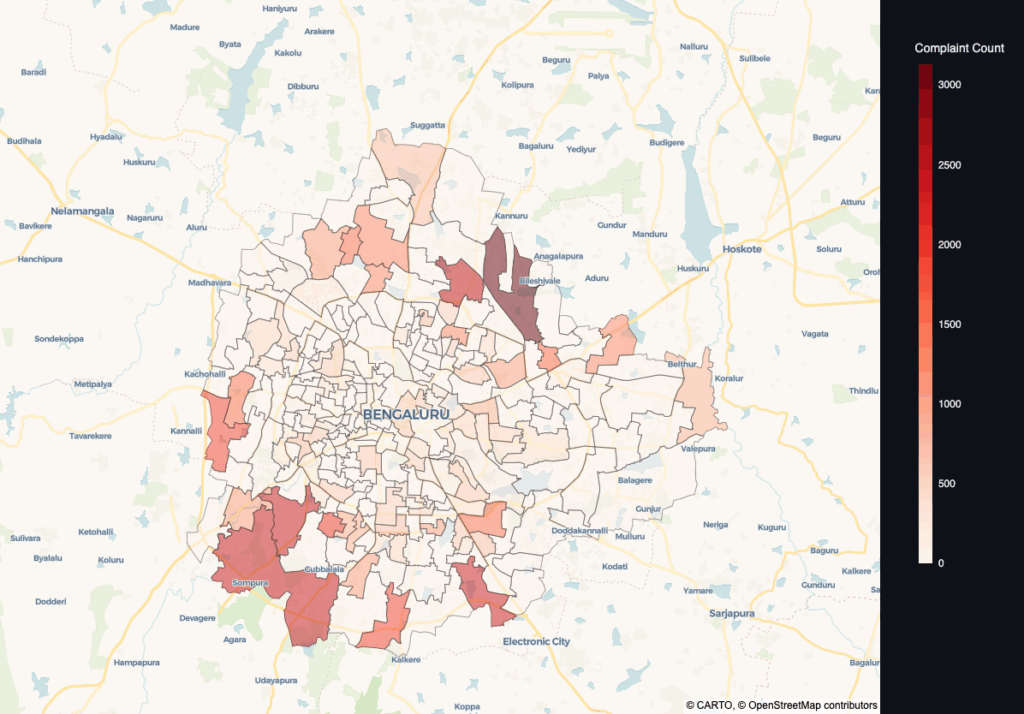
Ward-wise distribution reveals stark patterns about urban development and service delivery. The interactive choropleth map clearly shows complaint density radiating outward from the city center, with the highest concentrations in Bengaluru’s growth corridors:
Top 10 complaint-generating wards:
- Uttarahalli (2,072 complaints) – Southern expansion zone
- Horamavu (3,128 complaints) – Northern suburb experiencing rapid residential development
- Jnanabharathi Ward (2,842 complaints) – Educational hub with expanding housing projects
- Thanisandra (2,480 complaints) – Key northern growth corridor
- Hemmigepura (2,415 complaints) – Emerging residential area
- Jakkur (2,408 complaints) – Northern tech corridor expansion
- Rajarajeshwari Nagar (2,401 complaints) – Major southern residential hub
- Begur (2,338 complaints) – Southern IT corridor
- Bellandur (2,257 complaints) – Established IT hub facing infrastructure strain
- Someshwara (2,114 complaints) – Developing peripheral area

The scatter map visualization reveals that peripheral wards consistently generate the highest complaint volumes, suggesting that Bengaluru’s expansion is systematically outpacing infrastructure development.
Central wards show relatively fewer complaints, likely reflecting better-established infrastructure and higher administrative attention, while the complaint clusters follow major arterial roads and IT corridors where rapid development has occurred.
Resolution Efficiency: A Nuanced Success Story
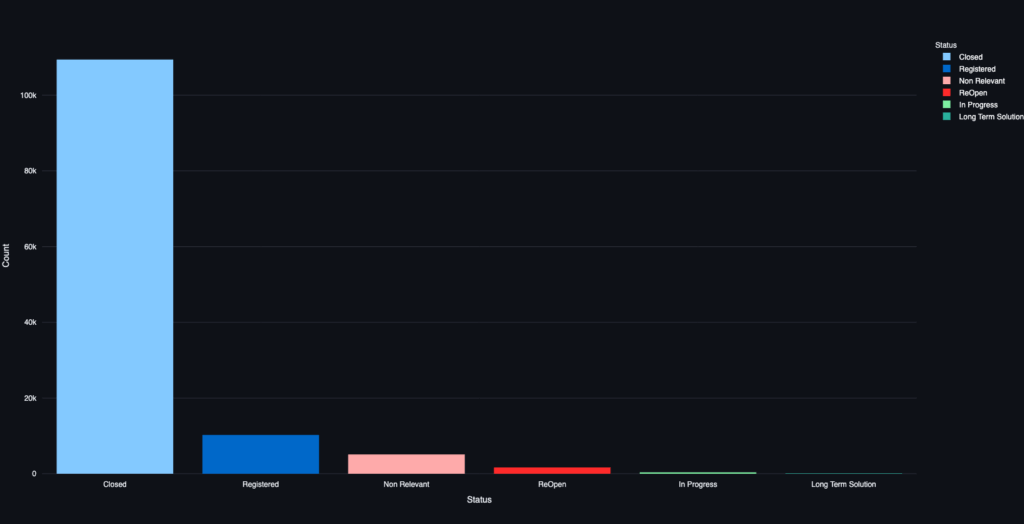
The headline statistic is genuinely encouraging: 86.2% of grievances are marked as “Closed,” representing 109,410 resolved cases. However, diving deeper into resolution rates by category reveals significant variations in administrative efficiency:
Category-wise resolution rates paint a compelling picture:
- Electrical complaints: 96.4% resolution rate – Despite massive volume (42,138 cases), the high resolution rate suggests well-established repair protocols
- Veterinary issues: 94.2% resolution rate – Indicating effective animal control and veterinary services
- Forest-related complaints: 93.2% resolution rate – Tree removal and pruning requests handled efficiently
- Solid Waste Management: 85.1% resolution rate – Lower than average, reflecting systemic challenges in waste collection
- Road Maintenance: Only 58.0% resolution rate – The concerning outlier, suggesting complex infrastructure issues requiring longer-term solutions
Current status breakdown reveals system dynamics:
- Registered cases: 8.1% (10,257) – Fresh complaints in the pipeline
- Non-Relevant cases: 4.0% (5,118) – Misfiled or outside BBMP jurisdiction
- Reopened cases: 1.3% (1,656) – Previously “closed” cases disputed by citizens
- In Progress: 0.3% (359) – Active resolution underway
- Long Term Solution: 0.1% (120) – Complex issues requiring systematic intervention
The low percentage of “In Progress” cases suggests either efficient processing or potential transparency gaps in status tracking. The significant number of “Non-Relevant” cases indicates citizens often approach BBMP for issues outside its mandate, highlighting the need for better citizen education about administrative boundaries.
Temporal Patterns: The Monthly Rhythm of Urban Issues
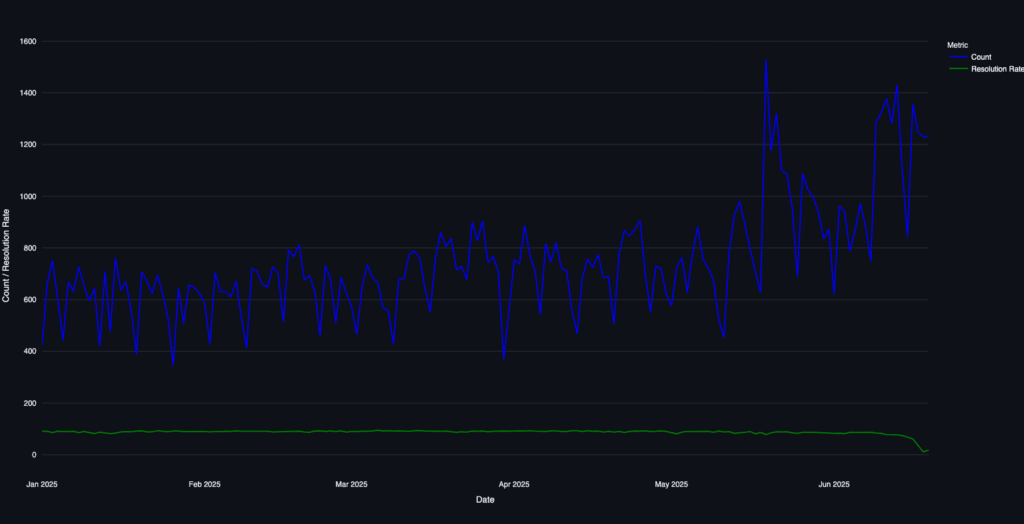
The grievance timeline reveals a fascinating story of climate unpredictability. Bengaluru experienced an extraordinary weather event in May 2025, with the India Meteorological Department issuing a red alert as the city recorded 104mm of rainfall and faced “heavy to very heavy rainfall” warnings – completely upending normal seasonal patterns.
January-March 2025: Steady complaint levels during the typical dry season, with infrastructure operating within normal parameters.
April surge: Initial rise in complaints as temperatures increased during what should have been the peak hot season.
May anomaly: The unexpected heavy rains in May 2025, with authorities issuing red alerts and the city experiencing significant waterlogging and flooding, likely triggered a different category of infrastructure stress. Instead of the usual electrical grid strain from heat, the city faced monsoon-like challenges three months ahead of schedule.
June moderation: A relative decline as the city adapted to the unusual weather patterns, though data only covers until mid-June.
This temporal analysis reveals that Bengaluru’s infrastructure faces a double challenge – not just seasonal stress, but increasing climate unpredictability. The May 2025 red alert and heavy flooding events suggest that complaint patterns may increasingly reflect climate variability rather than predictable seasonal cycles. Traditional summer infrastructure planning may need fundamental revision to account for such weather anomalies.
Summary
Bengaluru’s grievance data reveals several key patterns. Electrical issues dominate complaints at 33.2%, primarily street light failures, while solid waste management accounts for 30.0% of grievances. The high resolution rate of 86.2% demonstrates effective digital governance, though category-wise performance varies significantly – electrical complaints show 96.4% resolution while road maintenance achieves only 58%.
Geographically, complaints cluster heavily in peripheral wards like Horamavu, Jnanabharathi Ward, and Thanisandra, indicating that urban expansion is systematically outpacing infrastructure development. Central wards generate fewer complaints, likely reflecting better-established infrastructure.
The May 2025 weather anomaly – with red alerts and unprecedented rainfall causing city-wide flooding – disrupted typical seasonal patterns and highlighted climate unpredictability as a new challenge for urban infrastructure planning.
The digital grievance system successfully captures citizen concerns across all 199 wards, with an average of 638 complaints per ward. However, the geographic concentration in growth corridors and the varying resolution rates by category suggest that while the complaint mechanism works, the underlying infrastructure challenges require more systematic solutions than reactive repairs.
Areas near the ORR and major arterial roads show consistently high complaint volumes, reflecting the strain on infrastructure along development corridors. The temporal patterns, disrupted by unusual weather, indicate that traditional seasonal planning assumptions may need revision to account for increasing climate variability.
This analysis is based on BBMP grievance data from January through June 19, 2025, made available through OpenCity’s Urban Data Portal. The comprehensive interactive dashboard with ward-wise mapping, temporal analysis, and detailed visualizations is available at blr-grievances-jun-2025.streamlit.app
Methodology: Analysis performed on 126,974 valid grievance records across 199 wards using statistical analysis, geographic mapping, and temporal pattern recognition. Ward boundaries sourced from Bengaluru GIS Portal. All percentages rounded to one decimal place. Categories and status classifications as per BBMP’s official taxonomy.
Dashboard created by Ashutosh Shukla using Streamlit, featuring interactive maps powered by CARTO and OpenStreetMap.