The Government of Karnataka published the Economic Survey of Karnataka for 2021-22. This is a comprehensive document with details about the Gross Domestic Product at state level (GSDP), at district level (GDDP), as well as district and state level per-capita income. It also includes details about the education sector, farming, industries, services and health.
What data about the GDDP and GSDP say about Bengaluru Urban’s contribution
Bengaluru Urban is one of the main contributors to the state’s GDP. But the skew towards the capital city is heavier than one would expect. The state’s GDP for the financial year 2019-20 stands at Rs. 16.16 Lakh Crore of which 5.96 Lakh Crore is from Bengaluru Urban. The city hosts less than a sixth of the state’s population but contributes 37% of the state’s GDP!


This shows up in most indicators of the state, economic as well as health. The per-capita income of the districts is also skewed heavily towards Bengaluru Urban. While the state’s per-capita income is Rs. 2.22 Lakh, that of Bengaluru Urban alone is Rs. 5.41 Lakhs. No other districts cross Rs. 4L, with Dakshina Kannada district being the only other district to cross Rs. 3 Lakhs.

This has much larger implications in terms of where Karnataka stands among other states. In terms of per-capita income, Karnataka ranks a healthy fifth ahead of even Tamil Nadu and Kerala. More importantly, it counts among a cohort of states like Tamil Nadu, Kerala, Maharashtra and Gujarat that are recognised as “rich” states.
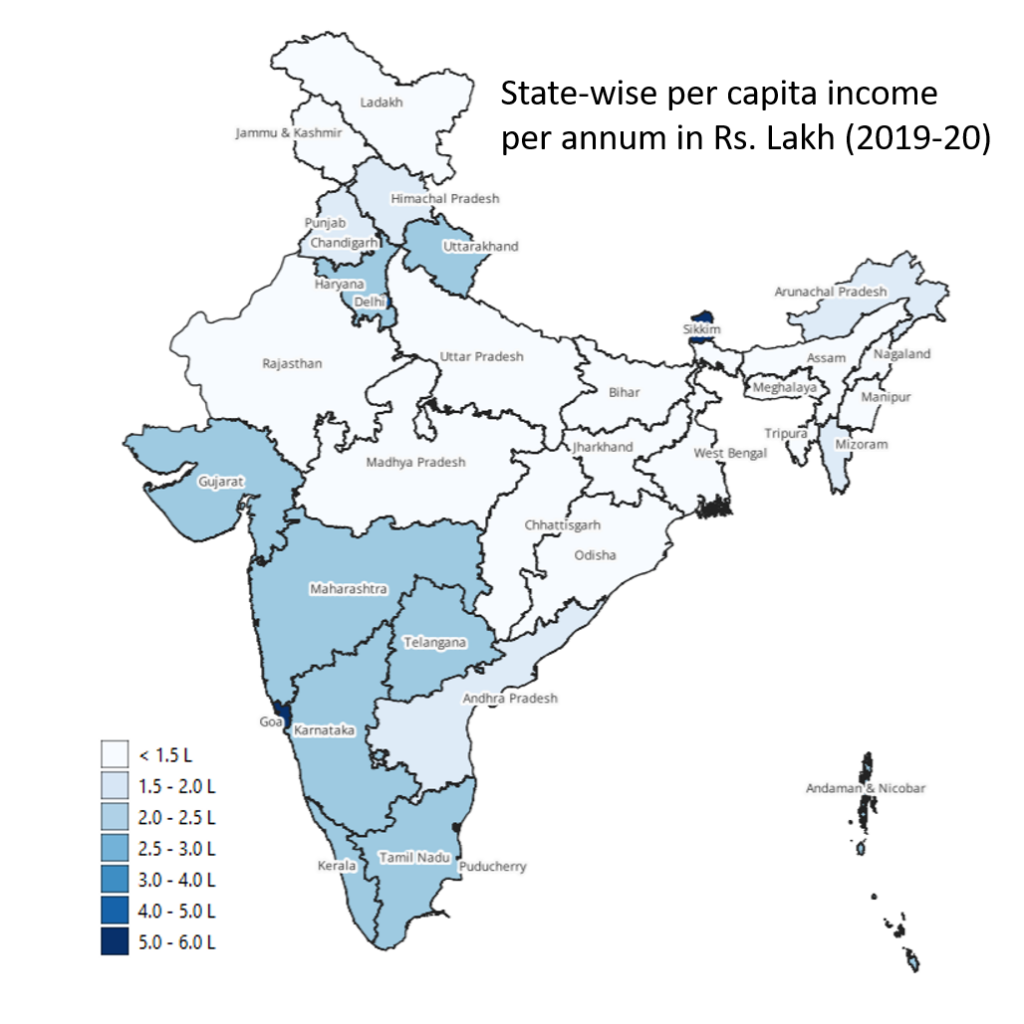
However, if Bengaluru Urban is excluded, the per-capita income drops by a whopping 27% to Rs. 1.62 lakhs. The ranking drops to 14th, just ahead of Punjab. Without counting its capital, the state even drops a category and ends up in the same league as Punjab, Andhra Pradesh and Arunachal Pradesh.

The Economic Survey recognises this lopsidedness and calls out the need to develop other districts in Karnataka: “the rest of the state excluding Bengaluru, particularly the ten poorest districts in North Karnataka, must be rapidly developed with adequate high-wage employment opportunities in scalable industrial enterprises so the per-capita output and low GDDPs grow faster than the state average. Even other areas in South Karnataka, excluding Bengaluru, need development opportunities that enable them to grow faster and contribute more to the state economy.”
It identifies the need for a “concerted sustainable urbanisation drive” across Karnataka stating that “urbanisation is critical for improving the quality of life for all citizens across the state”. In terms of urbanisation, the report points out that only 38% of the state’s population lives in urban areas, while this percentage is much higher in the neighbouring states of Tamil Nadu (48.5%) and Kerala (47.7%).
For Bengaluru Urban, the survey calls the city “the jewel in the crown of Karnataka making up a significant component of GSDP, paying the majority of the taxes, and with the highest per-capita income
amongst India’s cities”. It also recognises the city’s woes and stresses the need to “develop the city and allocate the necessary resources for Bengaluru to achieve its potential as a global hi-tech city”. “Increasing prosperity has led to severe infrastructure challenges with a lack of an appropriate governance mechanism to meet the citizens’ needs”, observes the survey.
What the outlay for the year 2021-22 shows
While the survey points out the need to develop the rest of the districts, the district-wise outlay for the year 2021-22 paints a different picture.
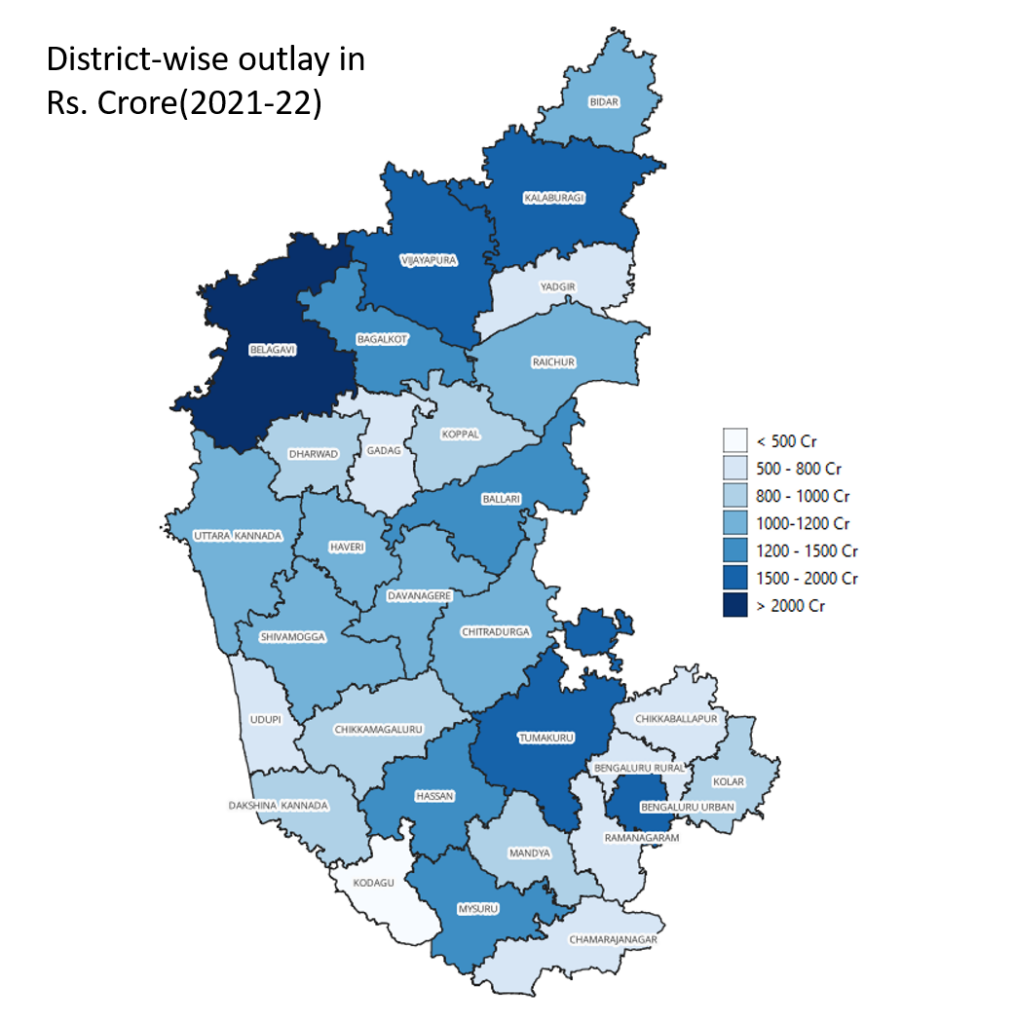
While Belagavi receives a whopping Rs. 2656 Cr and Bengaluru Urban, Tumakuru, Vijayapura and Kalaburgi districts garner a good share of the funds, other districts in North Karnataka don’t have much to look forward to. In fact, Yadgir and Gadag, two of the least developed districts of the state are among the bottom three districts in the outlay.
Given how the outlay does not seem to match the actual development needs of the state as identified by the Survey itself, it won’t come as a surprise when the next National Family Health Survey (NFHS) or Economic Survey is published to find these districts continuing to languish at the bottom.
You can access the Economic Survey document as well as csvs of important tables here.
(Note: The survey records data from 2019-20, and Vijayanagara district was not yet bifurcated from Ballari. The maps reflect the same.)