Recently three Bengaluru techies got together to map the BMTC bus stops information. The information they managed to map wasn’t just bus stops, but also bus accessibility and other details at the booth level. A booth is the smallest administrative unit, smaller than a ward. The information here at booth level includes information like the number of people in that area, number of bus stops in that area, and how well they are connected by buses.
That information along with bus stop data was made public here. The data is open, and with permission and attribution to Sathya Sankaran, one of those involved in the project, we at Opencity have converted the data to kml and hosted it here. This is a brief explainer on how to work with the data and what each field is.
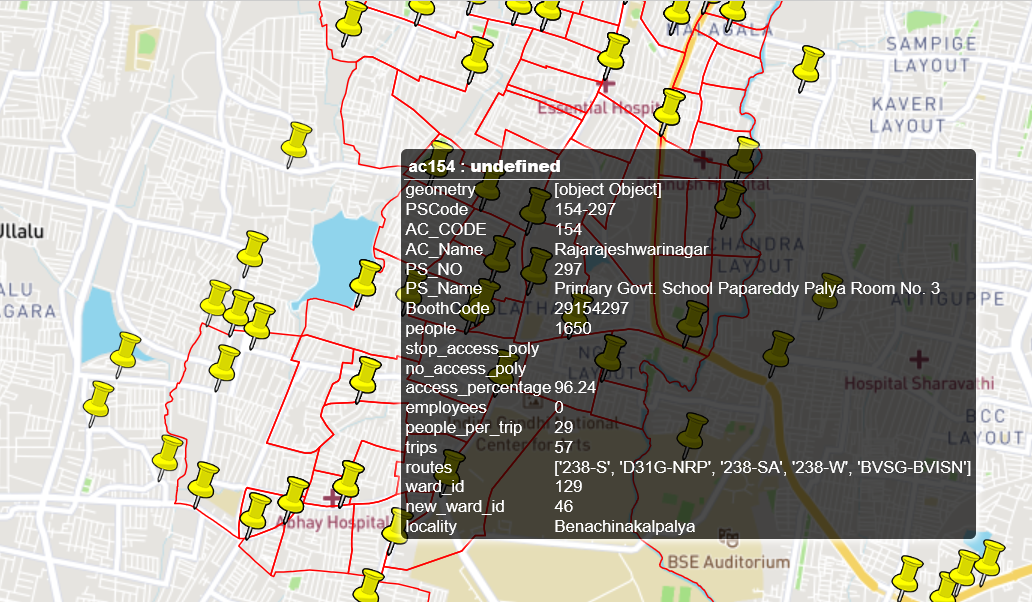
If you click on an area(bounded by red lines) in the map it shows information like PSCode, AC_Code, AC_Name, PS_Name etc and other details. 
- PSCode, PS_No and PS_name are Polling Station details. For eg. PSCode of 154-297 means Assembly constituency 154 (Rajarajeshwarinagar) and PS_No of 297. The polling station name is “Primary Govt. School Papareddy Palya Room no. 3”.
- AC stands for Assembly Constituency, the name and number of which are given in the balloon. For e.g., in the screenshot above, you can see that AC_Code 154 would be “Rajararajeshwarinagar”(AC_Name) Assembly constituency. Each assembly constituency gets its own map file. Booth code refers to the unique code for the booth. In this case, 29154297.
- People is the number of people in the area as per the 2011 census.
- Access Percentage is the percentage of people for whom a bus stop is within 500m of their residences. A higher density of bus stops would mean a higher access percentage. For e.g., in the area clicked above, 96% of the people in the area live within 500m of a bus stop.
- Trips is the number of trips or the number of times buses stop at all the stops in the area under consideration. This would be the sum of all the trips of all the routes that pass through the booth area.
- People per trip is the number of people in the booth area divided by the number of trips rounded up to the nearest integer. A smaller number means good frequency of buses. A larger number means less frequency of buses. In the example above, the number of people is 1650 and number of trips is 57, which yields a people per trip value of 28.947 which is rounded up to 29 people per trip.
Booth areas that encompass arterial roads like the outer-ring road will tend to have a higher frequency of buses and a very small people per trip value, while those areas farther away from arterial roads will have larger people per trip values. - Routes. This is the list of all the bus route numbers that pass through the area. “Trips” is the sum of all the trips of all the routes.
- ward_id, ward_name, new_ward_id and new_ward_name are, respectively, the previous ward number and name (with 198 total wards), and the latest delimited ward number and name (with 243 wards).
- Locality is the name of the locality.
Each “pin” in the map is a bus stop, and clicking on it brings up information about the stop. Each bus stop has the following information.
- “stop”. The name of the bus stop. In this case, “Vidyaniketan Public School Manganahalli”.
- Routes. All the buses that pass through the stop and number of trips per day. For e.g. route no. 234-C makes 22 trips in a day. Some of the routes are contract routes, like ‘BSK-VPS’ which is a route contracted to Vidyaniketan Public School.
- Trips is the total number of trips of all the routes.
All the bus stops data have also been saved as a csv for easier reference and analysis. The data can be found here. There are close to 3000 rows in the file and each row includes the information above about the bus stops along with the latitude, longitude and the boothcode of the area to which the stop belongs.