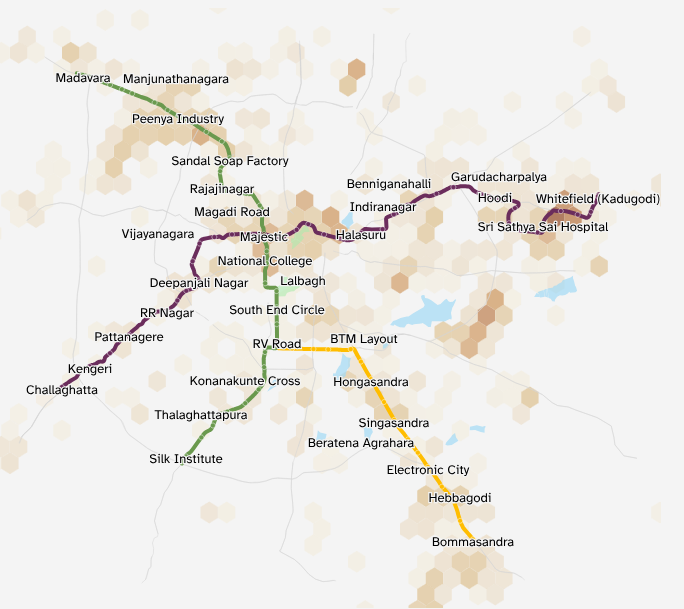
The Bengaluru Metro Rail Corporation (BMRC) provides daily ridership data on their website. However, finer grain data about ridership at specific stations, and usage during specific hours is not available on their site.
Vivek Mathew and Aman Bhargava of diagramchasing.fun tried to get this data by filing an RTI. The response received gave them hour-by-hour, station-wise data for the first 18 days of August. August also happened to be the month the Yellow Line had become active so it was interesting to see what the data showed.
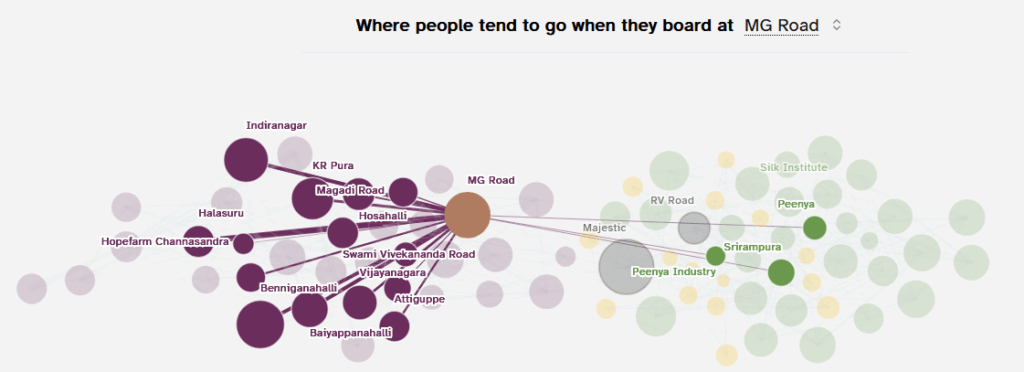
Based on this data, they have developed a project where you can check how different stations compare in terms of the number of people they serve as well as in the form of source-destination pairs, and the timing of their travel.
What you’ll find will surprise you! For instance, while the Mysore Road parking becomes full very early each day even for two-wheelers, more people commute through Vijayanagar which has little dedicated parking around it.
Browse the site for more insights on how people in Bengaluru commute through the Metro.
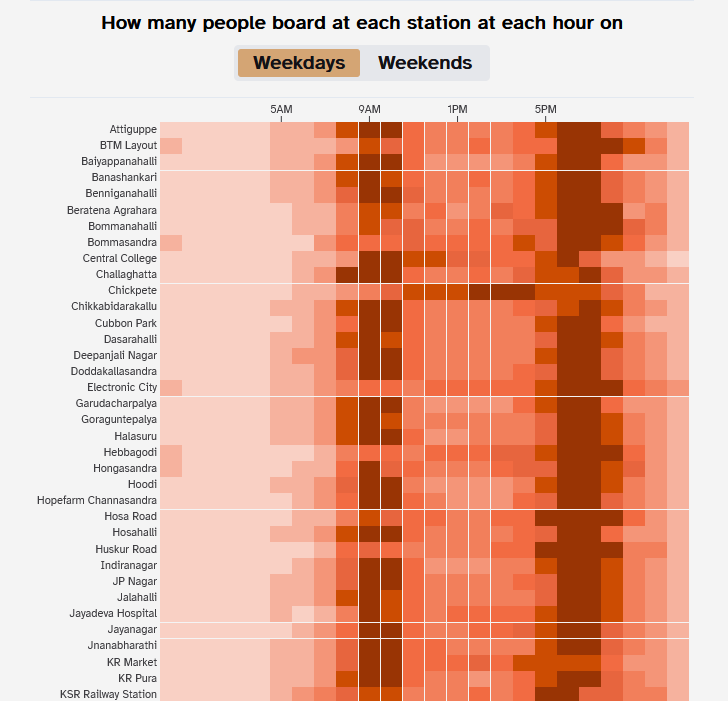
Ridership data at station level is important for not only academic purposes but to be able to plan interventions like last-mile connectivity around the stations. For instance, with better understanding of people’s travel patterns, including when they travel more, feeder buses can be targeted for the timing and the local destinations.
In stations where the usage is less than expected, we need to ask why fewer people are using the metro at those stations and what can be done to improve the usage there.
Chennai Metro already has this daily data shown on their site and other cities should make this data easily available on their sites instead of needing RTIs.
Vivek and Aman have kindly made the raw data public and it can be accessed here.