The Bellandur area and ward is synonymous with the IT boom in Bengaluru over the last 20 years and in many ways it represents a microcosm of how the city has evolved in the first quarter of the 21st Century. Large glass buildings housing IT companies sit alongside unplanned apartment constructions and gated communities which look like they have been uprooted from a different country.
Nestled amongst all these new developments are the older villages of the city that have refused to go away, smaller lakes that are increasingly at threat and are scenes of activism, and the most famous of them all, the foaming, and at times burning, Bellandur lake which sits hidden in the corner behind all the vertical constructions. The Outer Ring Road and Sarjapura Road, some of the busiest roads in the city cut right through this ward.
Ward Profile as per the 2011 census:
| Ward No | 150 |
| Ward Name | Bellandur |
| Assembly Constituency | Mahadevapura |
| Population | 80180 |
| Male | 44031 |
| Female | 36149 |
| SC Population | 9060 |
| ST Population | 1844 |
Urban Heat Profile
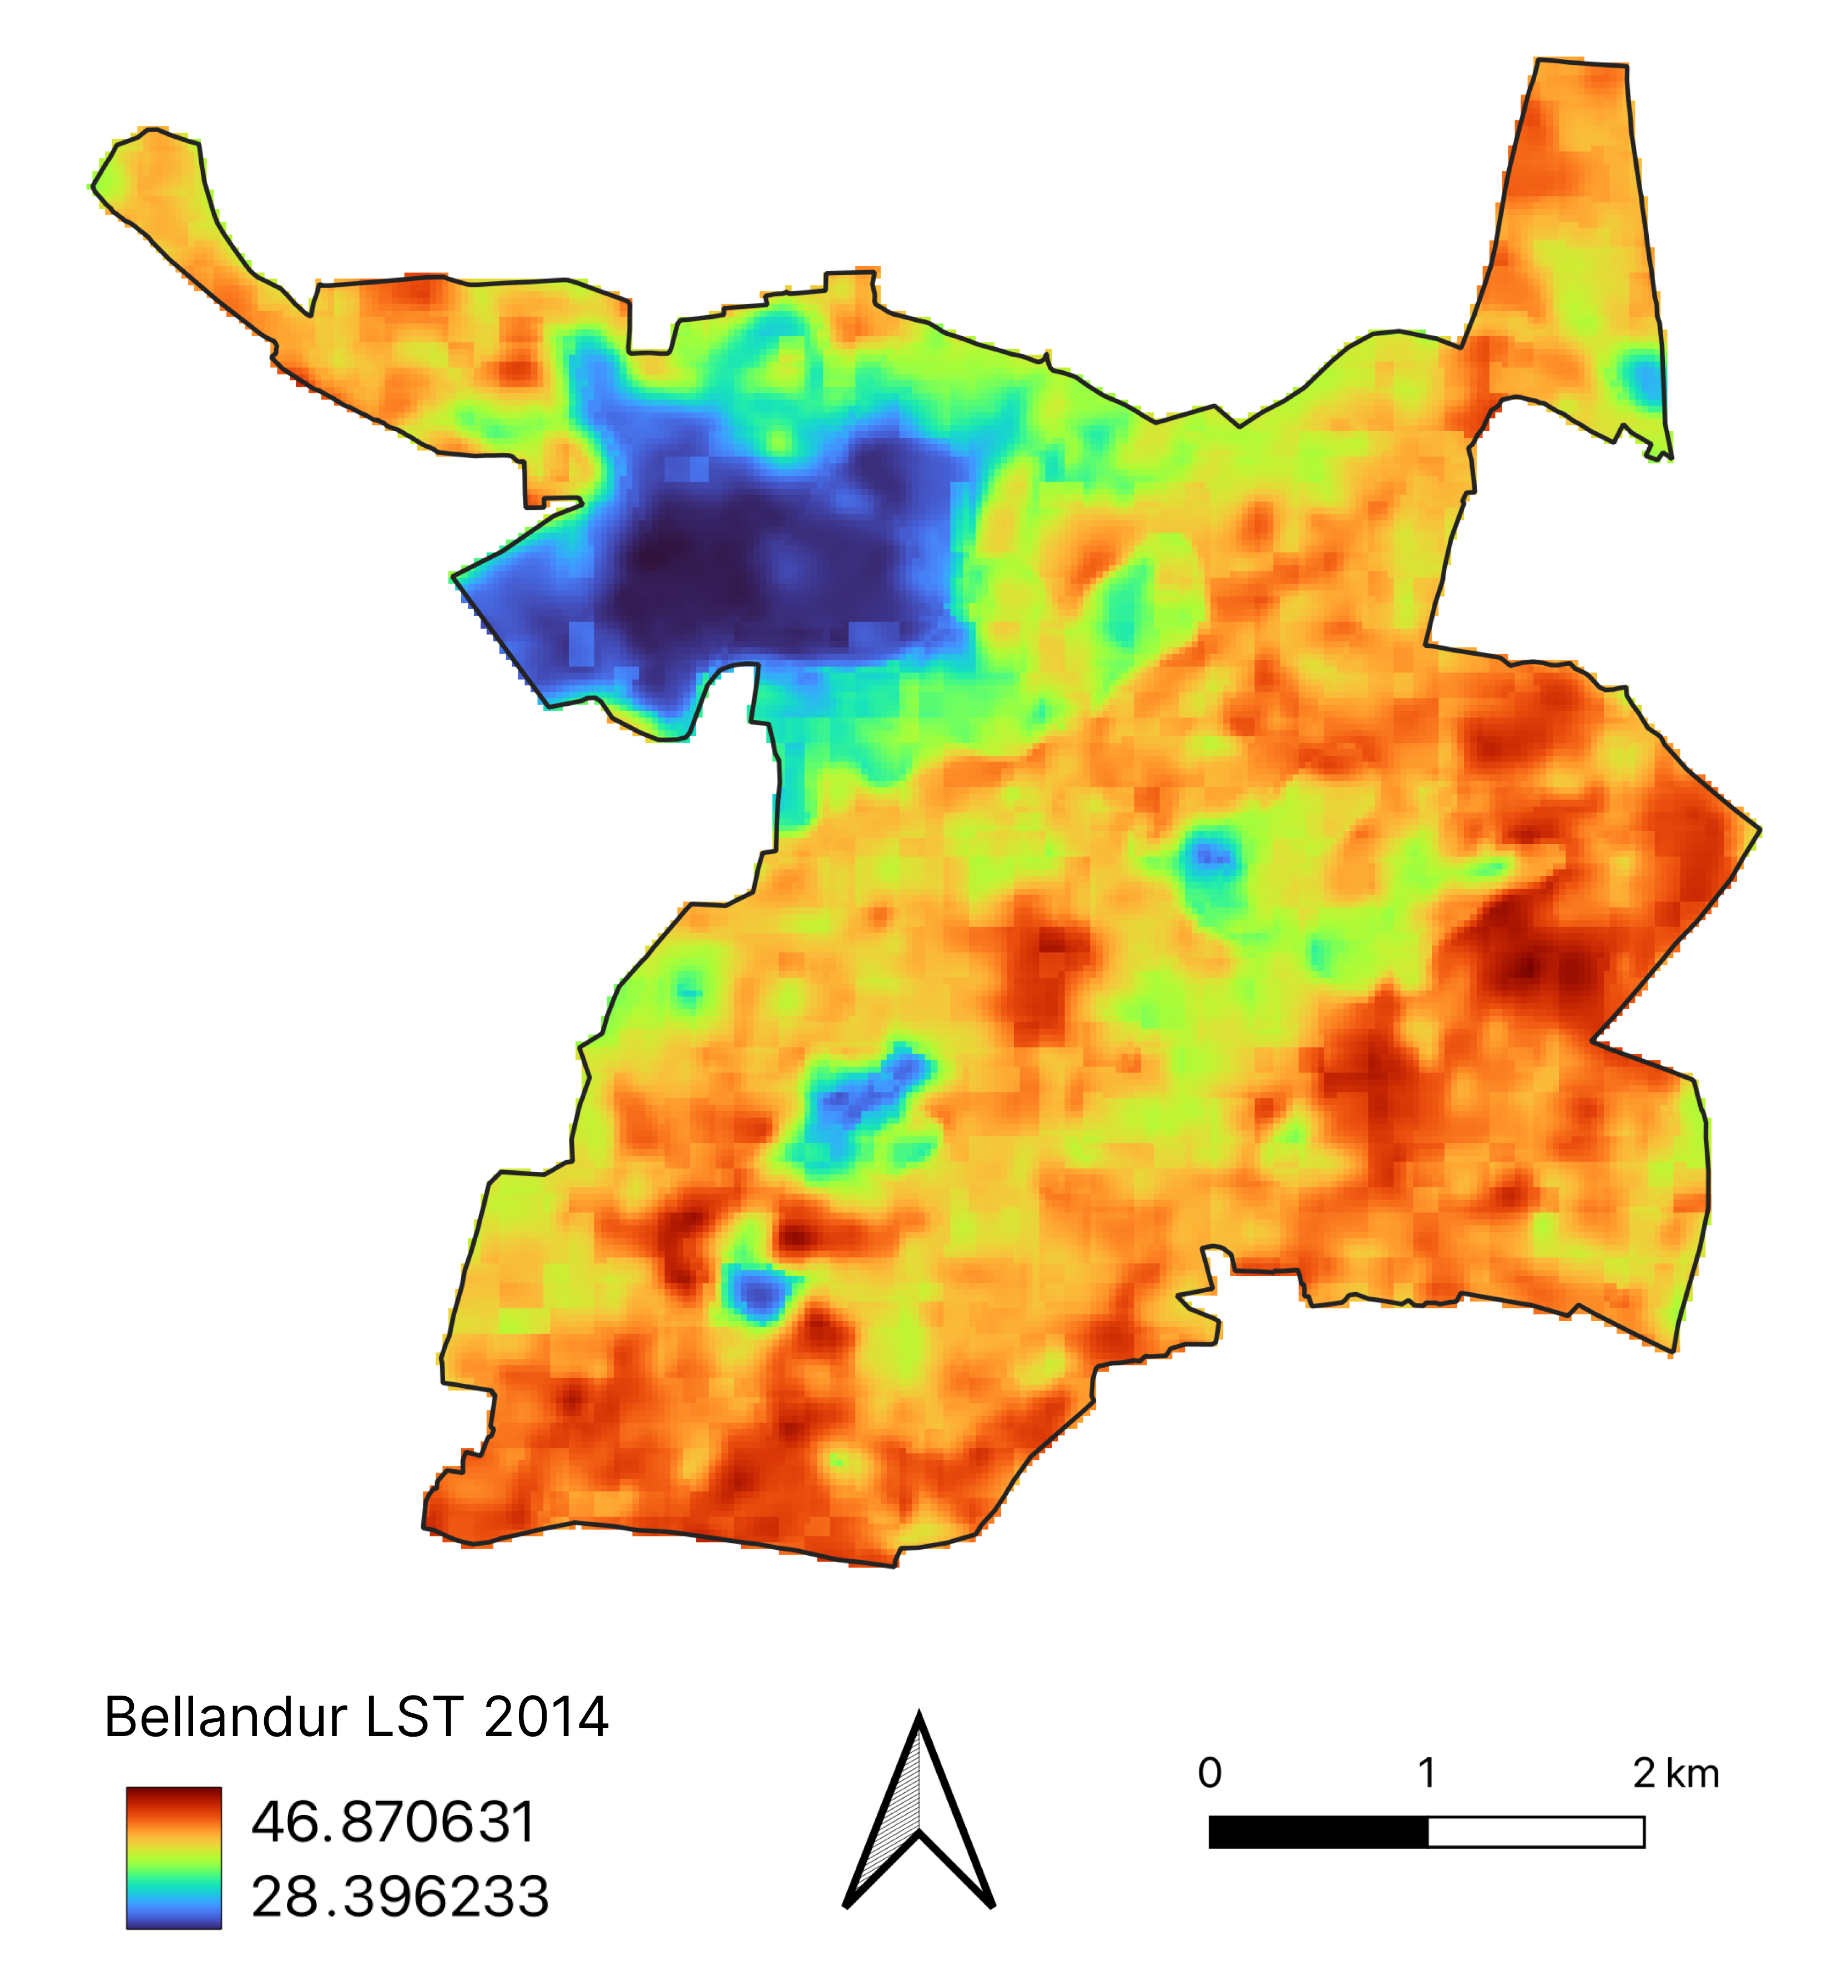
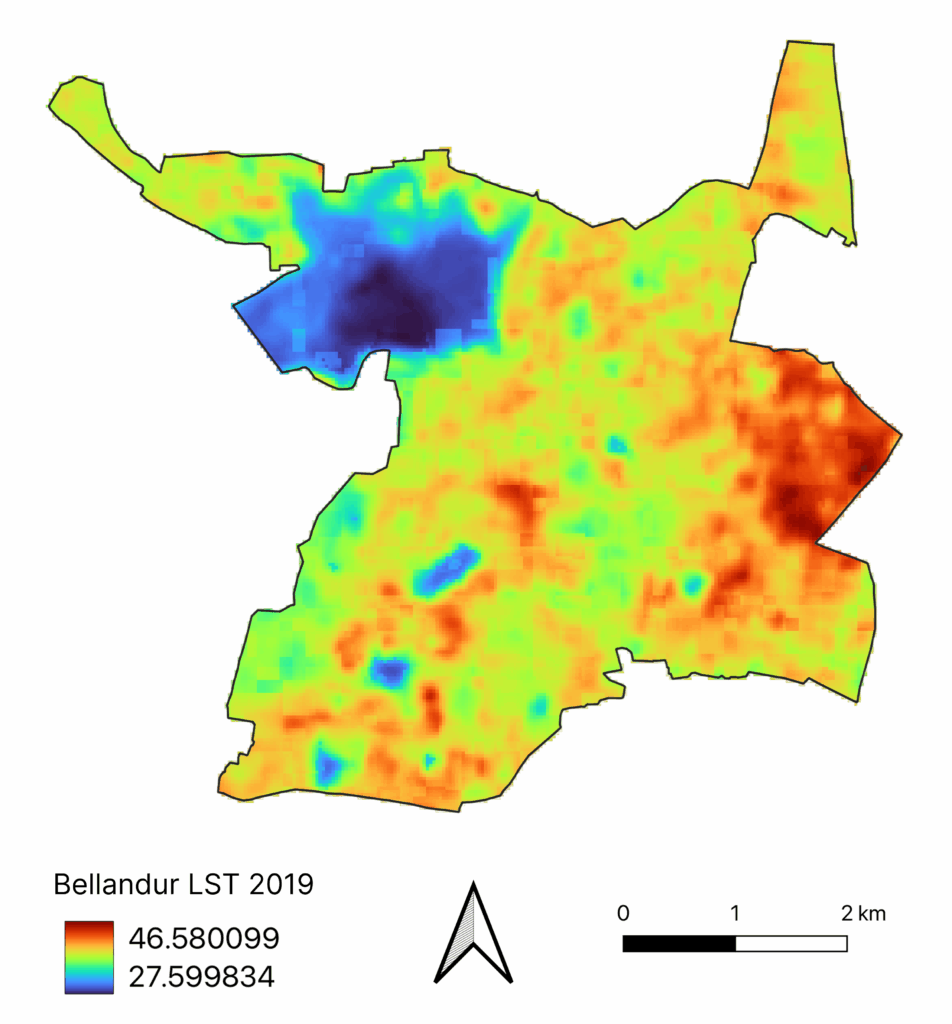
Bellandur has seen a lot of changes in the last 20 years growing from what used to be villages far from the city to the IT hub that it is today. To analyse how heat impacts different parts of Bellandur we looked at Land Surface Temperature(LST) data for April which is the hottest month in Bengaluru. To understand how the situation has changed over the decade, we looked at this thermal map for the last ten years at five year intervals – 2014, 2019 and 2024.
Change over the last 10 years:
Satellite imagery from Google Earth over the past 10 years shows that a lot of open spaces have been built up. This is especially true of the southern parts of the ward, areas around Haralur and Kasavanahalli.
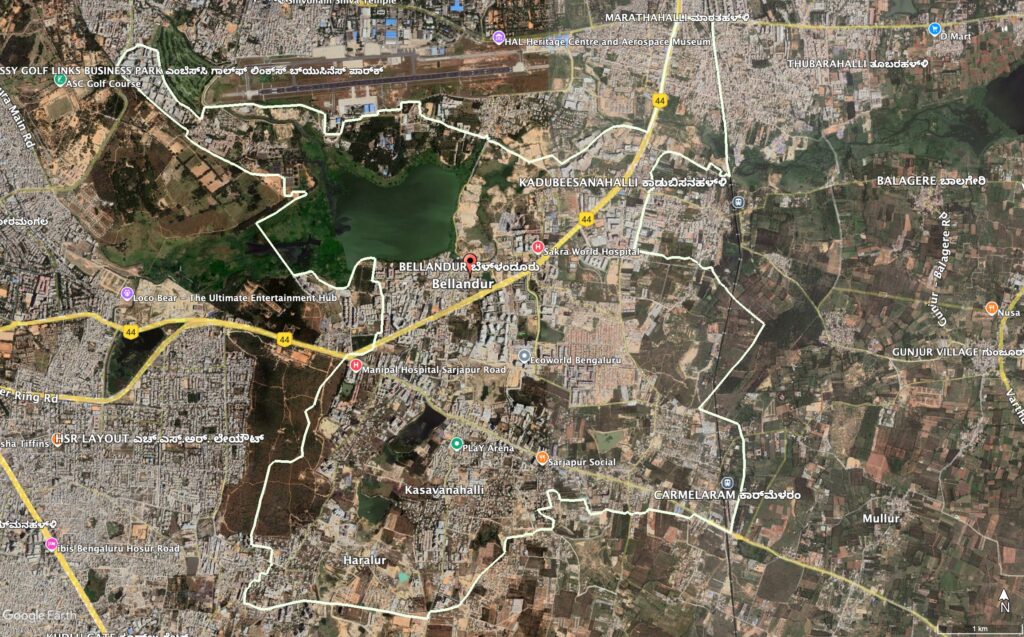
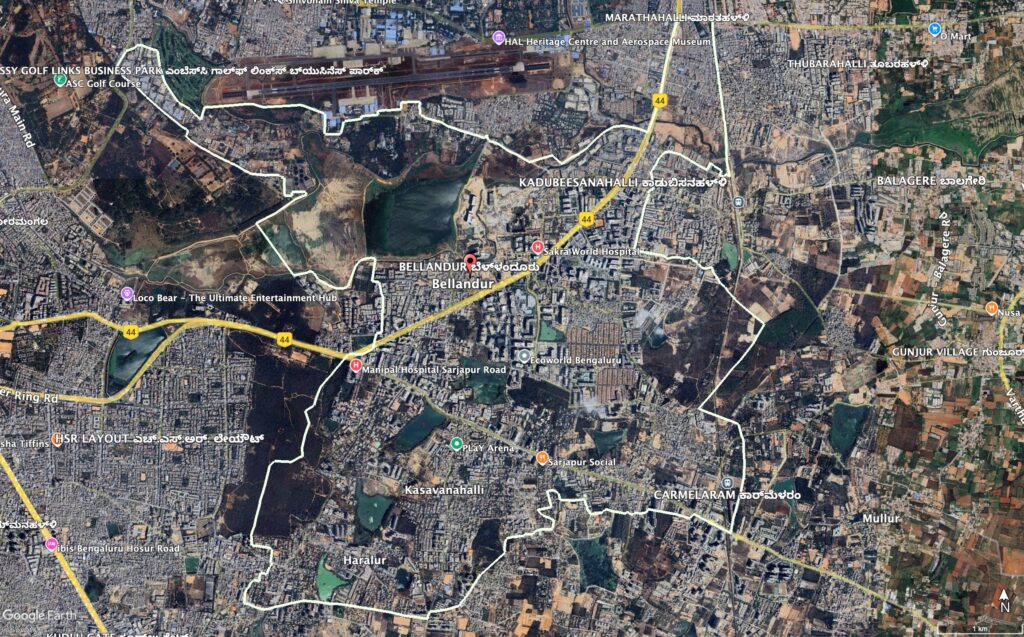
The Bellandur lake seems to have developed a dry patch that over the years has become devoid of greenery. Saul Kere behind Ecospace, on the contrary was mostly a dry ground in 2014 and has since become filled with water in 2024. Areas in the East of the ward, Panathur and Boganahalli had significant open spaces which have either been constructed upon or have developed green covers, but not covering the area completely. How do these different changes affect the heat in the ward?
Land Surface Temperature changes over the decade
The LST data from 2024 shows that the land next to Bellandur lake, Bhoganahalli-Panathur area are the main hotspots in the ward. Interestingly Saul Kere used to be a hotspot in 2014 and 2019 as the lake was drier and it has now become a cool spot with water being held. It highlights the importance of not just waterbodies, but well maintained water bodies. While the main waterbody of Bellandur lake is cool, the areas around it, with no vegetation are hotspots with a difference of close to 20°C with the waterbody.
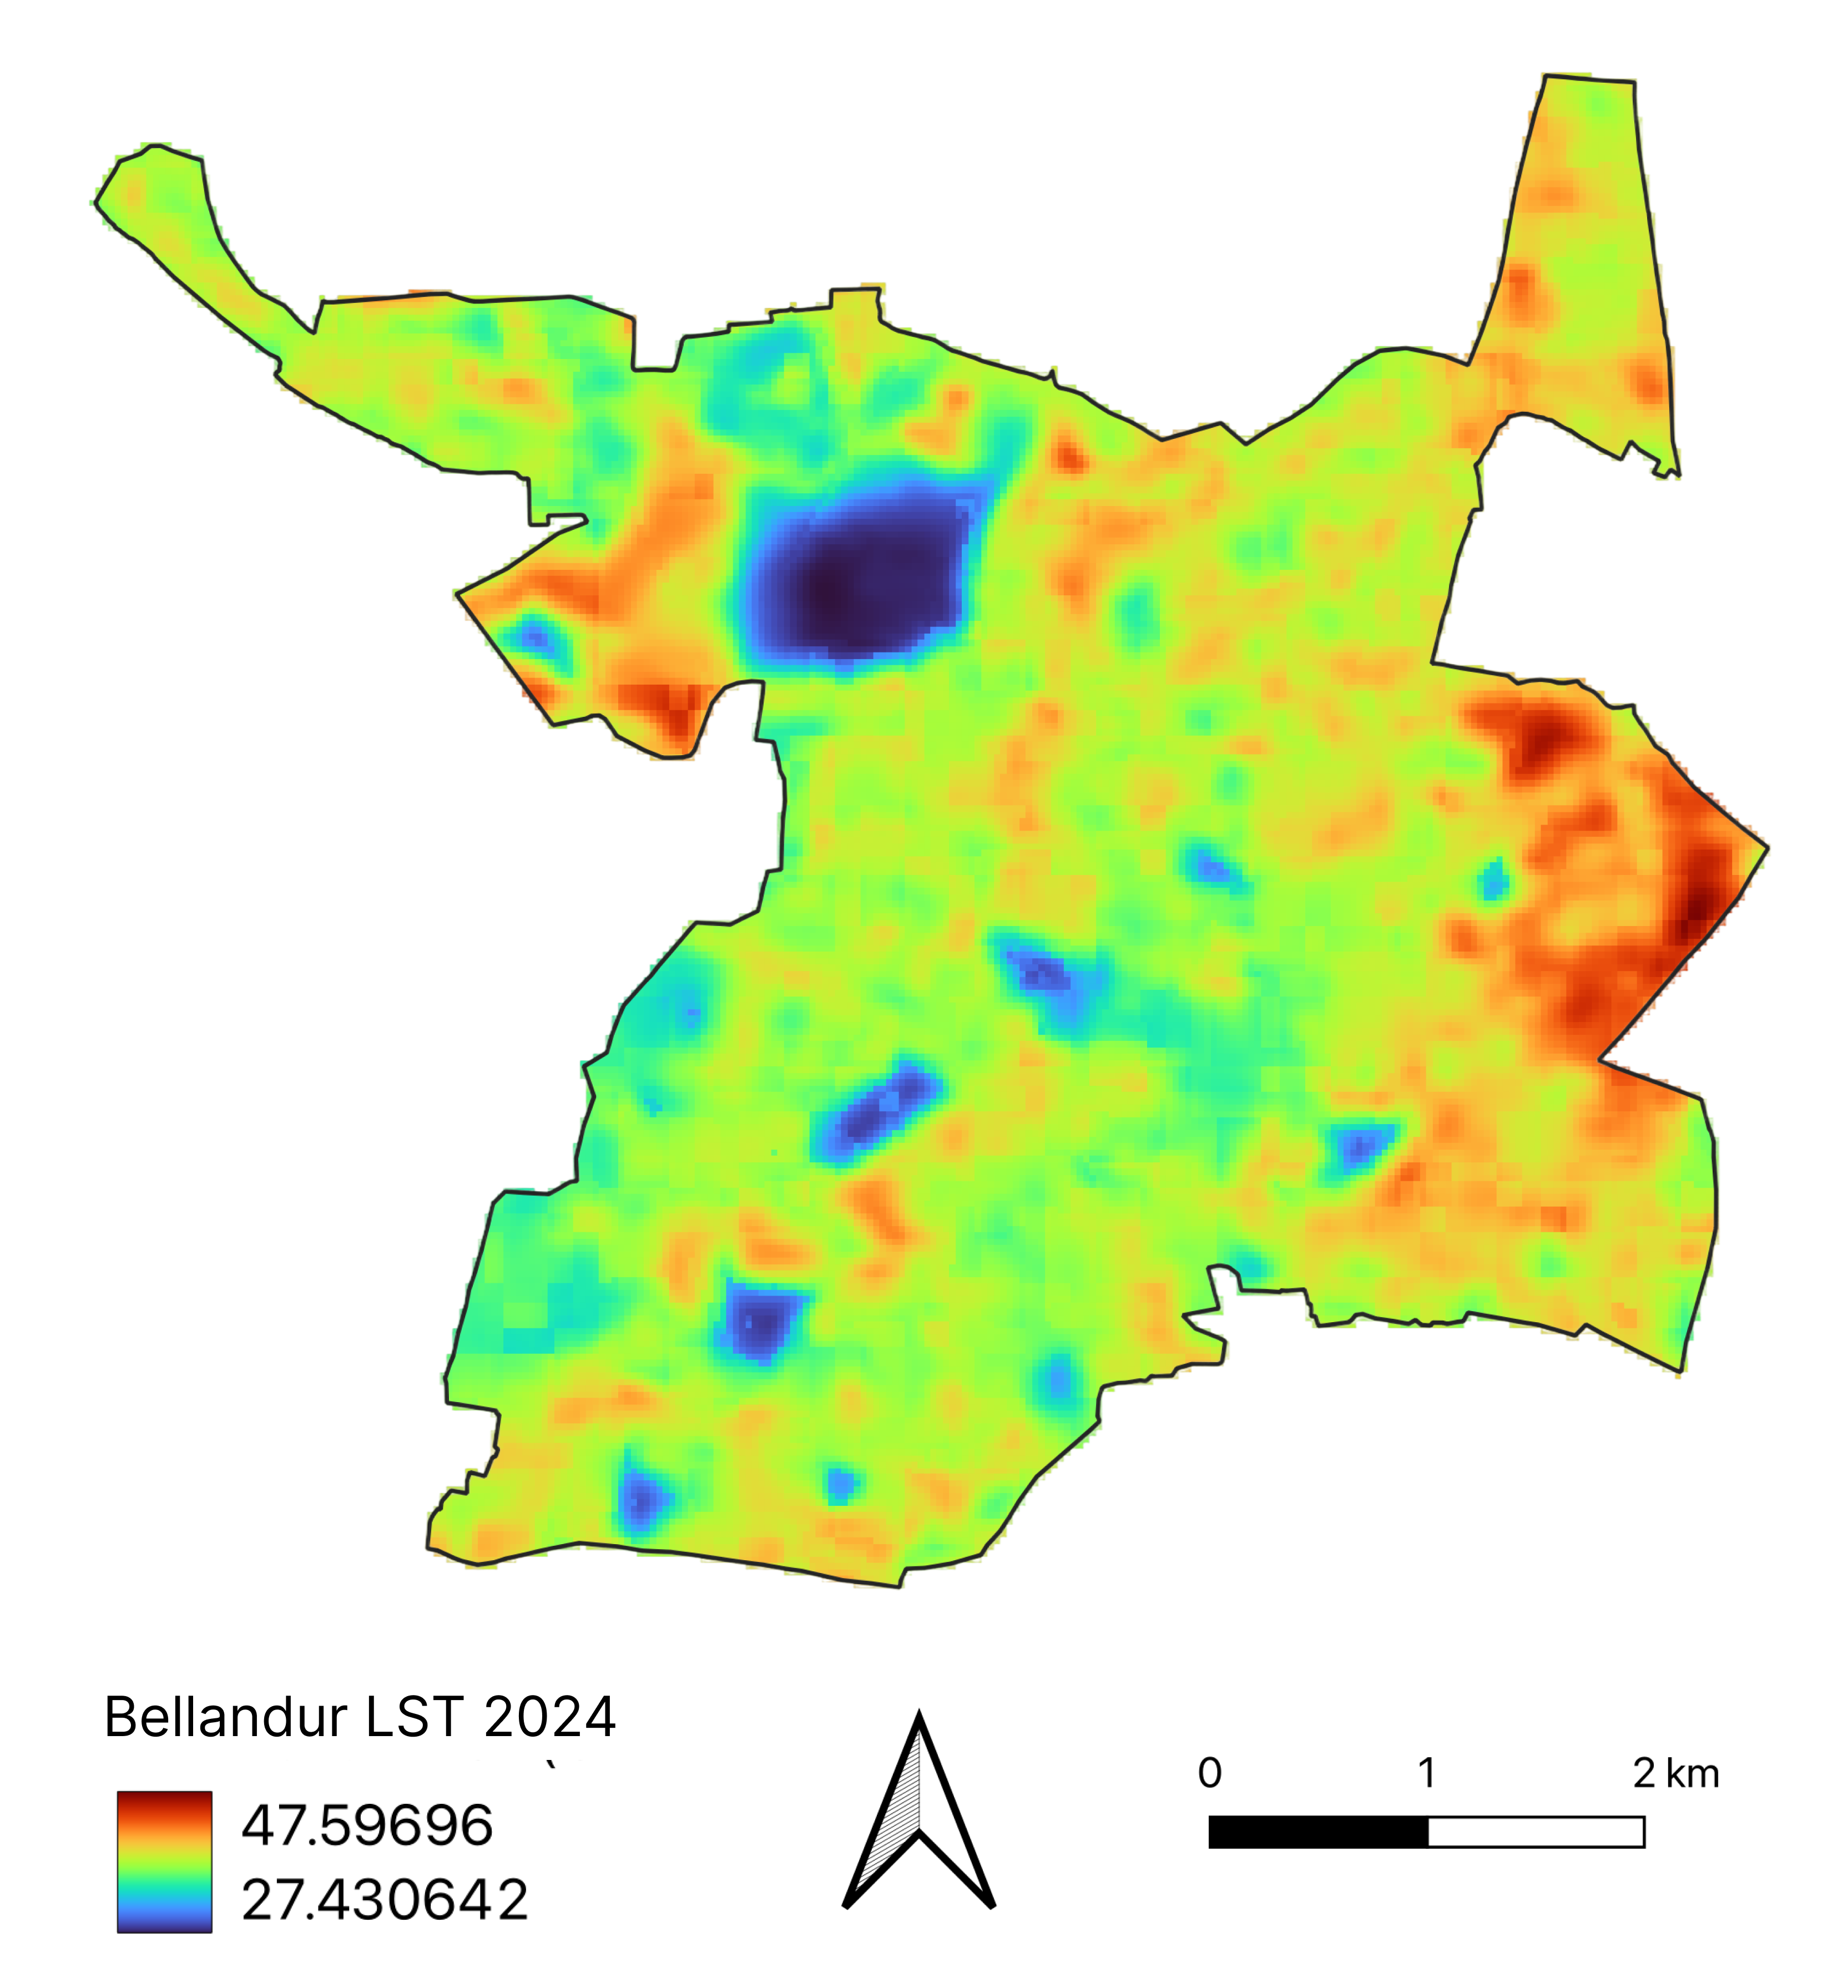
Heat impacts those who are economically and socially vulnerable. The older parts of the ward next to Adarsh Palm Retreats are seen to be hotter than their well-to-do neighbours.
Interestingly, as the southern parts of the ward close to Kasavanahalli and Haralur have become built up, it has made the areas cooler. In general, the ward has seen a cooling up on average as open areas have been built upon. This is expected as open areas tend to be hotter during the day time compared to built-up areas, especially with concrete buildings, where there is shade from buildings.
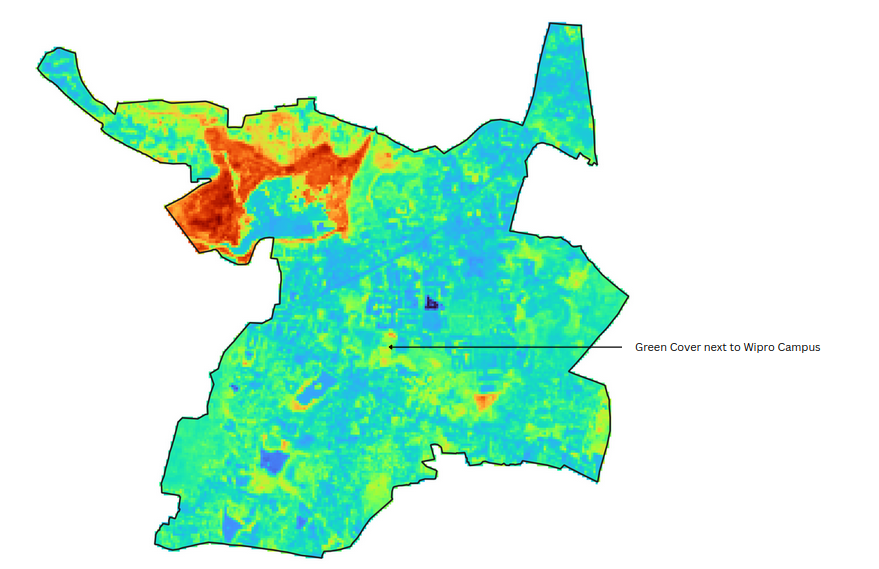
Change in Vegetation over the years:
Over the past decade, the vegetation in the ward has been going down drastically. Interestingly, the vegetation has gone up around Bellandur lake, but this has come at the cost of the waterbody, but this is mostly in the form of shrubs and not tree growth.
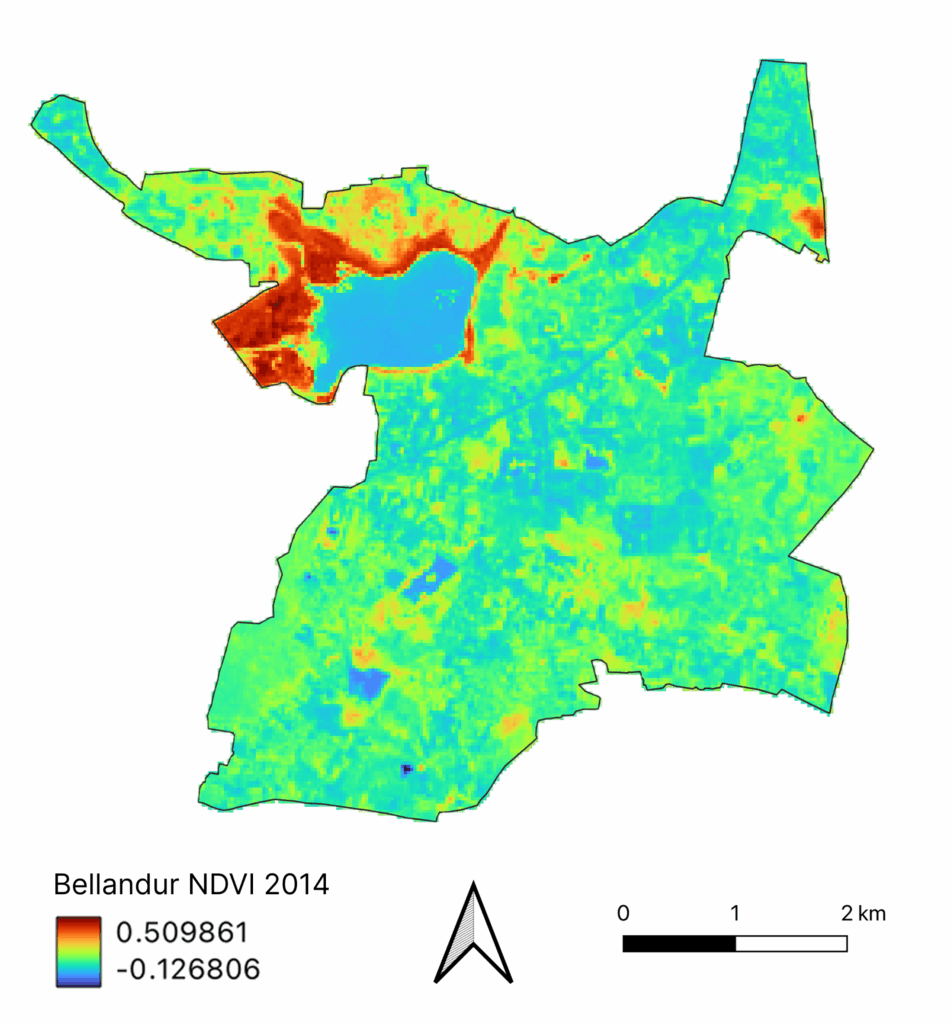
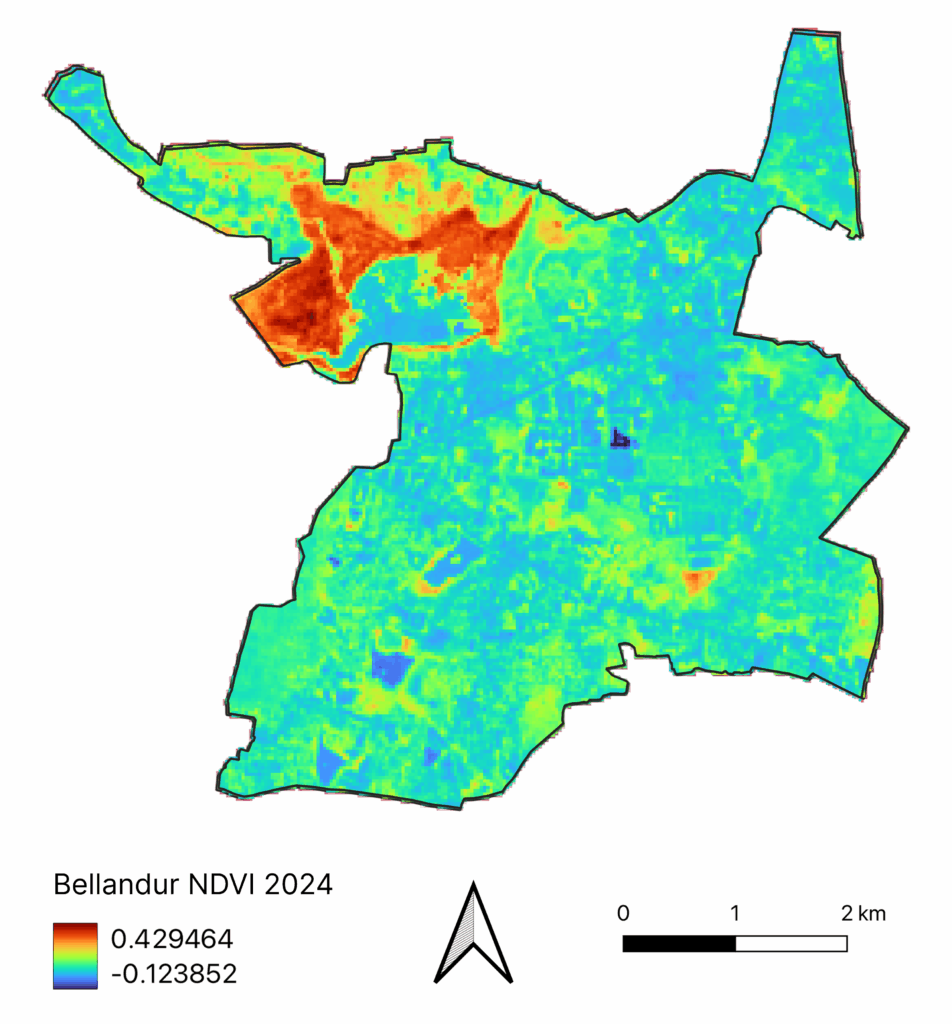
Open areas influence heat differently based on green cover. The difference in how vegetation works can be seen through two examples – the exposed parts of Bellandur lake which are bald patches with no trees, and the tree covered parts of the Wipro campus next to Saul Kere. While open areas like the former are the hottest parts of the city, the tree-covered parts are the among the coolest parts of the ward, next only to waterbodies.
Change in built-up area over the years:
As anyone who knows Bengaluru would expect, the built-up area across the city has only been going up, and Bellandur is no exception. In fact, one could argue that it has led the change in the city.
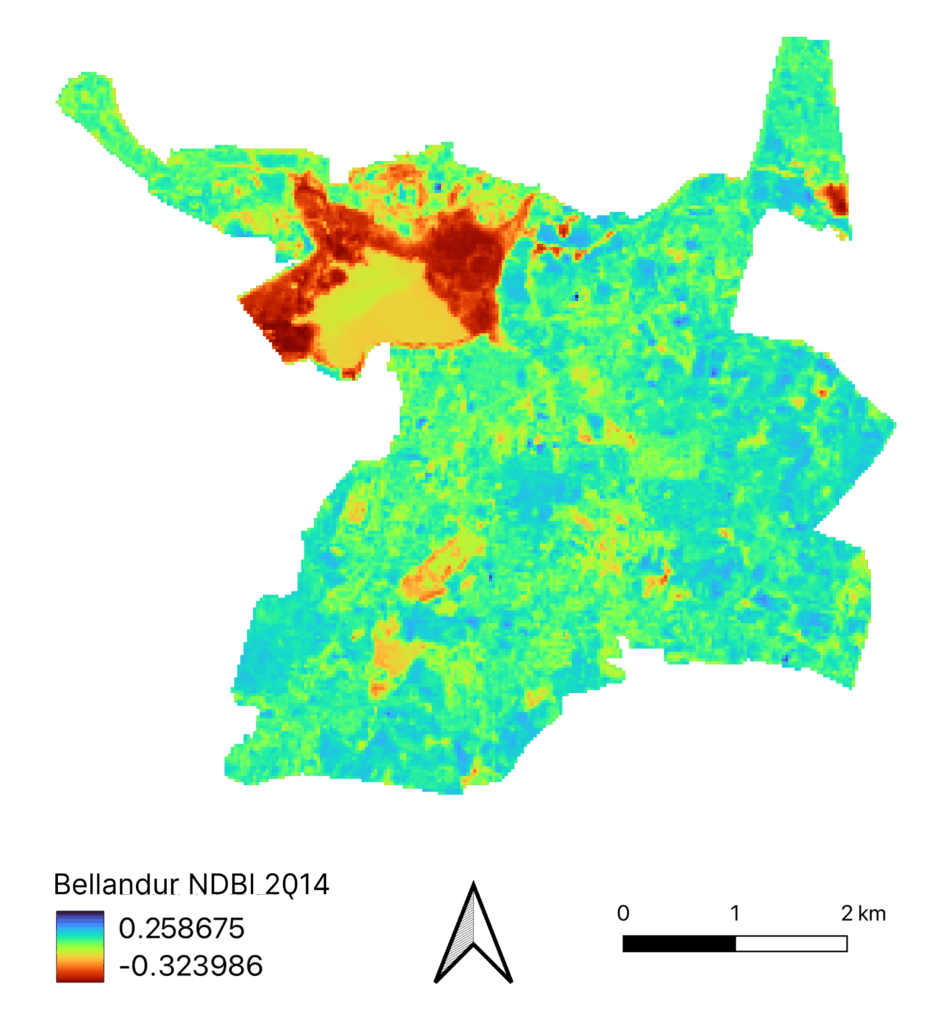

Except for the lakes and the open areas in the East, the rest of the ward has seen complete real estate development. This increase has come at the cost of green cover.
Existing built-up areas have become more built-up as can be seen in the darker blue in most areas. The red areas which were least built-up have reduced considerably in the last 10 years.
Summary
Heat data for Bellandur reveals some interesting trends. While lakes and tree-covered areas function as cool areas, cooler than 10°C compared to the surroundings, open areas are seen to be much hotter than the surroundings, by a similar 10°C.
The ward suffers from a lack of green cover. The ward has no BBMP or other parks in the ward leaving only the lakes as green options. The green cover has depleted rapidly in the past 10 years as built-up area has gone up. The ORR and Sarjapur Road can be traced in the NDVI map as severely lacking green cover.
The presence of the lakes in the ward is also lopsided, restricted to the North-West and Southern parts of the ward. The areas circumscribed by Sarjapur Road and ORR have few options in terms of access to mitigation except Saul Kere and Devarabeesanahalli lake which are surrounded by SEZs and gated communities. Areas near Panathur which seem to be open areas can be developed as parks and green areas that people in the surroundings can access.
[This article was co-authored with Vaidya R]