Problem Statement
How has BBMP’s spending on different categories varied across assembly constituencies in the past 5 years?
Data Sources
BBMP’s work orders data for each of the 198 wards from OpenCity.in was the main source of data. Each work order includes details about start and end date of the project, a description of the project, gross amount, deduction (taxes), and final net expenditure. For the purposes of this analysis we are considering only the gross data.
Methodology
The BBMP’s planned spendings are classified into the following categories based on the description given in each work order.
- Buildings and infrastructure
- Drainage
- Roads
- Roads and drains
- Surveillance
- Street Lighting
- Waste management
- Water and sanitation
We considered the work orders from the year 2018 to 2023 for this analysis.
We attempted to classify the work orders by using two approaches – Natural language processing(NLP) based and a simple keyword based classification. We encountered challenges with the NLP based approach as there were a lot of typographical errors in the work order, so we decided to go with the keyword based approach for this analysis.
In this keyword based approach a work order is classified into a category based on the keywords in the work order description. For example, a work order having keywords both “road” and “drain” is classified under “Roads and drains”, whereas a work order having the keyword only “road” is classified under “Roads”. Similarly around 100+ keywords are identified and mapped to one of the above eight categories. The work orders which don’t fit into any of these eight categories were classified as ”others”. Again, given the number of typos present across the dataset, a lot of cleaning/spelling correction had to be done as part of preprocessing.
After the classification is done, the planned spendings were aggregated at ward level. The wards were then aggregated into assembly constituencies to get us constituency level planned spending for each of the eight categories.
Note: This analysis is based on work order data available on the BBMP site. It is not complete or comprehensive. There are likely to be discrepancies between work orders issued and actual payments. This analysis does not also indicate whether the work was done as per work order and when the payments were made and for how much.
Results
In the past five years, BBMP has issued Rs 23,241 crore worth of money through work orders, for an average of Rs 4650 crore per annum. Of this, Rs. 8,023 Crore was issued on functional department/non-ward projects – these are bulk projects which span across wards. The remaining Rs. 15,217 Cr was spent at ward level.
Disclaimer
The list of work orders does not seem to be complete. An average of Rs 4650 crore over the 5 years explains only part of the actual expenses. BBMP has mentioned actual payments of above Rs 6500 crores each year. Here are the amounts spent as mentioned in the subsequent years’ budget book.
- 2018-19: 7709.42 crores
- 2019-20: 6752.15 crores
- 2020-21: 7408.7 crores
- 2021-22: 7926.35 crores (Src: OpenCity.in )
The above gives us a budget estimate spending of Rs. 40,000 Crore for the five year period 2018-19 to 2022-23, as against the work orders amount of Rs. 23,241 crore.
From the data, individual work orders are issued for a maximum of 50 crores. It is not clear where the work orders of the big infrastructure projects like flyovers and underpasses are listed.
Functional/non-ward expenditure

- Of the Rs. 8,023 crore spent on functional work and non-ward orders, close to 50% (Rs. 3,938 Cr) was spent on storm-water drains, and 24% on roads and drains related work.
- Work orders issued for Major roads, saw a share of 10.7% (Rs. 858 Cr). Work orders for white-topping come under both “Roads and drains” and “Major Roads”.
- Together these heads make up 34.3% of the spend, or Rs. 2755 Cr. Rs. 441 Crore was spent on lakes in the past five years.
Ward-level expenditures
Within the work orders marked by a ward number (1-198 for old ward numbers since the time period being considered is before the delimitation of wards), this is what we found:
The amount issued at ward levels was Rs. 15217 Crore. The percentage of total amount issued for each category in the past five years is shown in the chart below. It can be seen that the largest share of the funds, close to half the total, was on roads. This was followed by drainage, and roads and drains. Together, roads and drainage work accounted for 74.3% of total spending.
Water and sanitation got 5.2%, while waste management, one of the most visible functions of BBMP, got only 1.1%.
Along with these three categories, waste management and water and sanitation are considered for further analysis as they are important for the welfare of people.
The percentage of the total spending in the past five years for each category is shown in the chart below. It can be seen from the chart that the largest share of the funds was spent on the following categories – roads, drainages, and roads and drains. Along with these three categories, waste management, and water and sanitation are considered for further analysis as they are important for the welfare of people.

The charts below show the spending under each category for all the 28 assembly constituencies.

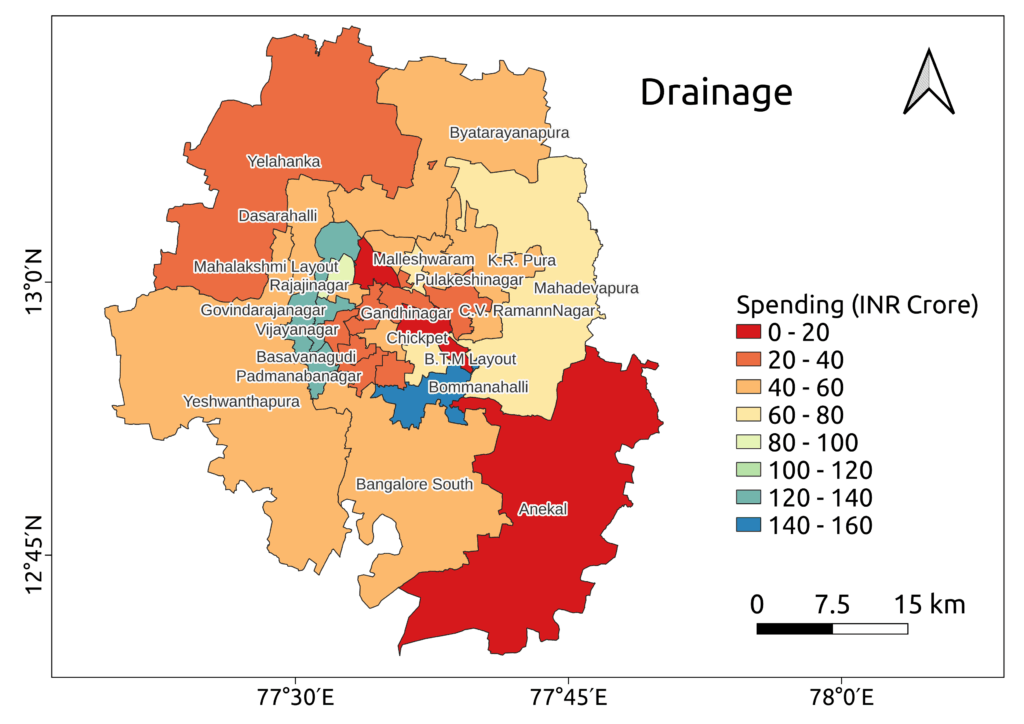
Drainage
The spending on drainage was highest in Bommanahalli, followed closely by Rajarajeshwari Nagar (RR Nagar), Govindaraj Nagar and Mahalakshmi Layout assembly constituencies. On the other hand, Anekal, Shantinagar, Malleswaram and Jayanagar are seen to have very little spending in this category.
It would be useful to see how much was spent in KR Pura and Mahadevapura constituencies which bore the brunt of flooding in 2022. A ward-level list indicates a low number. However one needs to look at the complete list of work orders and map them to actual works in the correct neighbourhoods to make sense of this. As can be seen from the first chart, storm-water drains accounted for close to Rs. 4,000 Cr at the non-ward expenditure level and it is hard to know which wards got those orders.
The map below shows the spending on drainage for all the 28 constituencies. It can be noted that the interior constituencies have relatively less spending compared to the ones at the periphery.
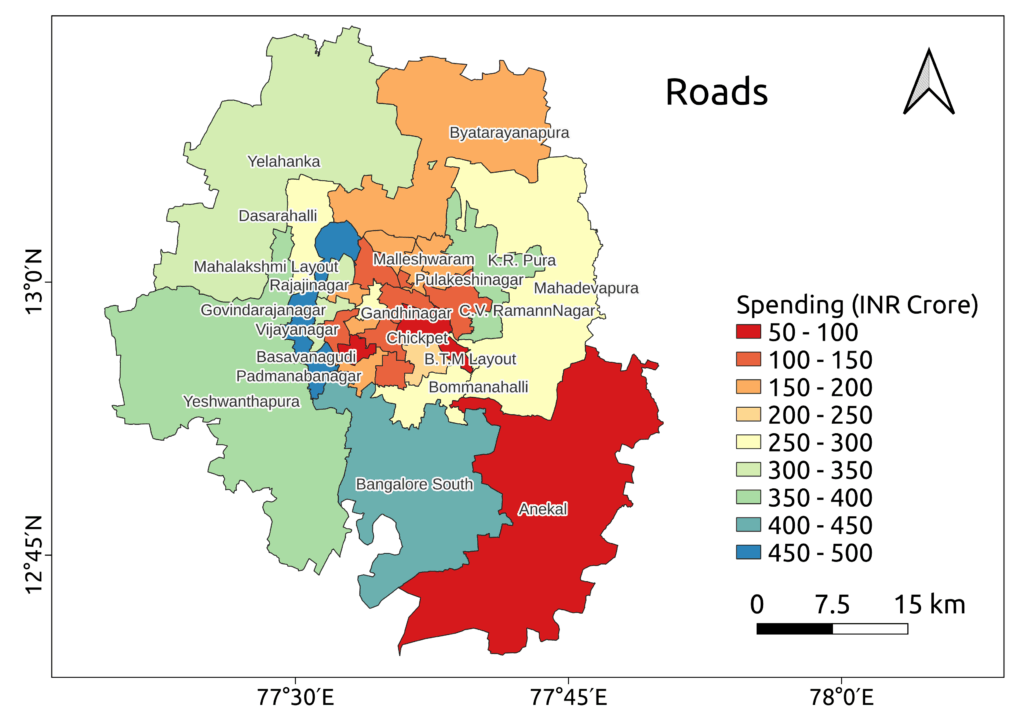
Roads
The expenditure on roads was highest in Rajarajeshwarinagar, Bangalore South, K.R. Pura, Yeshvantapura and Mahalakshmi Layout constituencies, while Basavanagudi, Anekal, Shantinagar and Malleswaram see the lowest spending. From the map below we can see that the most spending on roads happened in the peripheral constituencies, but there are some constituencies in the interior also that got a large chunk of funds for roads, like Mahalakshmi Layout and Govindarajanagar constituencies.
A similar disclaimer as to drains applies here. The spending on roads here includes mostly maintenance and laying of roads. White-topping is considered a non-ward work order and is mentioned in the earlier section.
Roads and Drains
Similar trends were observed for roads and drains.
- Yeshvanthapura, Bangalore South and K. R. Pura saw the most spending.
- Jayanagar, Gandhi Nagar, Basavanagudi and Vijayanagar saw the least.
- It can be seen from the map of expenditures below, that the most spending on roads and drains was again in constituencies located in the periphery of Bengaluru.

Waste Management
In the past five years, at the ward level BBMP spent a total of Rs 250 crore on solid waste management. While the spending in Yeshvanthapura constituency was very high, it was very low in the rest of the constituencies. Only Byatarayanapura seems to be marginally better than the rest. The map below shows the spatial distribution of spendings on waste management for the different assembly constituencies.
However, solid waste management got Rs. 877 Crores from the non-ward expenditure. Given that waste composters, processing units are not ward-level expenses, we need to factor this amount in when discussing the total expenditure on solid-waste-management.

Water and Sanitation
K.R.Pura got the most spending for water and sanitation work The spending in this category was poor in the rest of the constituencies. Among the rest, only Yeshwanthpura, Bangalore South, Byatarayanapura and Chamarajpet seem to have seen marginally better spending.
The spending in this category needs to be read carefully because less spending from BBMP on water and sanitation could mean either better BWSSB coverage in those areas, or poor water coverage from both needing BBMP to step in. More ground-level analysis is needed to get a better idea of these items.

Conclusions
It is observed that Yeshvanthapura, K. R. Pura, Rajarajeshwarinagar, Bangalore South and Govindaraj Nagar have relatively high total spending compared to the other assembly constituencies. It has to be mentioned that Yeshvanthapura and Bangalore South are one of the biggest assemblies in terms of area.
Govindaraj Nagar, despite being small in area, has seen a relatively larger amount being spent on its amenities when compared to both smaller constituencies like Basavanagudi or Shivajinagar and larger ones like Yelahanka, Byatarayanapura and Mahadevapura.
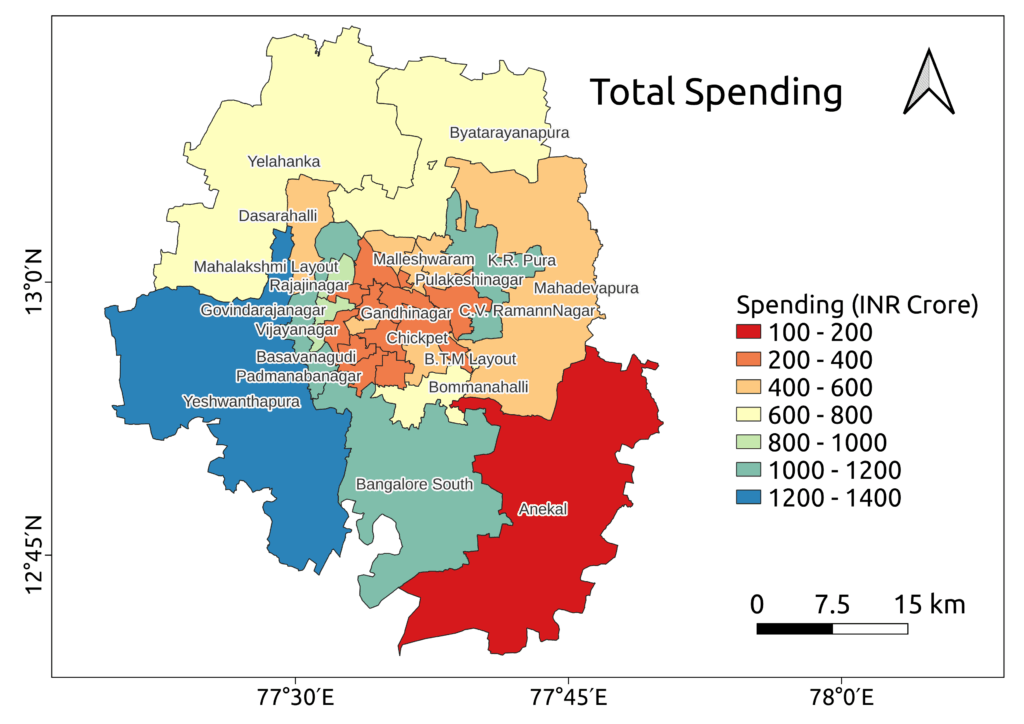
It can be seen in the above map that most of the assembly constituencies in the interior of Bengaluru had an average spending of Rs.200-400 crore in the last five years, while the constituencies at the periphery of the district got the most money. This may be due to a couple of reasons, one the city is growing and there is a need for development activities at the outskirts, two peripheral constituencies are much larger in area compared to the interior ones.
However, the spending in Yelahanka, Dasarahalli, Byatarayanapura and Mahadevapura isn’t comparable to that in Yeshwantpur or Bangalore South. This could be because large areas of these constituencies fall outside the BBMP jurisdiction, but that is true also of Yeshwanthpur and Bangalore South constituencies.
Despite being large in area Anekal has only ward in BBMP which explains the very low spending there. However, Basavanagudi, Shantinagar and Vijayanagar and other interior constituencies have seen the lowest spending in the past 5 years.
Further Analysis
Because of time constraints we were able to analyse the expenditure by considering all constituencies as equal. Given the vast differences in size and population across constituencies, this analysis can be further expanded by normalising for area as well as population.
To explore the entire dataset, click here and here.
We encourage analysts and citizens to verify the information. Use the job code mentioned in the works and find details of the work order in the BBMP Accounts website (‘Works Bill Public View’ page).
Authors
Thiyaku S. Thiyaku is an expert in remote sensing and GIS for agriculture and water resources. His work is usually around microwave data, image fusion and dashboard development. An open-source advocate, Thiyaku also works with QGIS, GRASS, Python, R and Geoserver.
Ayush Bhosle. Ayush Bhosle is a Data Scientist specializing in the ESG & Sustainability domain, currently working at a Financial Institution to enable its clients transition to NetZero through the development of sustainable investment strategies and innovative ESG solutions.