The International Institute of Population Studies (IIPS) released the National Family and Health Survey -5 reports for India, all states/UTs and districts. The reports are very comprehensive painting a detailed picture of the state of health, literacy, access to sanitation, sex ratio and other important parameters in the country as well as the states. The reports can be looked at for multiple important indicators, but we take a look at one key indicator to see how different districts in Karnataka are doing, and comparing that with the state as well as neighbouring Tamil Nadu.
What the NFHS-5 report says about access to sanitation?
Access to sanitation is an indicator in the NFHS-5 report, and it is measured as the percentage population living in households that use an improved sanitation system. The term “improved sanitation system” is defined as – “Flush to piped sewer system, flush to septic tank, flush to pit latrine, flush to don’t know where, ventilated improved pit (VIP)/biogas latrine, pit latrine with slab, twin pit/composting toilet, which is not shared with any other household. This indicator does not denote access to toilet facility.”
The World Health Organisation (WHO), however, defines an improved sanitation facility as “those that hygienically separate human waste from human contact. Improved sanitation includes flush or pour-flush to piped sewer system, septic tank pit latrines, ventilated-improved pit latrines, or pit latrines with slab or composting toilets. Shared or public-use sanitation facilities are not considered to be improved. Also, flush or pour-flush to elsewhere, pit latrines without slabs or open pits, bucket latrines, hanging latrines or open defecation are not considered to be improved sanitation.“(emphasis added)
As the NFHS notes, not having access to an improved facility need not mean open defecation. It could be one of those not included in the list above. However, access to such improved sanitation is an indicator of the level of development in the district in terms of sanitation coverage from public utilities and most importantly, also indicates the conditions in which people in the district are living.
At state level, Karnataka records 84.4% of the Urban population and 68.5% of the rural population as having access to improved sanitation facilities. This is better than the national average of 81.5% for urban and 64.9% for rural.

Karnataka seems to be on par with its neighbours Tamil Nadu, Andhra, Telangana and Maharashtra. States like Uttar Pradesh, Madhya Pradesh, West Bengal and Odisha seem to be lagging behind the 70% mark, while Bihar and Ladakh are under 50%.
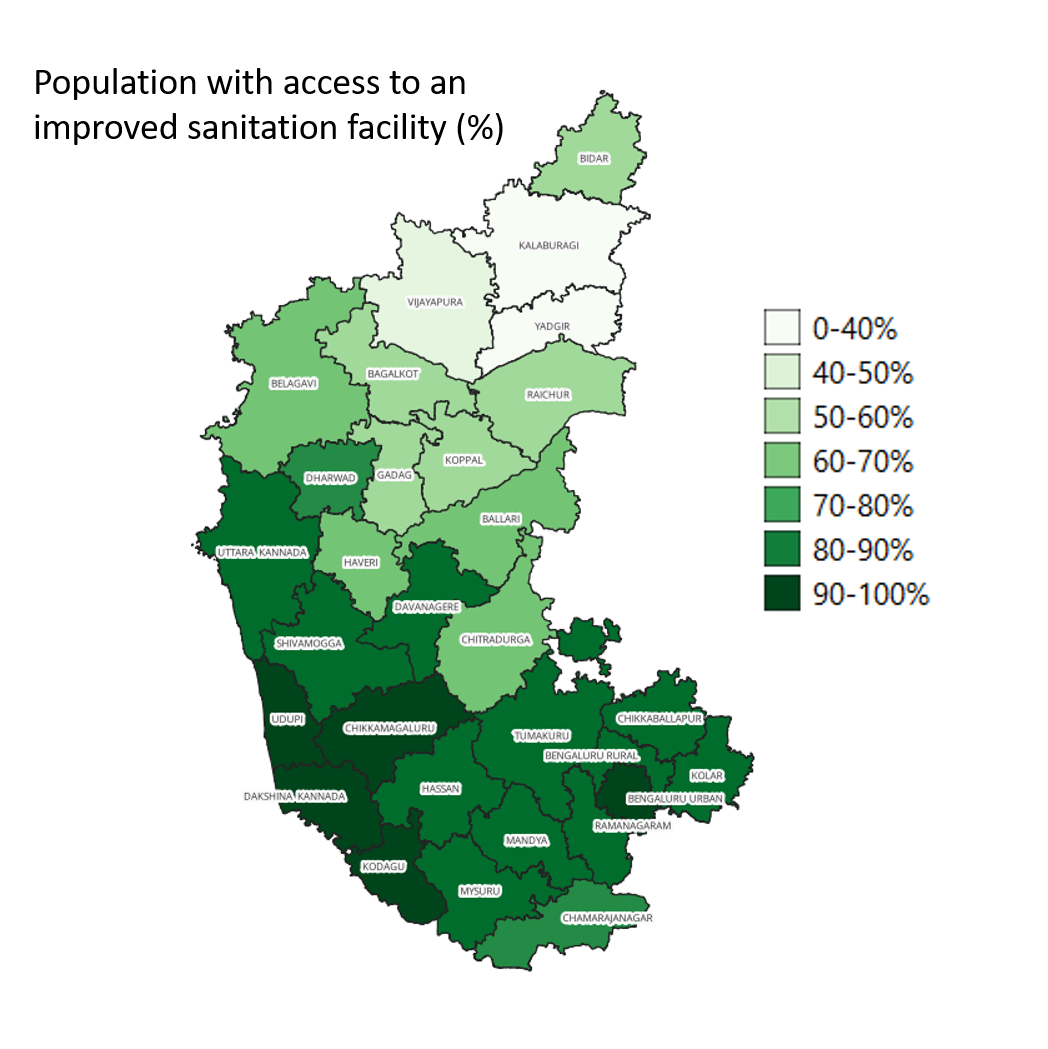
However, Karnataka’s development indices tend to be skewed towards the southern and coastal districts, with those in the Northern parts, especially the Kalyana Karnataka districts, lagging badly behind. In the case of access to sanitation, that continues to be the case.

Districts like Yadgir and Kalaburgi are worse off than even Bihar with less than 40% of the population having access to good sanitation facilities. Vijayapura is only marginally better, but less than 50% in the district have access to good sanitation. The situation is much improved closer to Bengaluru and the coastal districts.
Comparing with the neighbouring Tamil Nadu illustrates how heavily development is skewed in Karnataka. At the state level Tamil Nadu records that 82.8% of the urban population and 63.3% of the rural population have access to good sanitation facilities. This is marginally worse than Karnataka’s 84.4% and 68.5% for urban and rural.
However, a closer look at the district level paints a different picture.

While only Chennai and Kanniyakumari districts boast of a coverage greater than 90%, 19 of the 38 districts fall in the 70-80% coverage category. None of the districts are under 50%.
This skew in development in Karnataka follows most other indices. For instance, in the case of average per-capita income, the Northern districts fall much farther behind when compared to Bengaluru’s surroundings and the coastal districts. In fact, the skew is much larger when it comes to income, where only four districts have a per-capita annual income greater than the state average of 2.25L. In comparison, Tamil Nadu has 10 of its 38 districts above Rs. 2.25 Lakhs.

As much as Karnataka has been performing above the national average when it comes to social, health and economic indicators, what the data shows is that this development is skewed towards the southern and western parts of the state, while the poorly developed Kalyana Karnataka region continues to lag behind. As much as development in this region continues to get lip service from the powers that be, Kalyana Karnataka continues to wait for its true Kalyana.
You can find the detailed NFHS-5 reports for all the states along with data in csv formats for most states and major cities here.