
Three months ago, Oorvani Foundation and CivicDataLab embarked on a collaborative journey to redesign OpenCity, an urban data portal visited by over 50,000 unique users every month. We set out to learn about our users, their experiences on the platform and their dreams for the future of this city based open data hub. An important part of our research is to understand data provided by Google Analytics. Let’s first meet Client. No. 1931, our top user.
Meet Client No. 1931: Our top user
His first visit to the platform was on April 21, 2018. In the next 21 months, Client No. 1931 visited OpenCity 914 times, and spent nearly 89 hours on the platform. He’s definitely someone with a wide interest in the city of Bangalore, confirmed by his frequent visits to city based pages on ward maps, street maps, election results, traffic signals etc. Occasionally, he’d visit Chennai Corporation maps as well. He was last seen on January 12, 2020. Has OpenCity lost it’s top user? To answer the question, we have to understand how Google Analytics works.
What is Google Analytics and how does it work?
Are we alone as we traverse through the vastness of the internet? No. We are followed around by benignly named, yet predatory cookies that store information about us and our activity. Google Analytics uses cookies (and other techniques) to identify and understand us better through our online behaviour. That’s how they are able to tell us that between May 16 and June 15 of this year, 73% of all users of OpenCity were male. It’s also how Google is able to tell us what percentage of users love cooking, and how many are travel buffs. Client No. 1931 had a cookie in his computer that recorded information about his visits to OpenCity diligently for two years. On January 12, 2020, the user disappeared. Did he abandon OpenCity?
Cookies are linked to a “browser-device” combo. If you use multiple browsers on your desktop, each combination of browser and desktop has a separate cookie. Client No. 1931 used a single browser+desktop combo for nearly 21 months. His disappearance can be explained by a variety of reasons, none of which can be conclusively identified.
- Cleared browser history and cookies
- Changed Desktop
- Abandoned OpenCity
Are you feeling queasy about the information collected by Google? It’s not unusual. The debate around Google’s web-traffic monitoring practices and its implications for privacy is an important one. What are the options available for not-for-profit, open source data platforms like OpenCity to move away from a freely available analytics platform, to a costlier, but more ethical web analytics service? For now, rest assured that no personally identifiable information is provided to OpenCity by Google Analytics.
OpenCity – Performance
“With this collaboration between OpenCity, Tech4dev and CivicDataLab, we envisage to make the platform more accessible and effectively increase the advocacy efforts. We plan to create city level pages detailing high-level statistics and analytics to drive more research from the platform. With these changes and via few workshops and working sessions with data collaborators, we aim to improve the citizen uptake, usage and contribution to the platform”
From the Project Plan document agreed between CivicDataLab, Oorvani Foundation and Tech4Dev, it’s clear that the intention of this project is to increase usage by citizens. To do that, we should understand the current usage patterns. We looked at analytics data for two financial years, 2018-19 and 2019-20 to better understand how the platform has been performing.
Number of Users and Duration of Usage
The insights were concerning.
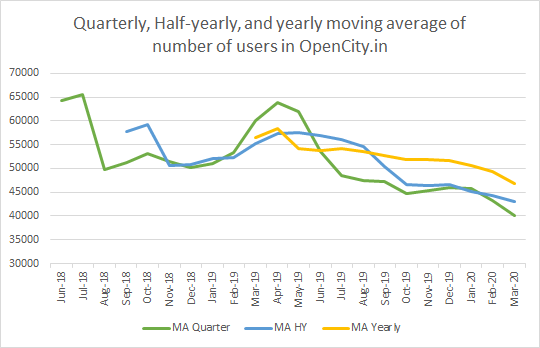
- Numbers of users and sessions fell year-on-year by nearly 18%.
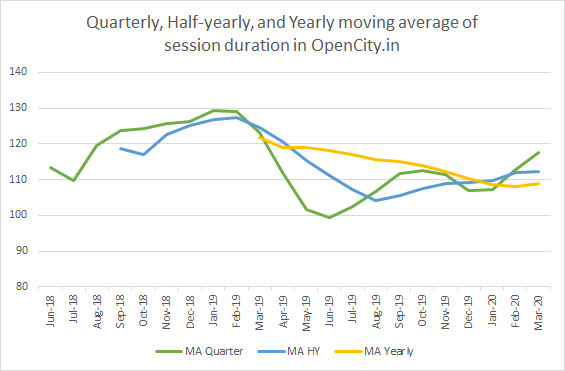
- During the same period, average session duration went down by 14%
- Bounce Rate, a measure of the % of users who leave the site without interaction, went up from 71.4% to 73.3%


Occasional spikes are observed in usage, especially around local or national events like elections. For example, Open City had more than 100,000 unique visitors in May 2018. Why? Elections to the Karnataka Legislative Assembly were held that month. However, quarterly, half-yearly, and 12-month moving average of the number of users and average session duration on OpenCity show a declining trend.
User Demographics
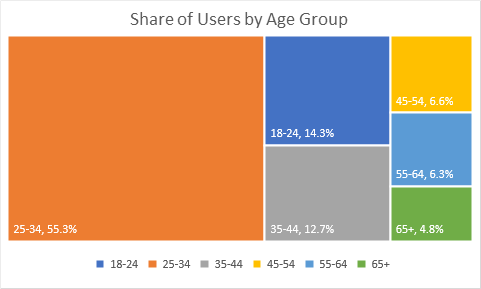
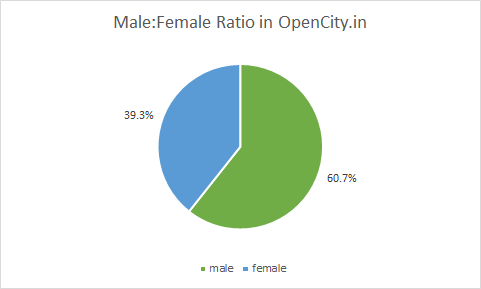
As pointed out earlier, most of the users of OpenCity are male (~60% in the last 2 years). Majority of the users are also in the age bracket 25-34. However, there’s a not-so-insignificant number of users who are older. 11% of them are above 55.
Usage Pattern
One important information we need as we prepare to redesign OpenCity from the ground up is to know what works right now. In the first three months of this year, 3 out of the top 5 performing pages on the site were map based, with a session duration that’s more than double the site average. Coupled with the interviews of users we’ve had, It’s clear that they prefer interactive elements, including maps and visualizations.
Way forward
While Google analytics gives useful insights, it’s important to see it as only one part of the larger puzzle of understanding what users want. Our team has been conducting several in-depth interviews with current and potential users of the platform. In the next blog, we’ll talk about the distilled insights from our design research phase. Meanwhile, listen to CivicDataLab’s first ever podcast episode on this very same project.
1.Google Analytics doesn’t provide the gender identification of individual users, even though they are anonymised. More than 63% of OpenCity users are male. On the balance of probability, we’ve used the “he” pronoun.
About the author
Arun is an Economist and Policy Researcher at CivicDataLab. He’s passionate about #OpenData and its potential to increase state transparency and accountability. He believes in empowering state agencies to make policy decisions based on the best available evidence. Loves teaching.