On May 29th 2024, Telangana recorded a temperature of 47.2°C, while the city of Hyderabad reached 43.3°C. With rising temperatures across the globe, such high temperatures are no longer a rare occurrence in Hyderabad. Increasing concretisation and reducing green cover have only made it worse.
Hyderabad is a city characterised by extremes. While places in the northwestern parts of the city are home to centres like the Hyderabad University, IIIT Hyderabad, International School of Business and major IT firms, the older parts are congested with extremely narrow roads. Industrial clusters with micro, small and medium scale industrial units also dot these older parts.
How does extreme heat affect these different parts of the city? What are the mitigation measures available for the residents and workers in the city and are they equitably distributed? How does heat affect the non-human voiceless denizens of our city and how can the city help them? These were some of the questions that participants in the Urban Heat in Hyderabad datajam sought to answer.
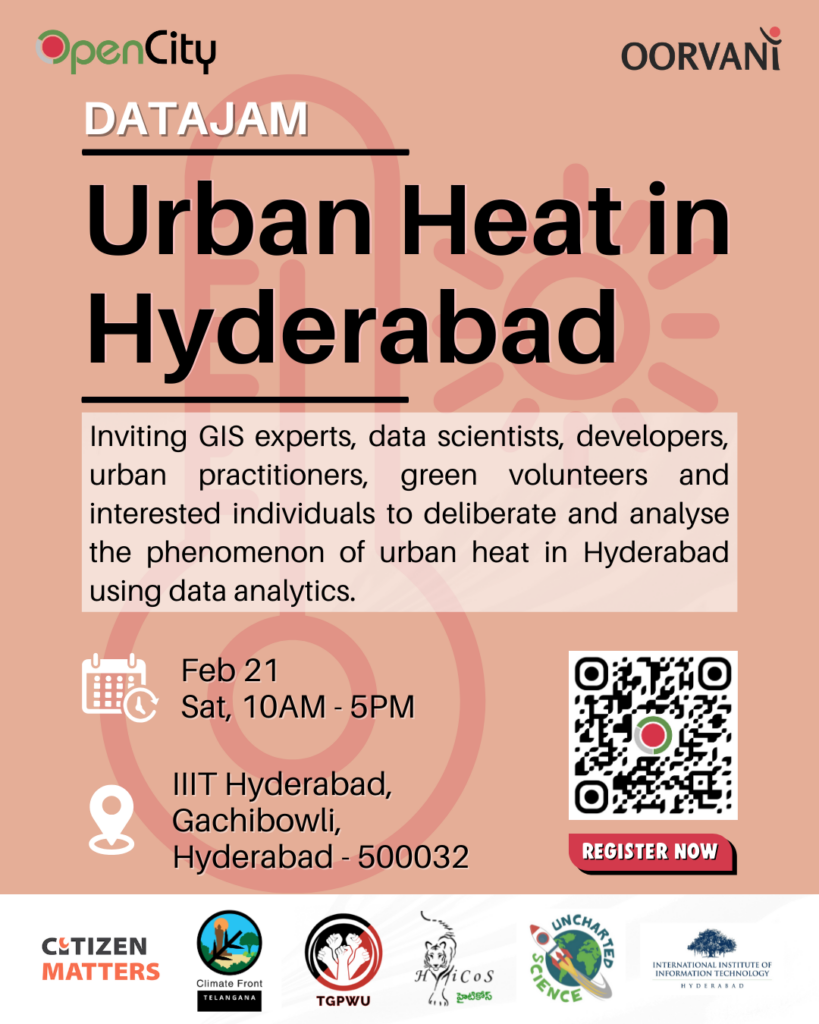
Urban Heat in Hyderabad
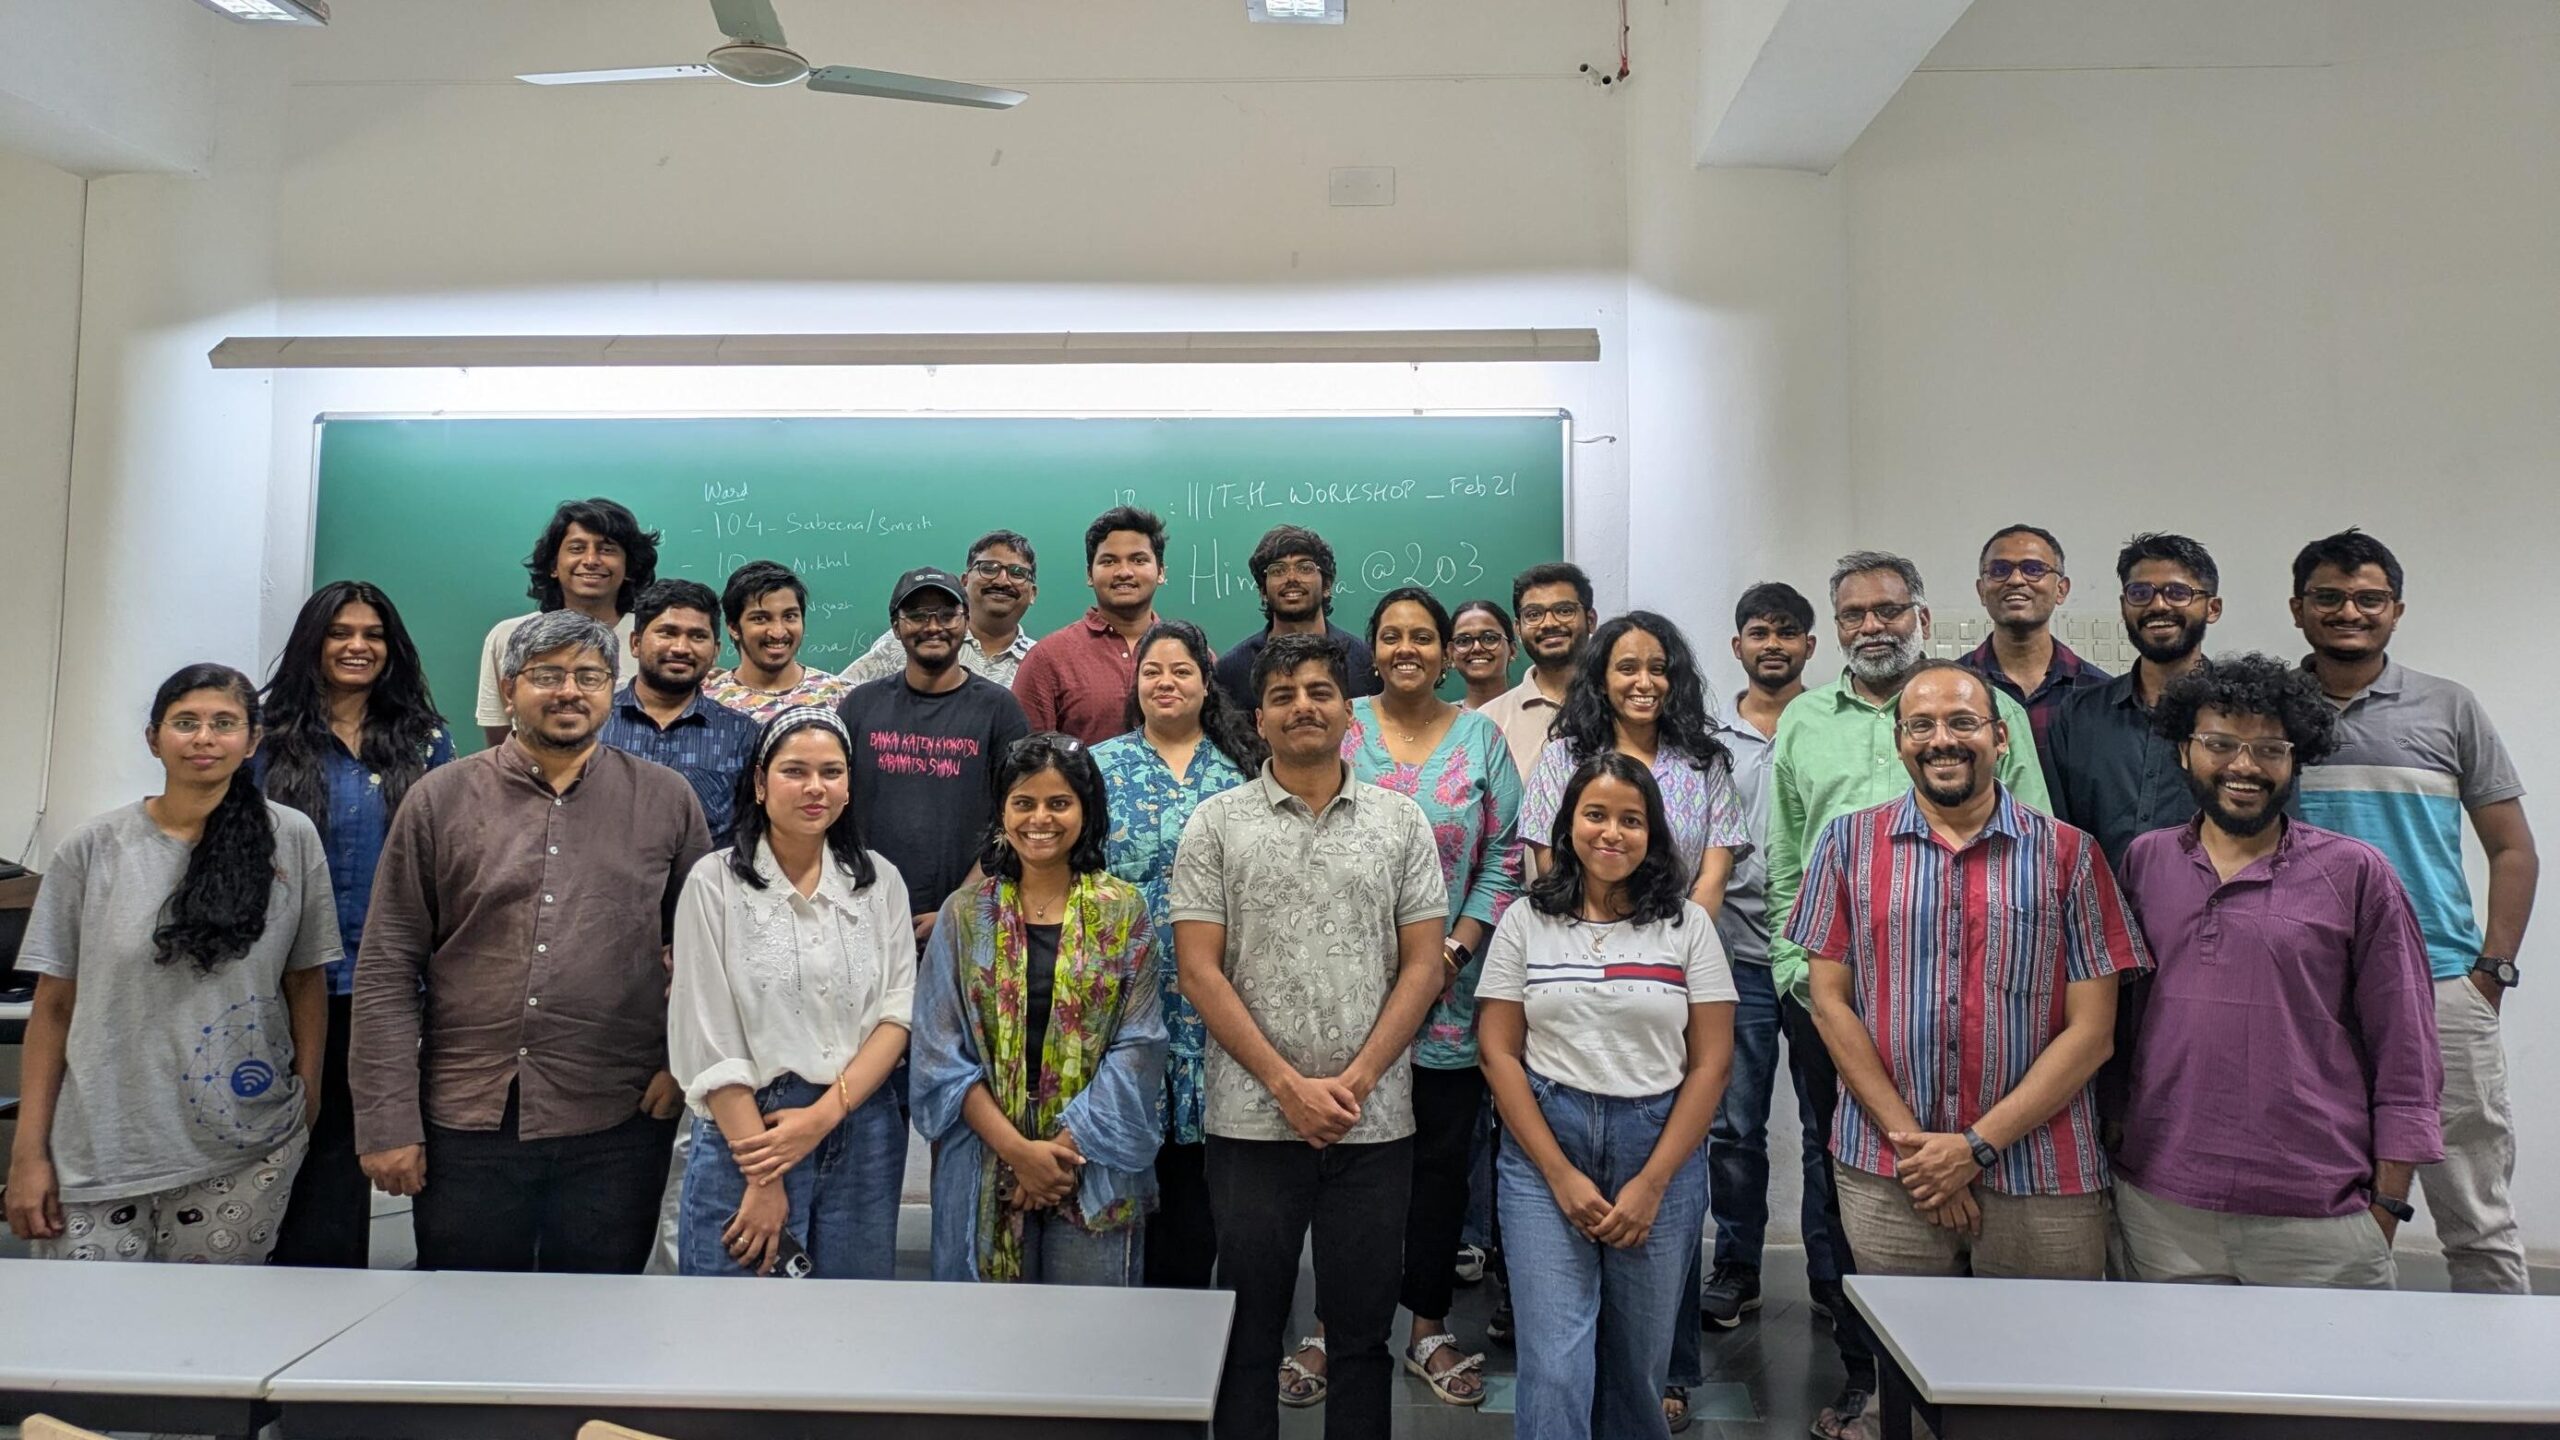
The datajam was conducted in partnership with Uncharted Science, IIIT-Hyderabad, Climate Front Telangana, Hyderabad Tiger Conservation Society and the Telangana Gig and Platform Workers Union. It was held at the verdant campus of IIIT Hyderabad.
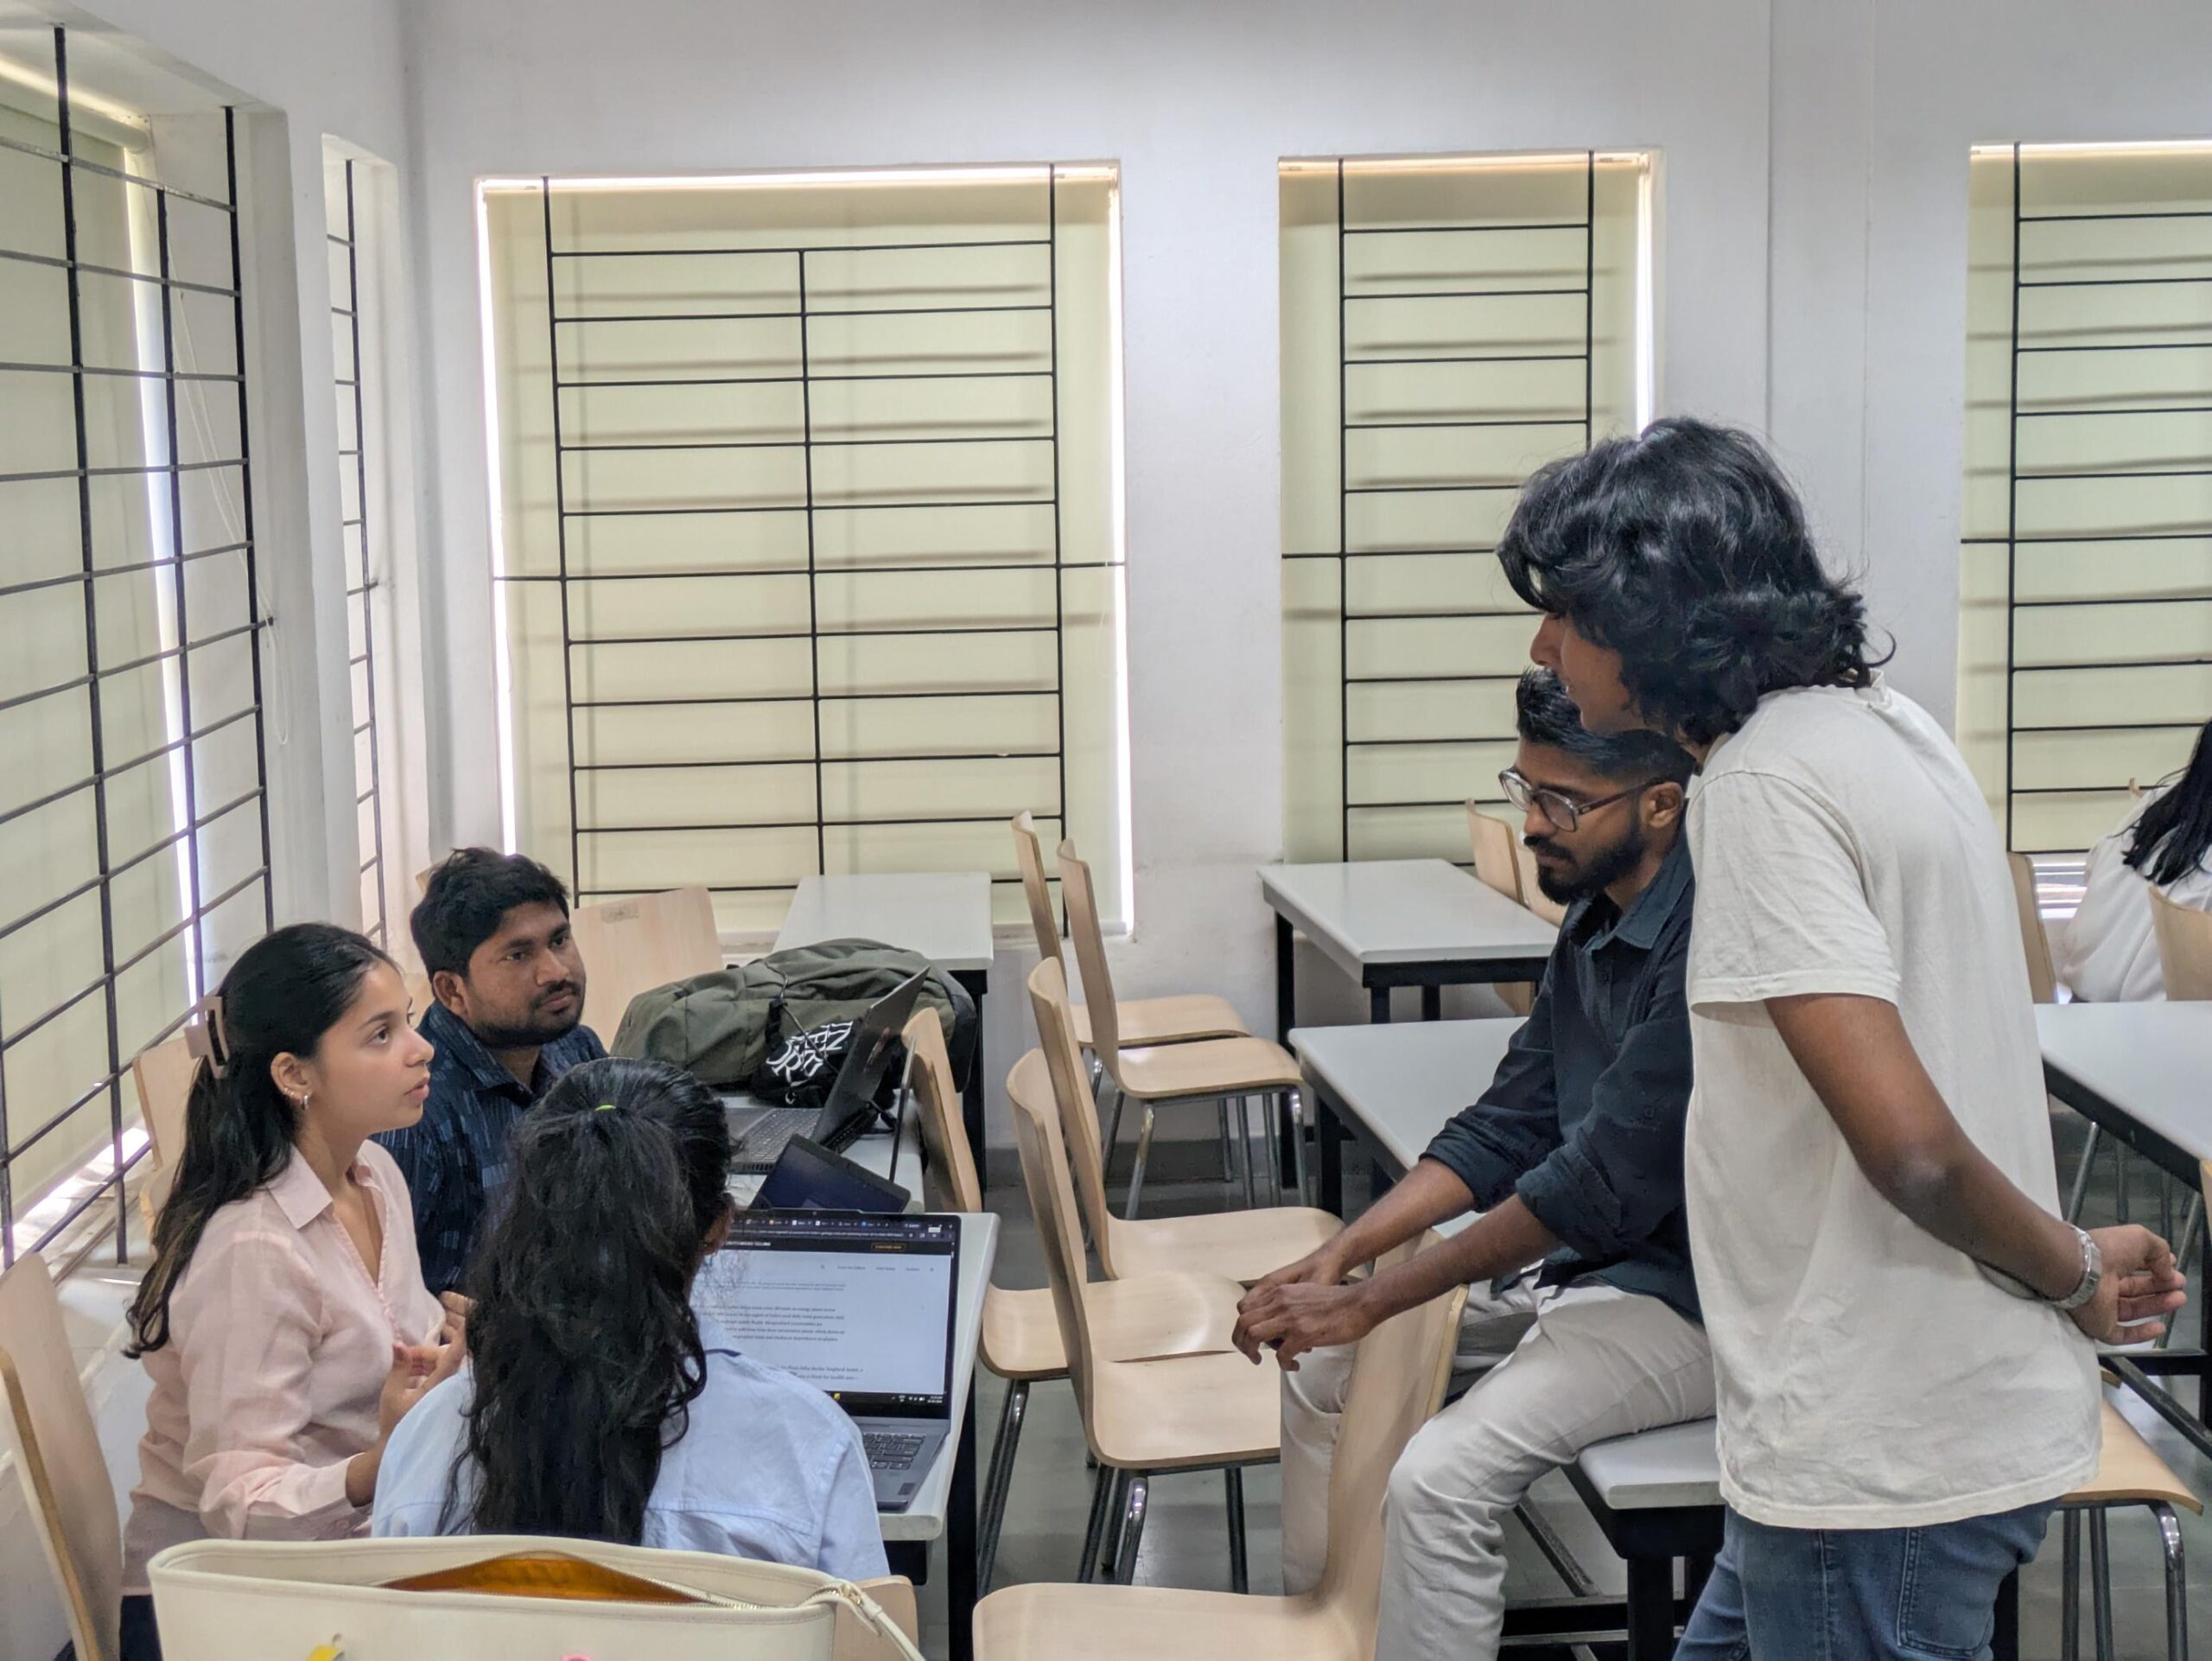
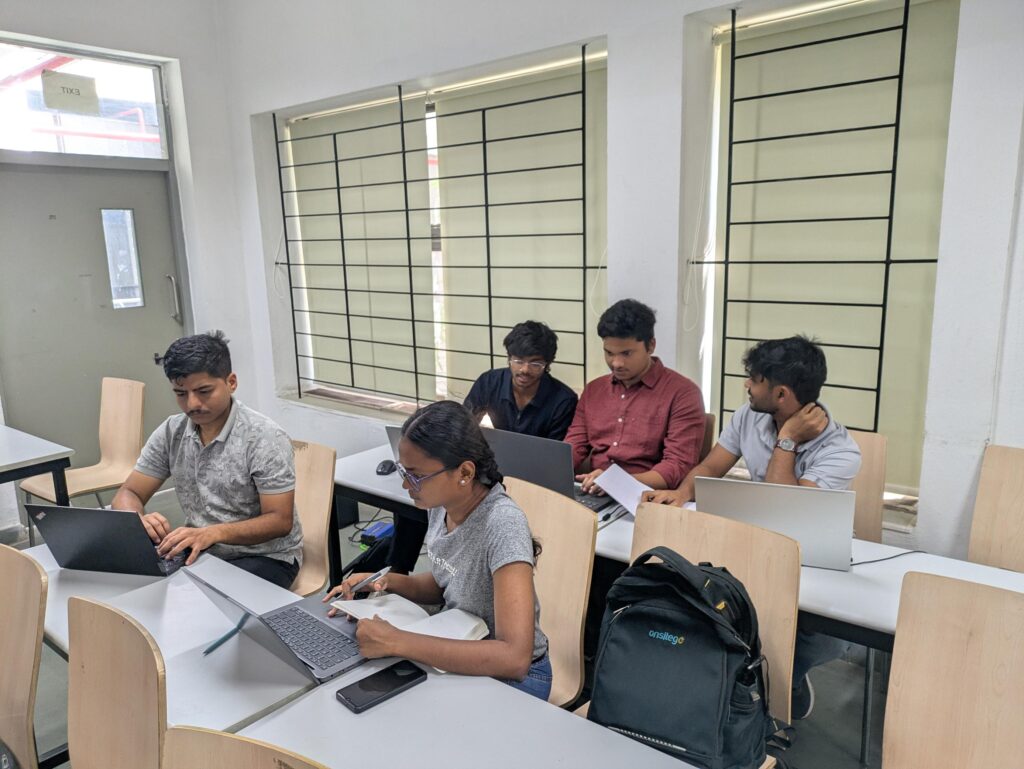
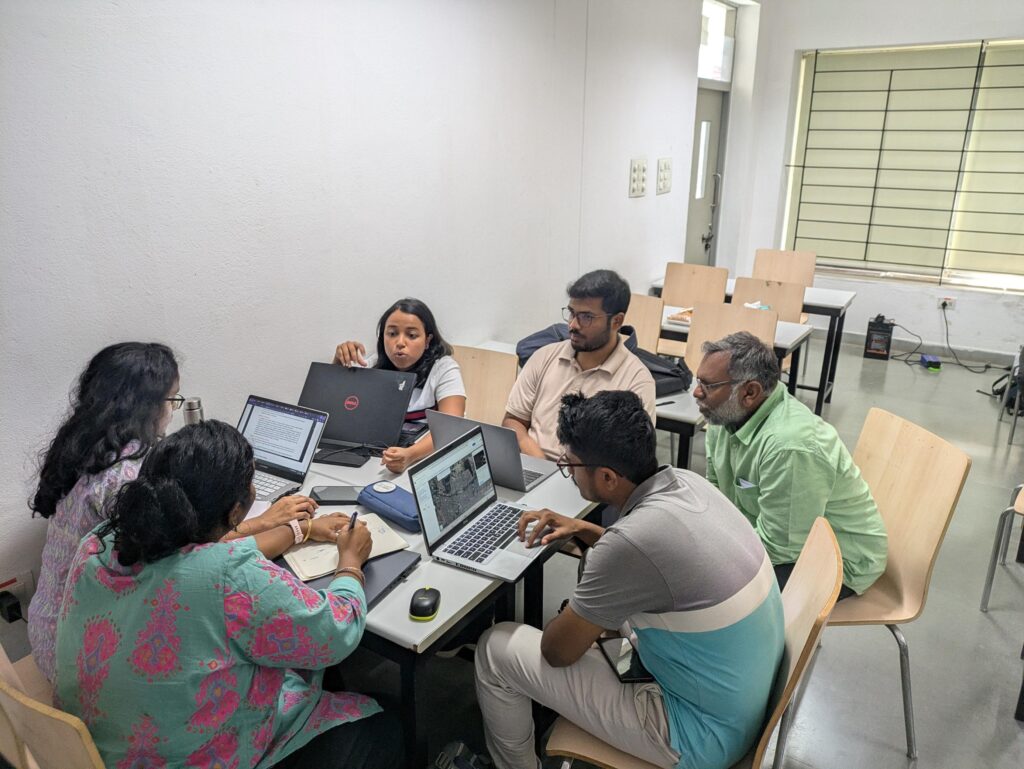
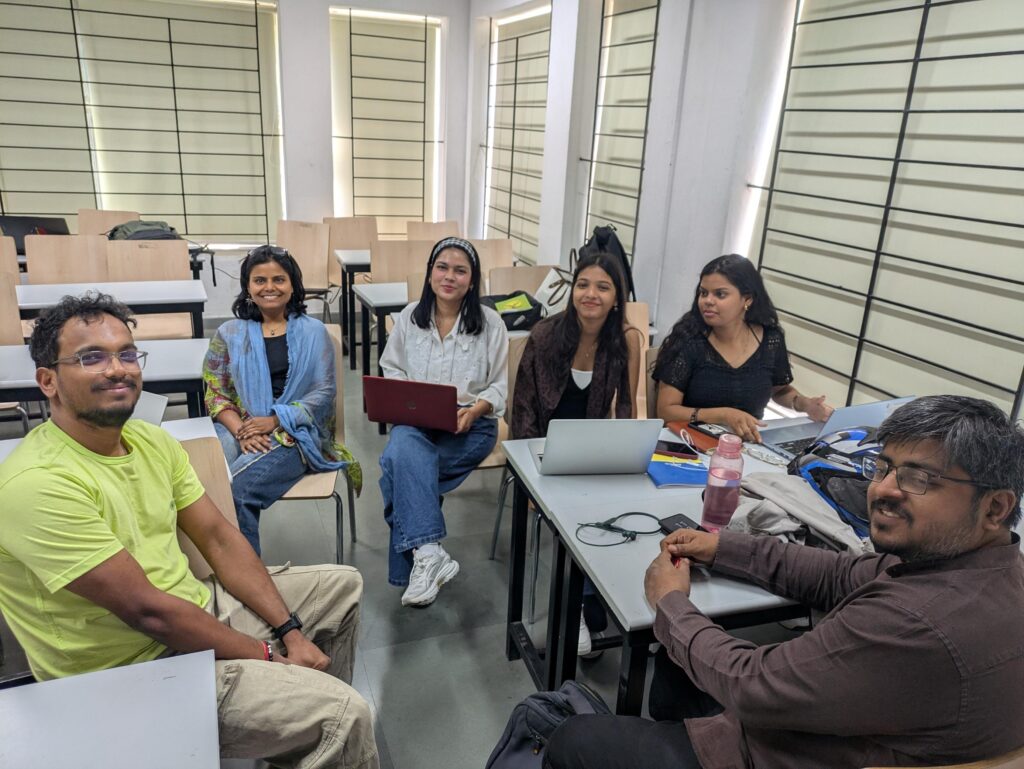
In the day long event, 26 participants from diverse backgrounds – GIS experts, urban planners, civic society members, researchers, students and active citizens split into five teams to look at data and understand how heat affects five different parts with different land use characteristics in Hyderabad.
They used satellite data – Land Surface Temperature maps from Google Earth Engine – both current and historic to map the hotspots in the wards they chose. The hotspots were correlated with census data, on-ground knowledge, and other datasets to map the vulnerability of people living and working in these areas. Based on the vulnerabilities, the teams suggested mitigations and recommendations to the authorities.
Problem Statements
Similar to the earilier datajams, each team picked a ward with different characteristics to analyze the effect of Urban heat on the areas. The wards chosen and their profile were:
- 103-Borabanda: An older part of the city. It is also a ward with a large number of informal settlements.
- 10-Uppal: A part of the city with a large Industrial Development Authority centre covering 400 acres.
- 104-Hitec City: A newly developing part of the city characterised by modern SEZs.
- 105-Gachibowli: Adjacent to Hitec city, home to educational campuses, and with a lot more green cover which is rapidly shrinking.
- Jawaharnagar: Home to Hyderabad’s largest landfill. A waste-to-energy(WTE) incinerator is also housed adjacent to it. Residential complexes have also started springing up close by in the area.

Outputs
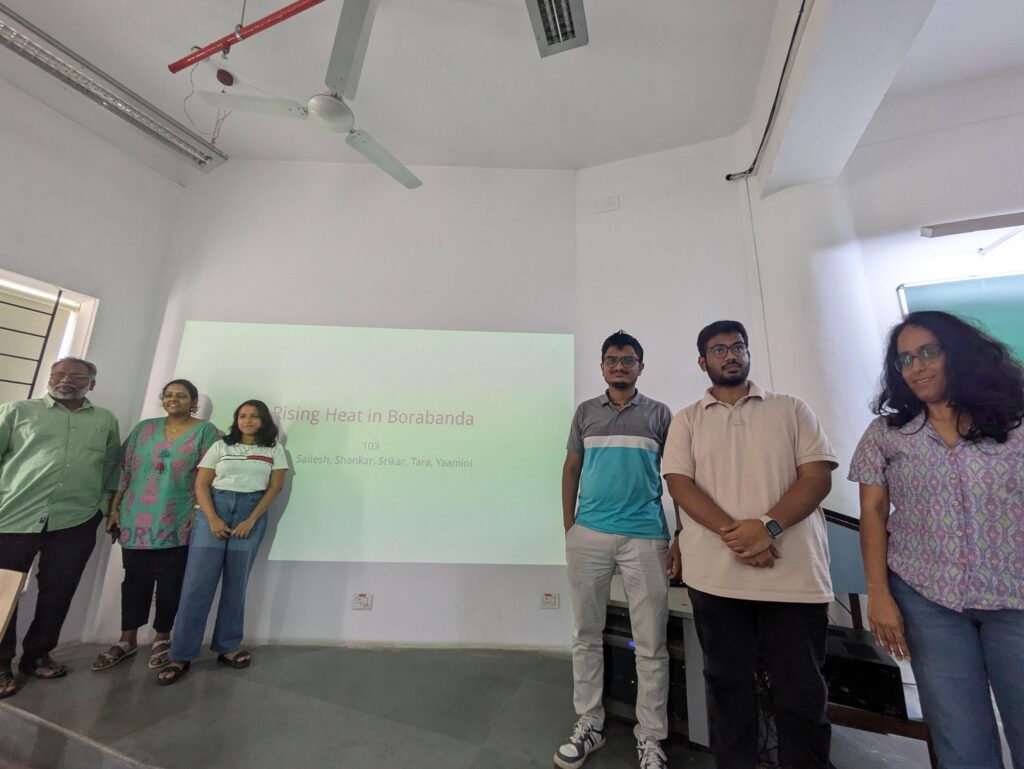
103-Borabanda
Team comprising Meghana, Sailesh, Shankar, Srikar, Tara and Yaamini looked at how heat affects the older city ward of Borabanda. Being a predominantly low income area, 70% of the ward is under informal settlements. With narrow roads, there is also a lack of vegetation.
The team found that in summer the temperatures in the ward reach the high 40s. There is also a lack of mitigation measures in the form of green areas or open spaces. There were also no public toilets within the ward, and bus stops were also found only around the boundaries.
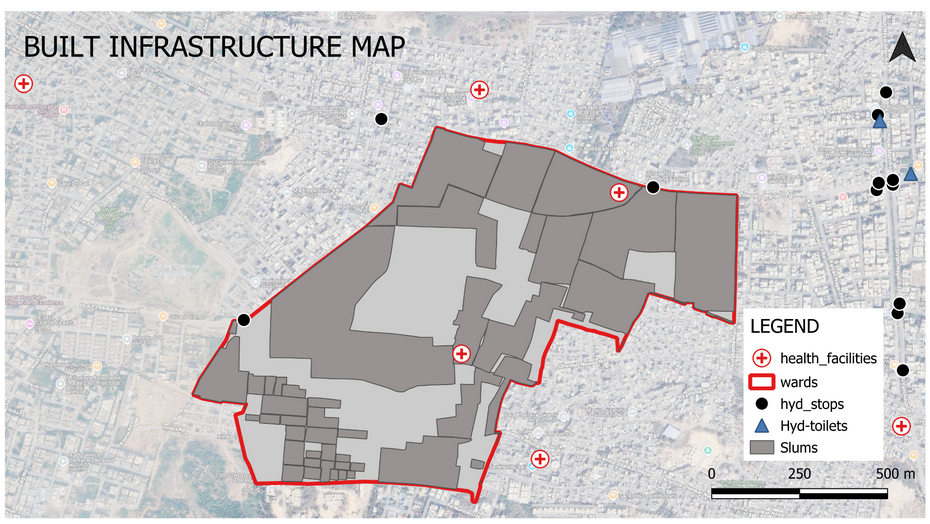
The team noted an urgent need to provide mitigation measures within the ward in the form of public toilets and water kiosks. While it would be difficult to create green spaces within the ward, they recommended that access to such spaces in the rest of the city needs to be throughout the day and not restricted to a few hours.
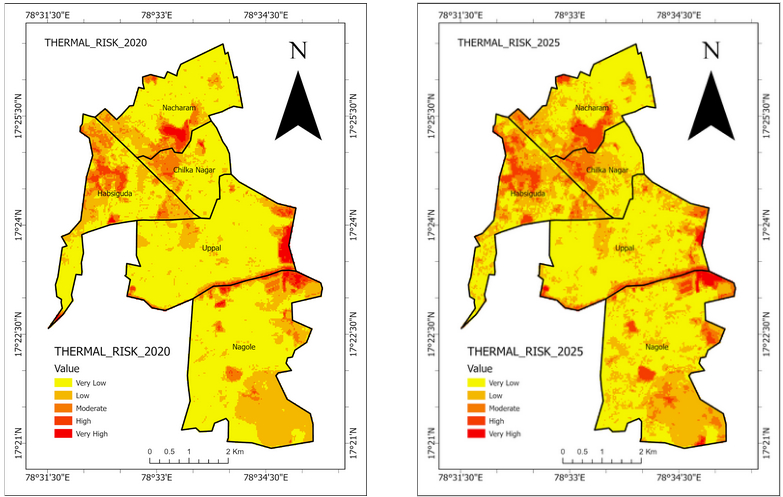
10-Uppal
Anam, Arava Satya Sai, Nikhil, Rishikesh, Ritika and Sammyak analyzed how changes in builtup areas correlates with heat in the area of Uppal. They noted that over the last 10 years there has been an increase in land surface temperature affecting mostly residential areas in the ward.
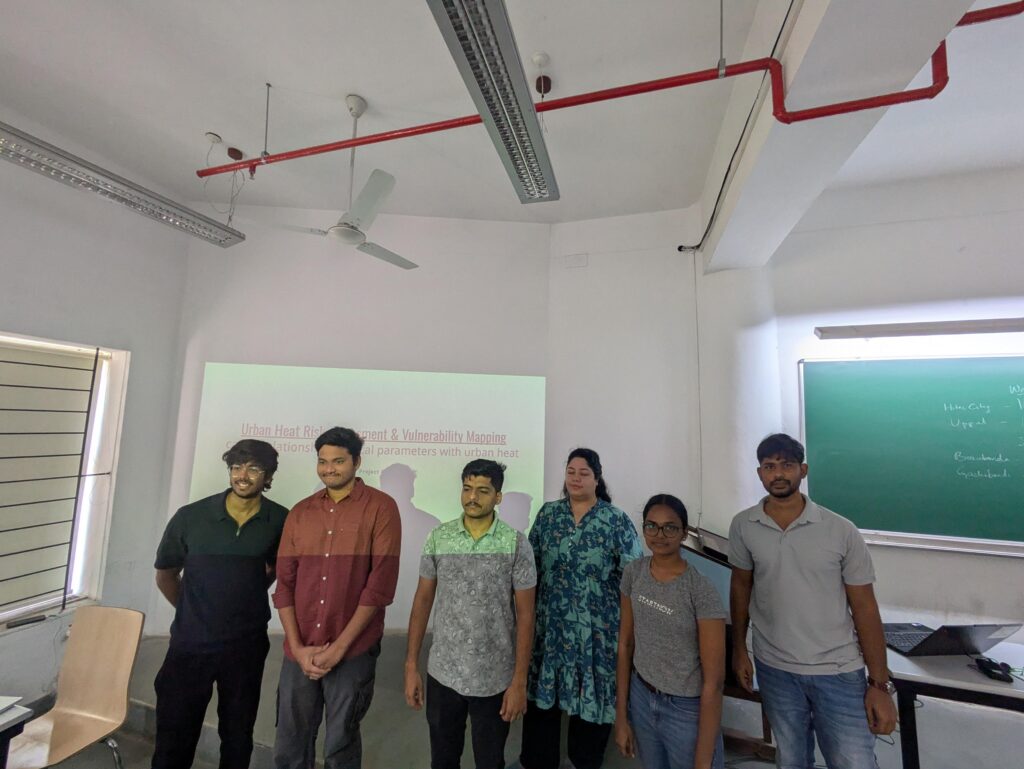
They found a high correlation with a decrease in vegetation and a corresponding increase in built-up area within the ward and its surroundings. This has led to the creation of major hotspots in the area and these hotspots are formed on important centres like IDAs in the wards where thousands of people work during the day.
They recommended that policy needs to ensure minimum green cover in high risk wards. Blue-green infrastructure needs to be increased by increasing green cover, restoring lakes and increasing permeable surfaces. Reflective roofs and pavements can go a long way in mitigating heat effects in high-risk, high-density wards.
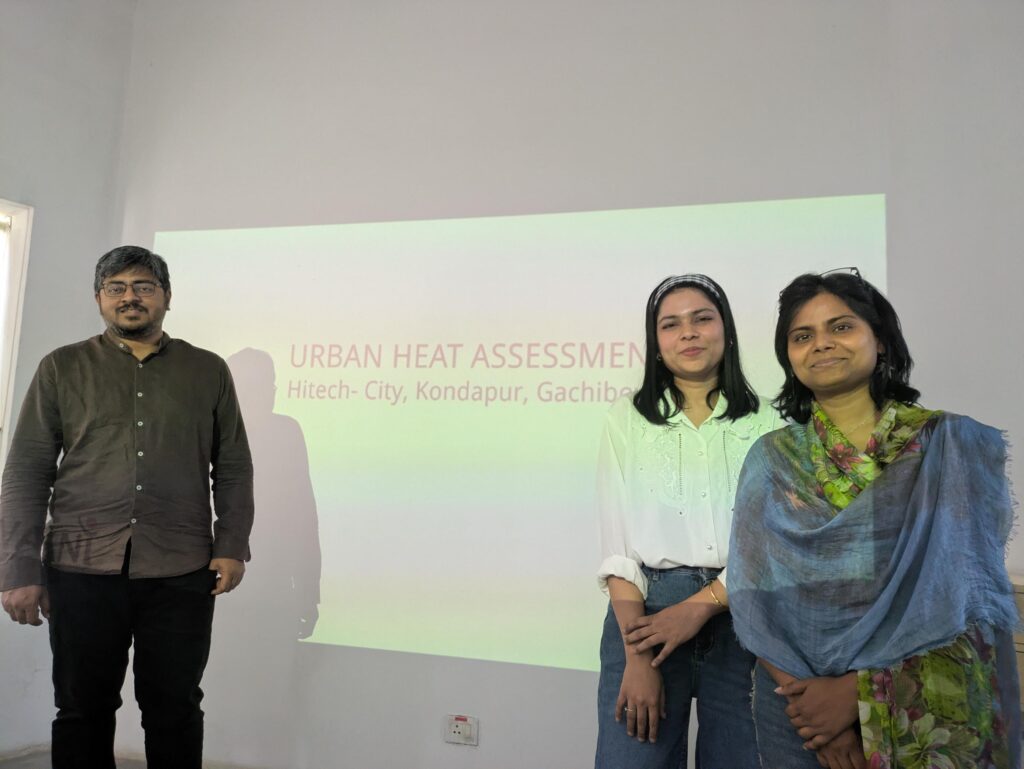
104-Hitec City
Kavita, Kriti, Ravi, Sabeena, Smriti and Tushar analyzed the long term heat patterns in Hitec city and how changes in land use have affected the area. They analysed different satellite data for temperature, land use, reflectivity and haze to track the changes in the area over the past decade.
The team noted that while the night-time temperature has increased over the years, there has been a slight decrease in day-time temperature. Similar to what was observed in Uppal, the green cover has gone down, replaced by built-up area in the area considered.
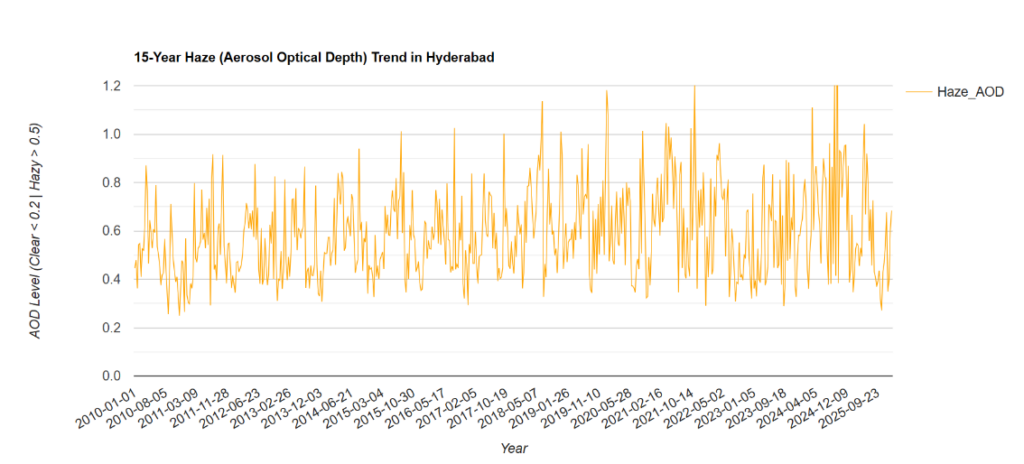
The haze, caused by aerosols in the atmosphere, possibly due to pollution and construction dust was seen to have increased over the time period, which explains the slight decrease in temperature over the same period.
They recommended implementation of mitigation measures like cool-roofing, increasing green cover and also misting to reduce construction dust.
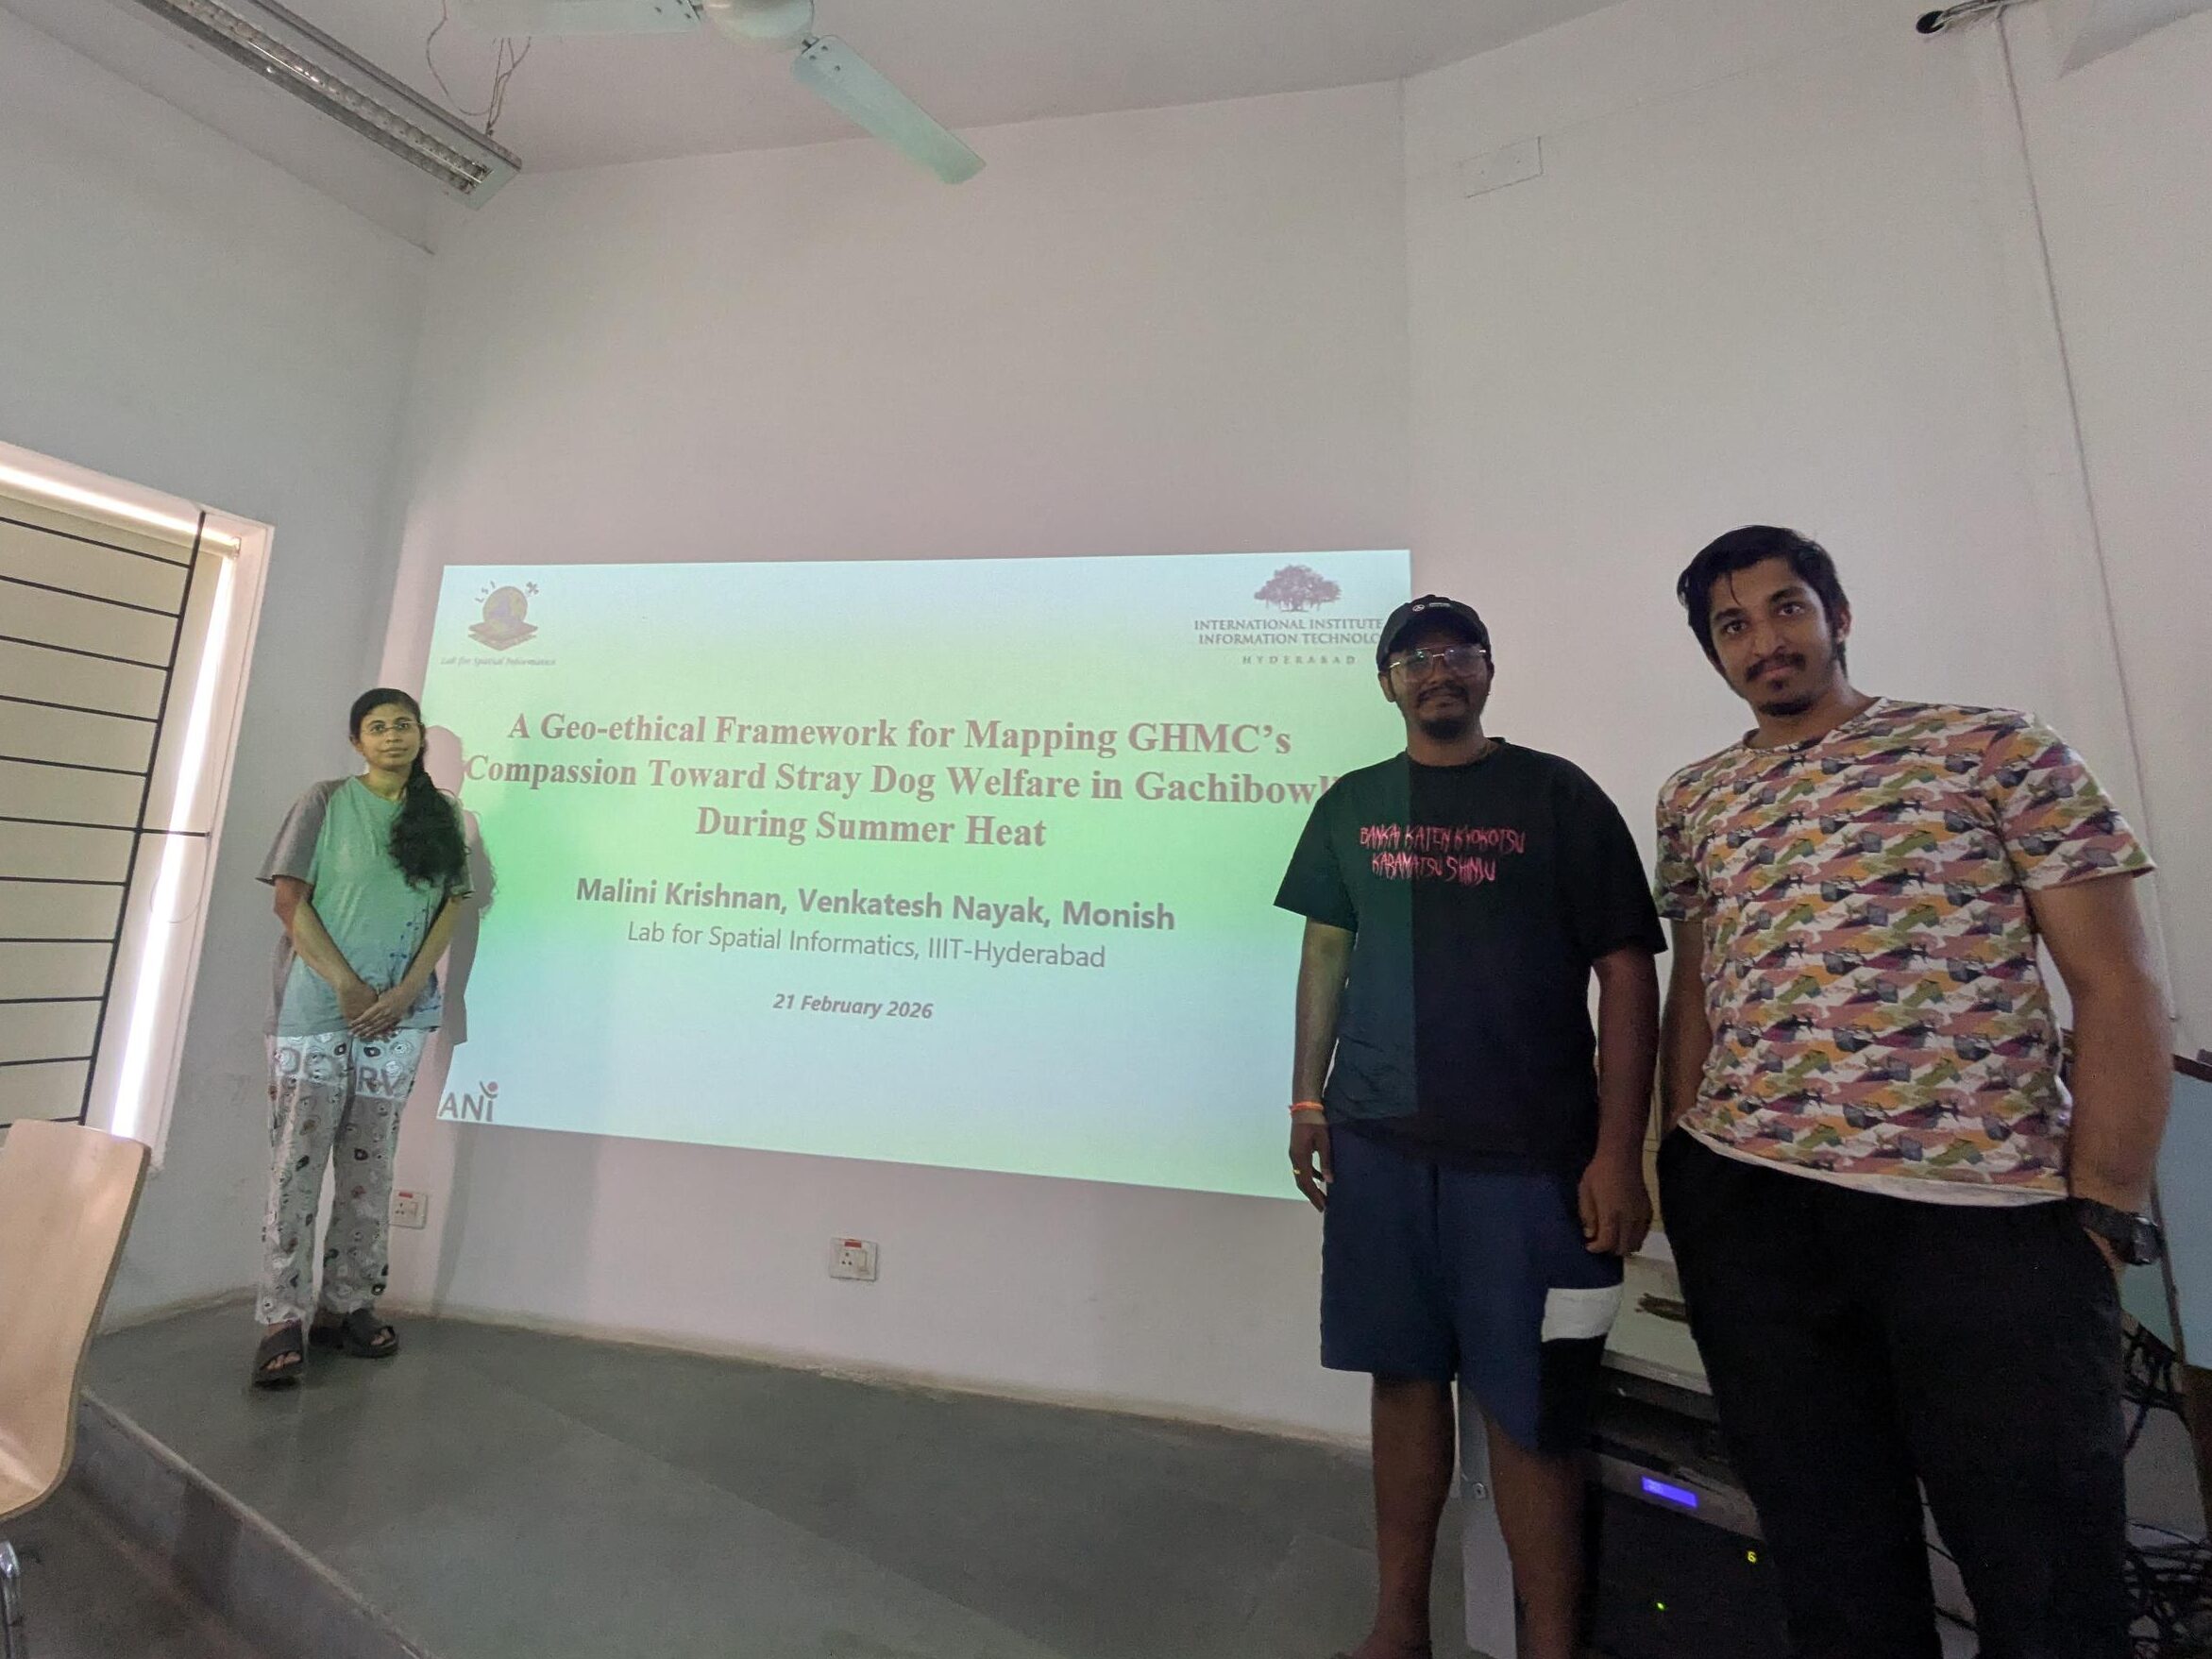
105-Gachibowli
Malini, Monish and Venkatesh analysed the state of heat in Gachibowli ward and looked at how it can affect street dogs and what mitigation measures are needed for them.
They noted that the paw pads of street dogs can withstand heat only up to 35°C. However, during hot months, road surfaces routinely surge above 40°C. During such months there is also a lack of access to water.
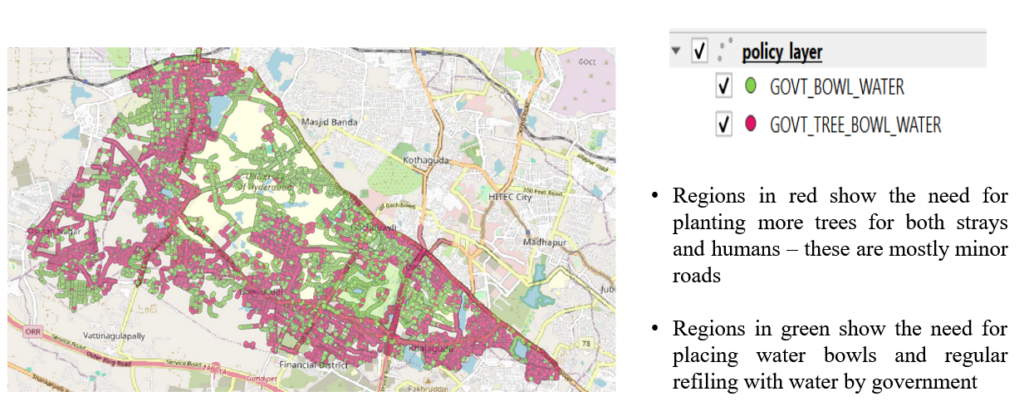
The team categorised spots in the ward based on heat exposure, green cover and built-up index into and assigned responsibilities to governments or citizens based on the category. Areas with high temperature, very less green cover needed urgent intervention in the form of green cover, and water bowls which are filled regularly by the government. In lower risk areas residents can help manage the hot months with water bowls.
Jawaharnagar
Arnima, Janvi, Nigazh, Praveen and Vivek looked at the area of Jawaharnagar which hosts Hyderabad’s largest landfill. While the area is not currently under GHMC limits, it is expected to come into the limits with the proposed delimitation. The landfill also hosts an incinerator, part of a waste-to-energy plant and the team tried to analyze how the WTE plant could be affecting the surroundings.
They noted that according to the 2011 census, out of 44,000 residents 28,000 were considered unemployed suggesting a high degree of vulnerability. The heat maps show a high degree of heat in the landfill and the areas on the west of the landfill.

Residential buildings have been springing up in the surroundings, which has also reduced the vegetation around the landfill. The situation seems to have worsened with the start of the WTE plant in 2018, affecting areas next to the plant.
Conclusions
Hyderabad has been seeing rapid changes in land use over the past couple of decades with the arrival of the IT boom. The older parts of the city have seen an increase in congestion and a loss of whatever little green cover they had. With increasing temperatures, the residents – human as well as animals – are left bearing the brunt of it.
The participants of the datajam found a marked difference in how heat affects different parts of the same ward. They noted that areas like informal settlements bear the brunt of urban heat during the hot months followed by industrial areas. Areas closer to greenery like parks and the Gachibowli forest and lakes like Durgam Cheruvu and Hussain Sagar benefited from the greenery and waterbodies, and were much cooler than the surroundings.
Srinivas Kodali, of Uncharted Science, noted that “as part of the Uncharted Science Foundation, we are helping answer the questions of impact of climate change on society. This data jam is an effort in that direction to collaborate with the climate science ecosystems and engineers working on these issues. We are investing in our efforts to help plan for a climate future that is rooted in ecological values and these data jams help in that direction.”
For John Michael of Climate Front Telangana, “urban heat and ecological degradation are not just environmental issues, but also questions of justice. Communities such as waste pickers, informal workers, and residents living near landfills and waste-to-energy plants are experiencing the harshest impacts of climate stress everyday. This datajam brought together evidence and lived realities to strengthen the case for urgent public action and people-centred climate responses in Hyderabad.”
Prof. Khaliq Parkar, of IIIT Hyderabad, added that “at the Human Sciences Research Centre at IIIT-H, we explore questions of livability and sustainability in our fast changing cities. This datajam is an effective way to bring together data scientists, civil society, and students in one place to look at our urban futures together. Local governments will benefit by working together with such initiatives towards goals of public data-driven decision making.”
For Tara Rajendran, an ecologist, who participated in the datajam, it was “a very fun initiative, the first I have heard about in Hyderabad. It’s a great experience to connect with like minded individuals from different backgrounds. During the exercise, each of the team members shared their perspectives and expertise, and helped us get a cohesive picture of the state of data, actors etc. It gave us a foundation on which to engage with civic issues. I hope this will be the start of several such initiatives in Hyderabad.”