
The Periodic Labour Force Survey (PLFS) is an annual survey from the National Statistics Office (NSO) in the Ministry of Statistics and Program Implementation (MoSPI), Government of India. The survey measures the state of the labour force in India, the level of participation of people in the workforce, the level of (un)employment, wages received, hours spent, skill levels, and the fields where people are employed.
In this analysis, we look at the participation of men and women in the labour force, the gaps in wages, effects of education on labour and wages, and the sectors that are generating the most employment. The data is compared across the eight major metros in India – Ahmedabad, Bengaluru, Chennai, Delhi, Hyderabad, Kolkata, Mumbai and Pune. You can find the data here, including data for the individual cities along with the raw data.
The analysis only considers people in the age group 21-60, the working age, where an education level up to graduation is possible. The data considered for Hyderabad includes the district Rangareddy as the number of samples for Hyderabad was very poor.
Employment
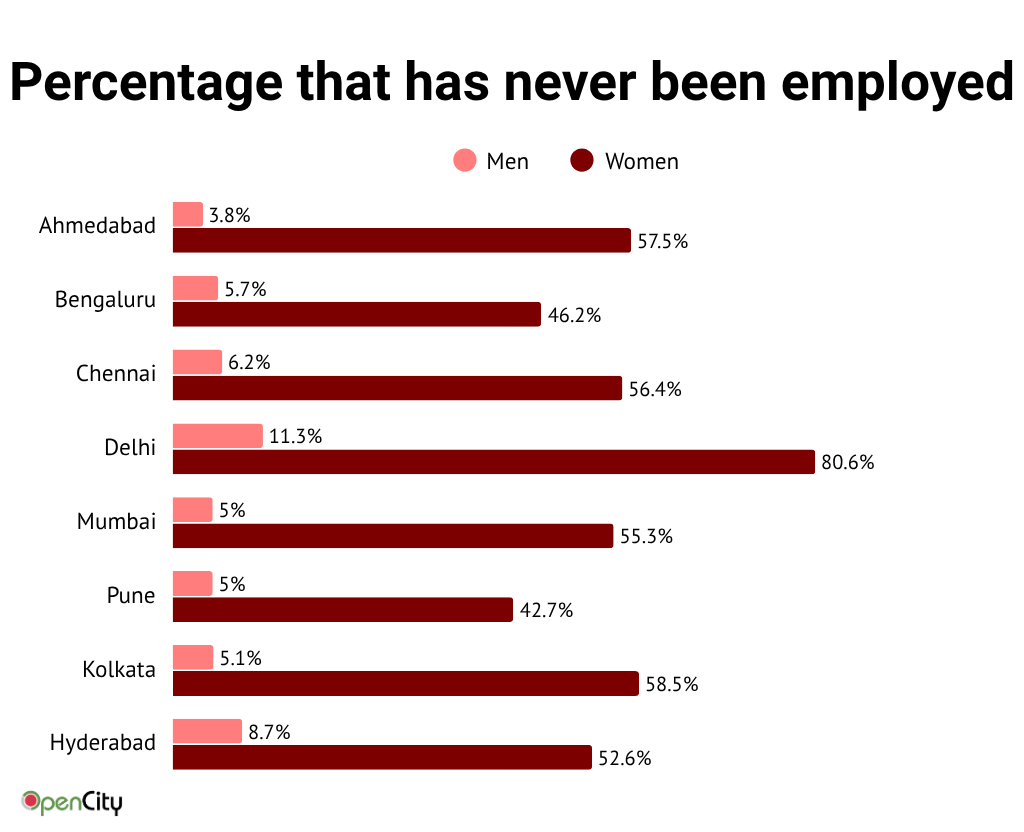
One of the questions the survey asks is whether a person was ever employed. The answer ‘no’ brings out the set of people in every city who have never been employed and have never had to work, for various reasons.
The survey finds that the number of such people form a very small proportion for men, around 5% on average except in Delhi where more than 10% of the respondents have never been employed.
With women the proportion shoots up to more than 50% for most cities. Delhi remains the outlier where more than 80% of the women surveyed have never been employed.
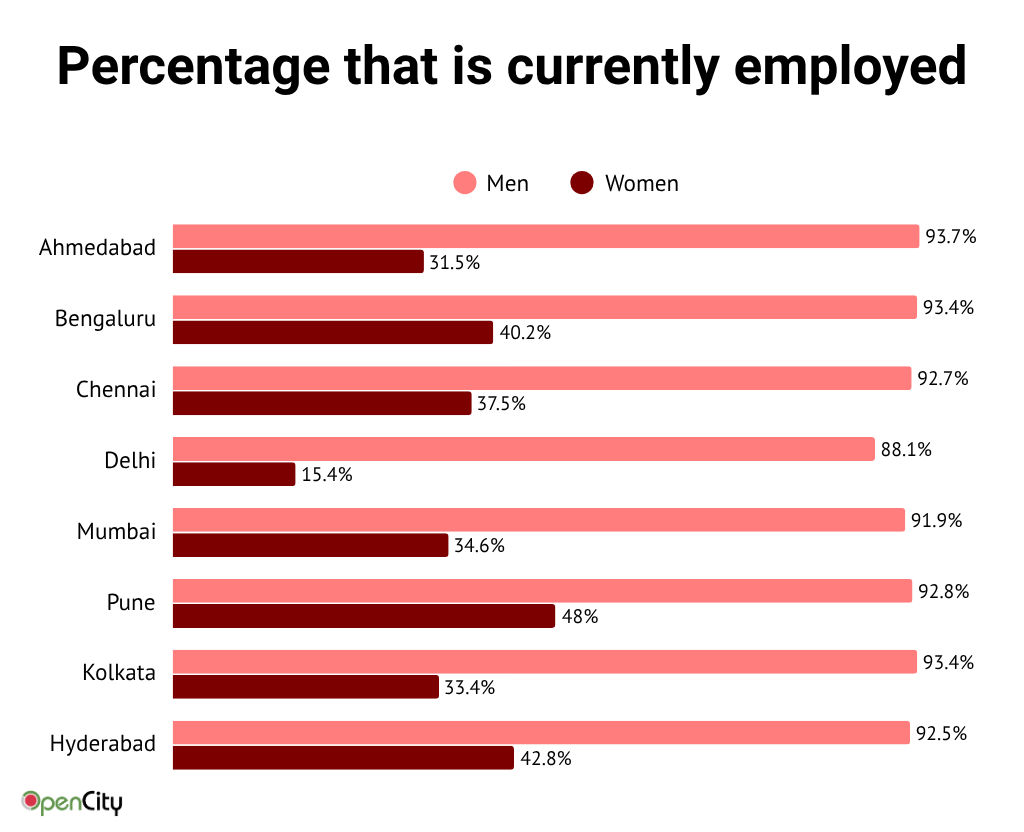
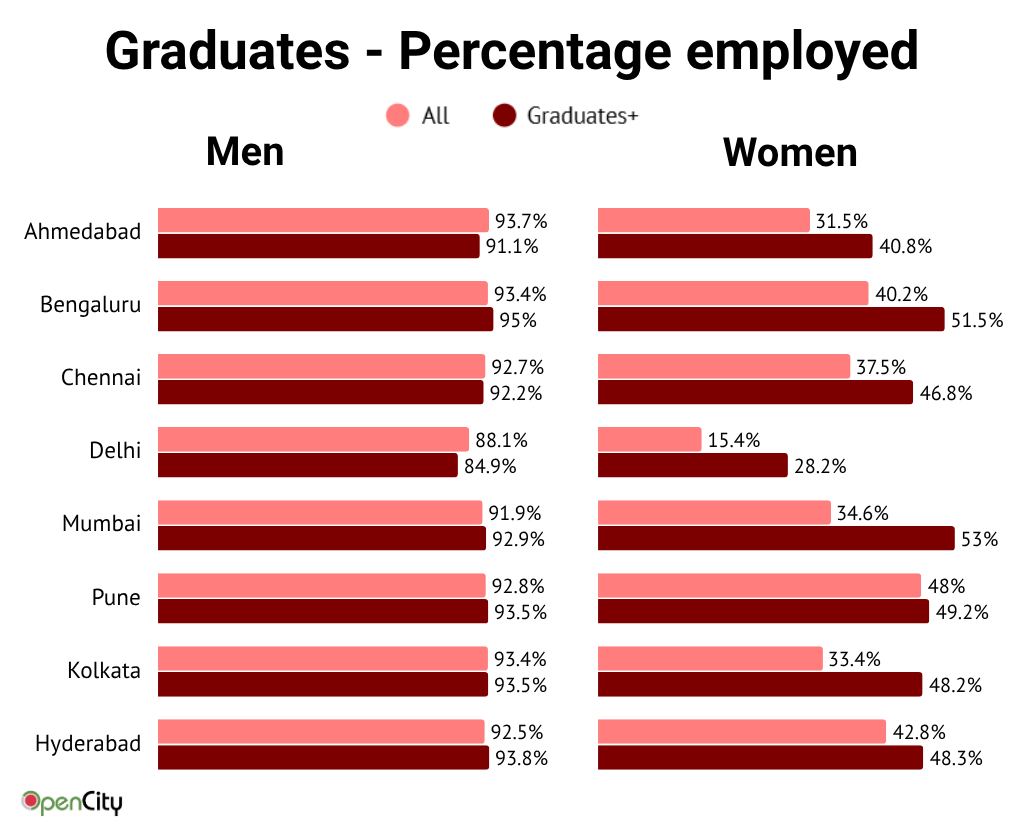
The labour force participation follows a similar trend, with around 95% of the men, and only 30 to 40% of women on average being currently employed. Delhi is again the only place that bucks the trend with only 15% of the women being currently employed.
Pune records the highest employment of women at 48%, with no city recording a higher than 50% participation of women in the labour force.
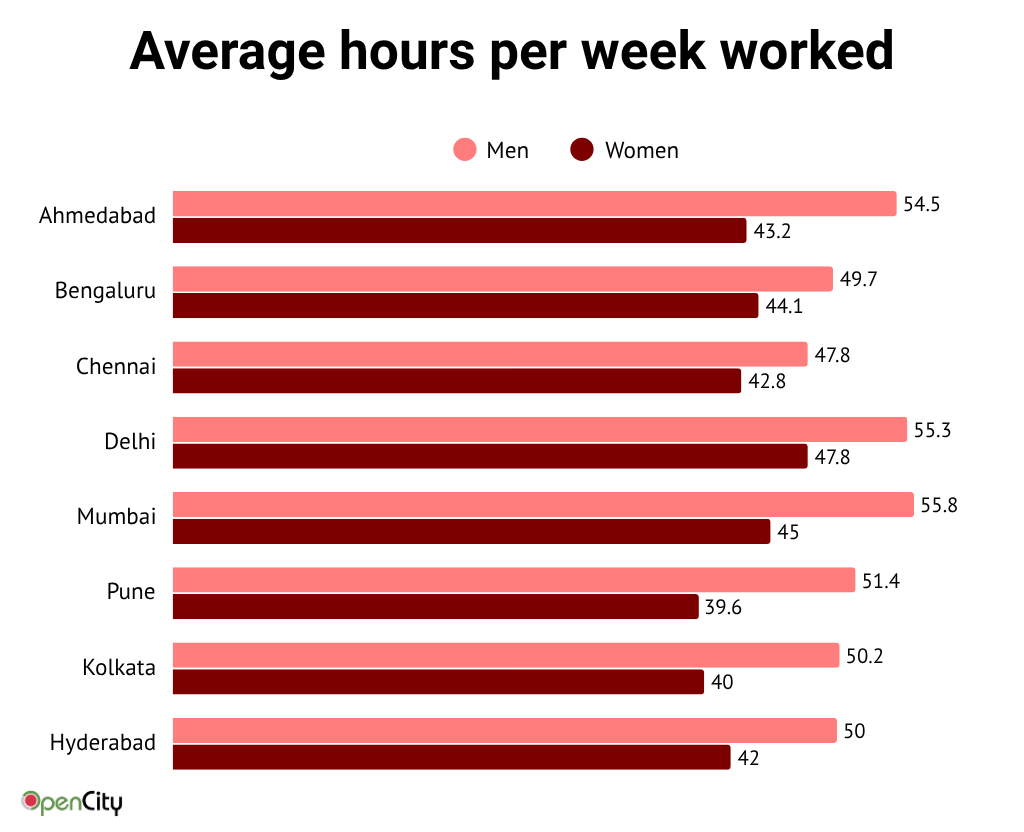
The burden of unpaid domestic and care work means that not only are much fewer women employed in the cities, but they work fewer hours, around 80 to 90% of the hours men put in each week. On average. men work around 50 hours each week while women average around 40. In Delhi, with fewer women as part of the labour force, those who work end up working the most among Indian cities at 47.8 hours each week, the same as an average man in Chennai.
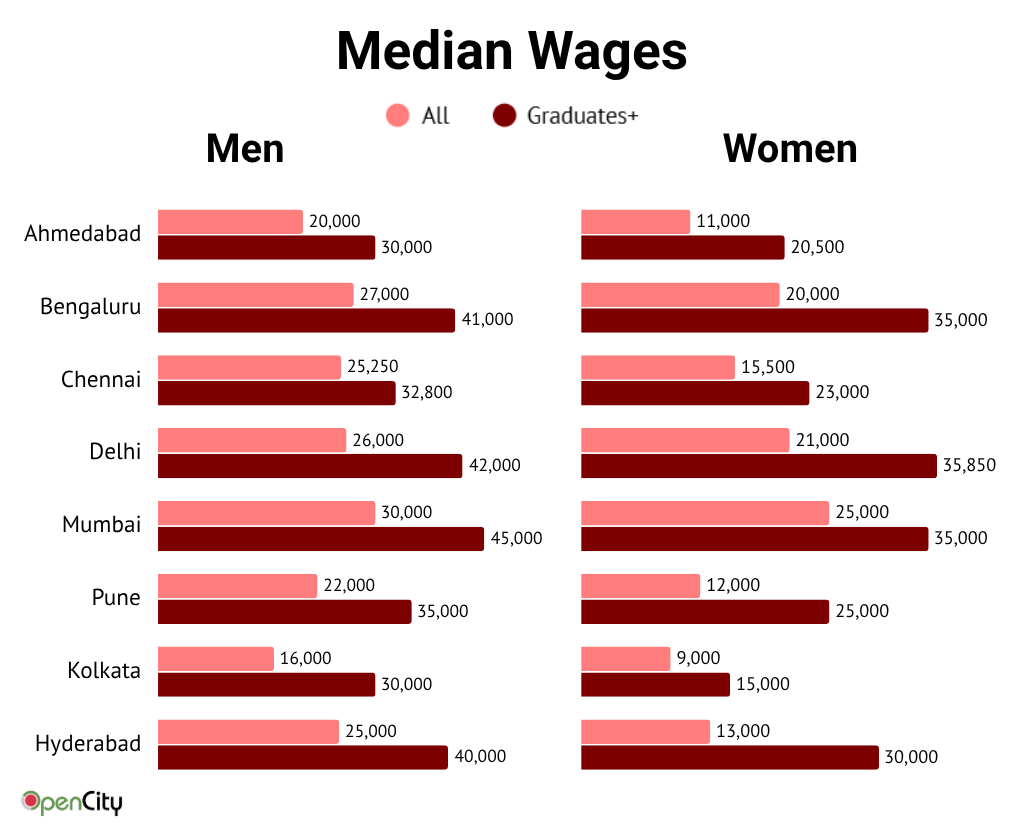
While fewer hours would mean less wages, the wage gap is still much lower than the proportion of hours women put in. Unlike the similarity seen among most cities in employment and hours, with wages there is a wide variance across cities, but in all cities women earn significantly lower than men.
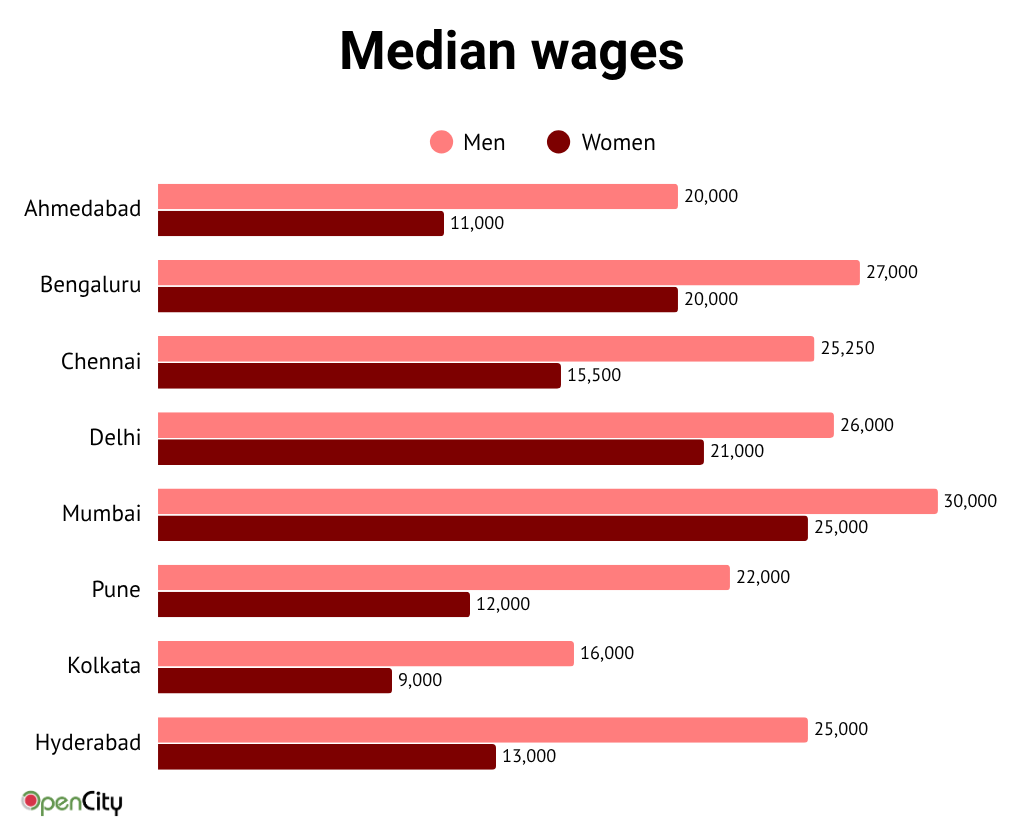
In Ahmedabad, Pune, Kolkata and Hyderabad women earn just over half their male counterparts despite working 80% of the hours. Delhi, Mumbai and Bengaluru are the only cities where the pay is approaching parity, at least when compared to the hours put in.
Education and employment
A skilled populace can contribute significantly to the labour force as well as earn more wages. In women it can also help increase their participation in the labour force.
The survey shows that with men, there is little difference between the employment levels of those who are graduates when compared to the average employment of men. But the difference is significant for women, where the proportion of women employed shoots up considerably when considering those who are at least graduates. In the case of Delhi the proportion almost doubles.
The biggest difference is seen in the median wages, where it shoots up for both men and women. In most cities women who are graduates or above earn more than the average wage for all men. However, the wage gap not only remains between men and women graduates, but it is almost the same as the one for all men and women. While education definitely gives women a boost in wage, it still does not bring them closer to parity with men.
Sectors
The sectors that employ men and women vary widely. For men, the leading sector is National Industry Code (NIC) 47 which includes retail trade — those working as shopkeepers, retail sales staff, store managers, cashiers, billing clerks, inventory/stock assistants, pharmacy staff, e-commerce fulfillment workers, petrol pump attendants, and street/market vendors.
This is followed by NIC code 49, the transportation sector. This includes all those employed in transporting goods and people — bus and truck drivers and other staff, cabs and auto-rickshaw drivers, e-commerce and food delivery drivers, drivers of goods vehicles among others.
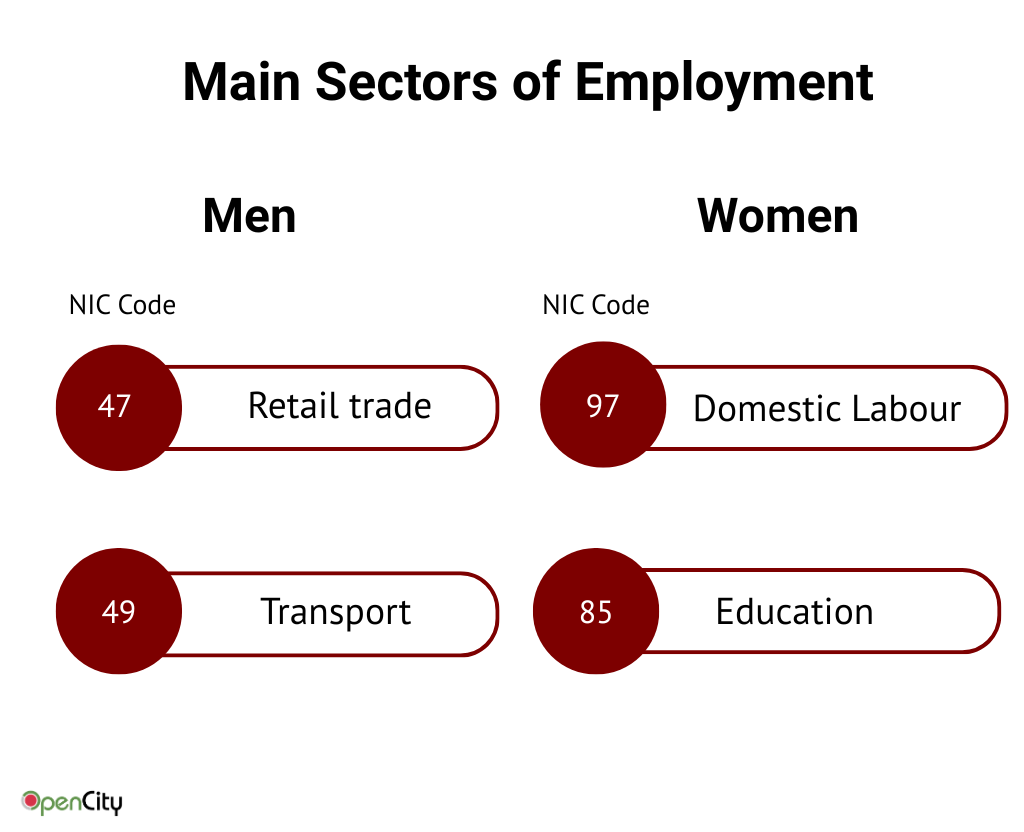
For women, the largest employer in cities is NIC code 97, which covers all kinds of employment in private households. This includes all kinds of domestic helpers and hired caregiving staff.
This is followed by NIC code 85, education services which includes teachers and workers in schools, anganwadis and colleges.
The difference in the sectors of employment for men and women immediately suggests the difference in hours, wages as well as absorption into the labour force. More women in retail trade running shops, as well as male-dominated sectors like transport and delivery services can help raise the labour force as well as close the wage gap.