Bruhat Bengaluru Mahanagara Palike (BBMP) is the governing body for a large area under Bengaluru Urban district. It administers an area of 712 sq. km with a population of close to 10 million. After the last delimitation in November 2022, there are now 243 wards in BBMP, up from the earlier 198 wards. The last elections were held in 2015 and the council’s term ended in 2020. The next elections are yet to be announced.
The last BBMP budget for the year 2023-24 had an outlay of Rs. 11,164 Cr. This money is spent on various bodies like staff compensations, solid-waste management, storm-water drains, roads, street-lighting among other departments of BBMP.
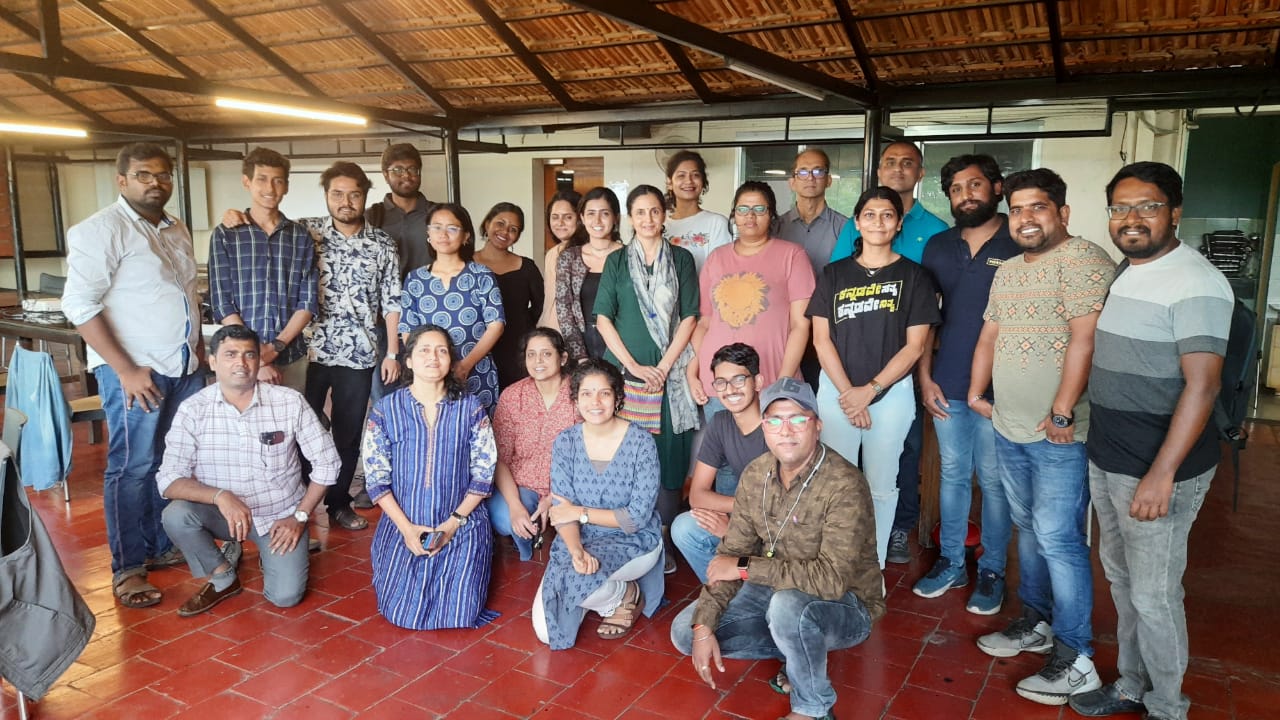
What can a deep dive into the BBMP budgets and work orders data reveal about how the money is being spent? What can we find out about where the money is coming from? What are the processes that drive how BBMP spends its money, and how can they be improved? At a broad level these were the questions, the “BBMP – Work orders, Budgets and Processes Datajam” held on the 15th July 2023 in Palace Road, Bengaluru tried to answer.
Janaagraha and Karnataka Ward Samiti Balaga were the partners for the datajam and their members were present during the event as part of the teams as well as guiding the participants on finding and understanding the data that the teams needed to answer their questions.
There were over 20 participants who were divided into four teams. The teams had a mix of active citizens, urban designers, GIS experts, journalists, policy enthusiasts and those who had experience working with BBMP processes.

Problem Statements
Unlike the previous datajam where the focus was narrow and participants had to rate constituencies on parameters, this datajam had more scope for participants to bring their own knowledge and ask questions that they would like answered, as long as it involved BBMP’s finances and processes.
Based on this, the four teams chose the following problem statements:
- Cess and surcharge collection and utilization by BBMP over the years
- Solid Waste Management (SWM) spending and processes over the years
- Safety and surveillance spending at ward level and correlation with traffic accidents
- Correlation between potholes, spending on potholes and accidents


Outputs
Cess under stress
Aditi Warrier, Sandhya Bhat, V Ramanathan, Sindhura VS, Nithya Gowda and Manjurao Pappanna of Team 1 looked at the cess and surcharges part of BBMP budgets to see how much is being collected each year and where it is being spent.

Cess is an additional tax typically collected for specific purposes. BBMP collects cess as part of property tax. The team found that cess was 45.73% of the property tax collected in 2022-23. However, they noted that it was not clear if the cess was from that year alone or included arrears.

The team visualised how much property tax was collected by different wards in 2018-19.

While latest property tax data was not available, data on cess collection and utilisation was also scant. Some of the cess categories were also unclear in their categorisation.

They urged the municipal body to provide clear and latest data on cess collection and utilisation. They also recommended that cess be better utilized through properly identifying the purpose of the cess, monitoring and evaluation, and involving all the stakeholders.
Solving for SWM
Arnav Harve, Harshitha Padmavinod, Koyal Chengappa, Aishwarya Shekar, Shubhangi Kumari, DR Prakash and Alisha Jane of Team 2 looked at Solid Waste Management (SWM), to understand how much funds are being allocated each year for projects on waste management.

Bengaluru being the third highest waste generator in the country, the team asked what a sustainable SWM system for the city would look like. The team contextualised the BBMP budget for SWM and summarised BBMP’s monitoring efforts in numbers and looked at the state of SWM was in the city.
Using secondary data, the team identified that segregation of waste was a major pressure point for SWM. Their analysis showed that inner localities like Chickpet and Shivajinagar were doing poorly in waste segregation. However, this is based on 2017 data.

The team also found that Dry Waste Collection Centres (DWCC) are unevenly distributed across the city, with 23 of 198 wards having no DWCCs.

They also found that only 1% of the total BBMP work orders they had access to were for SWM and the expenditure was also uneven across the wards. (Note: This analysis is based on work order data available on the BBMP site. It is not complete or comprehensive.)

The team highlighted many failed endeavours. For e.g., kasa kiosks, started in 2019, managed nearly 29 tonnes of waste, until they stopped because of the lack of storage space.
Correlation between accidents, streetlights and surveillance cameras in Bengaluru
Bhanu Sridharan, Ashwini Lotlikar, Debraj Deka, Shashank, Mary Chingthianhoih and Naveen Kumar G analysed BBMP finances looking at safety and surveillance. They attempted to understand if there was any correlation between road accidents and street lighting and CCTV surveillance.

The team looked at the distribution of the funds (work orders) for street lights and surveillance based on BBMP work orders. They found that peripheral areas of the city had more accidents and more vulnerable roads in terms of accidents (based on 2022).

Interestingly, BBMP work orders show that more funds are being allocated for street lights in the accident prone peripheral areas in the north-east part of the city.

Similarly spending for CCTV cameras is currently focused on peripheral areas. Central areas of Bangalore already have a much more established network of CCTV cameras.

Correlating pothole data with work orders and accidents
Anushri Tiwari, Saksham Mishra, Thiyaku S, Ayush Bhosle and Ajith A of team 4 looked at the spatial correlation between pothole presence and accidents. The team also looked for correlation between BBMP pothole work orders and citizen complaints about potholes based on the Fix My Street app.

The team noted that BBMP was spending between Rs. 4 to 25 crore on pothole management but had no data on potholes across the city. They also tracked accident data and noted that peripheral areas had more accident incidents. The data from Fix My Street app also showed that pothole complaints were most in peripheral areas in the north of the city.

Work orders for fixing potholes did not exactly coincide with citizen complaints. Work orders issued for pothole management were concentrated in the peripheral areas of the south.

The team found that 61% of the potholes were for roads with RoW (Right of Way) < 12m. The team noted that most pothole repairs happened in major arterial and sub-arterial roads but citizen complaints were largely from local roads.

In central parts of the city, accidents appeared to have some relationship with potholes.

The team concluded that for effective conclusions, more granular data on accidents, potholes and work orders were required to better understand correlations between them.
Main Takeaways
BBMP’s budgeting, finances and processes affect the daily lives of those who live in Bengaluru in multiple ways. This datajam hoped to get common citizens to look at the spending as well as processes to understand how BBMP works. The goal was to get people to engage with BBMP with what they find and demand better services.
One of the key findings is how less data has been made available by BBMP. For instance, when it comes to SWM, their website has not been updated since 2017, nor is the data available publicly anymore. The same is seen with property tax collection.
The team that analysed cess collection and utilization found that data on how much cess was collected, what was the target, what the actual utilization of the cess was for, and how much was owed to the state and central governments missing. For instance, they noted that people pay both an SWM (Solid waste management) cess and a garbage cess – both seem to mean the same thing.
Having more and better data out in the public domain can help citizens engage better with BBMP as well as drive efficiency, accountability and transparency.