
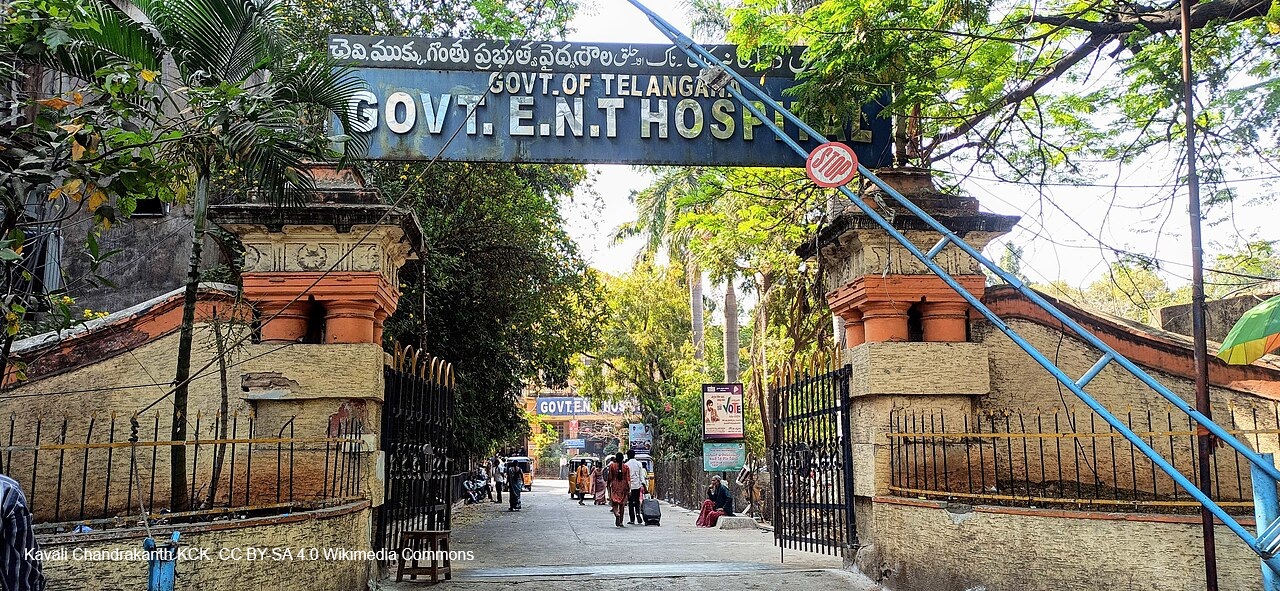
The Household Social Consumption: Health Survey conducted by the National Statistics Office (NSO) of the Ministry of Statistics and Program Implementation (MoSPI), Government of India, captures details of how households in India are spending money on healthcare. The latest survey from 2025 records data on hospitalisation, outpatient care, medicine purchases, health insurance, maternal health, and the financial arrangements families make to cover medical expenses.
The survey covers a representative sample of households across the country, and for this analysis, we will look at how the major cities in India – Bengaluru, Chennai, Delhi, Hyderabad, Mumbai and Pune compare with each other across six facets of healthcare: average hospitalisation cost, choice of public versus private facilities, health insurance coverage by social group, the most common reasons for hospitalisation, how private hospital care is financed, and the cost of childbirth.
As the sample size for Hyderabad is very small and inadequate to make any feasible conclusions, we have used the Rangareddy district data as it gives a reasonable sample size in comparison to the other cities.
Types of Hospitals
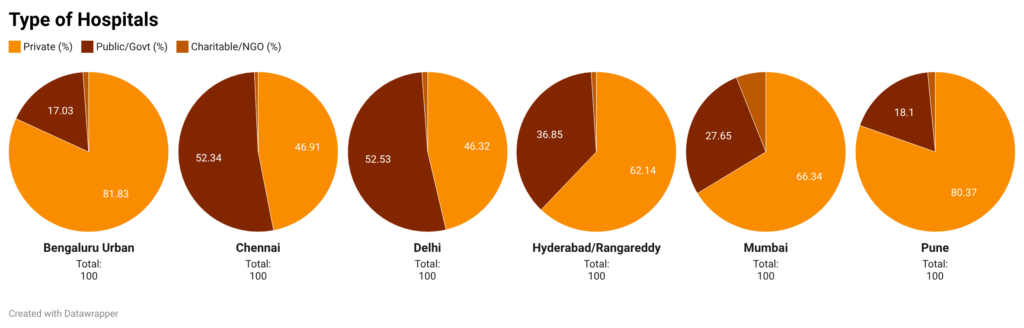
While there has been a shift of healthcare from private to public hospitals, the shift looks different in different cities.
Bengaluru’s and Pune’s private hospital sector dominates completely, with 82% and 80% of hospitalisations occurring there. On the other hand, the majority of the patients in Chennai and Delhi seem to prefer public and government hospitals, and this may indicate a better quality of public healthcare there.
NGOs see incredibly infrequent use rates, with it being mostly negligible except for Mumbai’s 6%. Hyderabad sits in the middle, with 62% going private and 37% going public, so it is not as extreme as Bengaluru or Delhi. Mumbai’s 6% NGO rate is the only meaningful use of charitable hospitals across all six cities.
Average Hospitalisation Cost
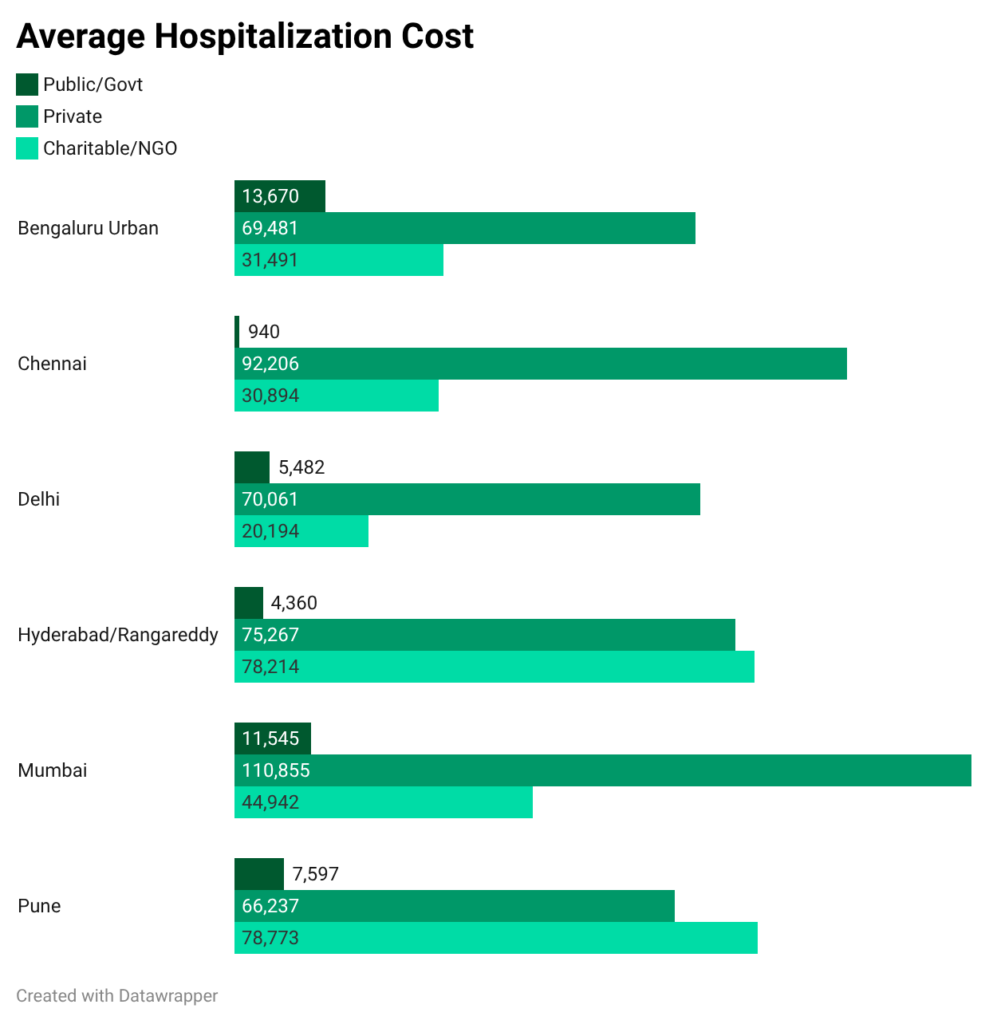
Expectedly, the survey showed a vast gulf between the costs in private and public hospitals. Even among private hospitals a patient on average was paying vastly different amounts.
Mumbai and Chennai were seen to have especially high average private hospital costs at about Rs. 111,000 and Rs. 92,000 respectively. Interestingly, Chennai’s public hospital costs are the lowest among the cities, at Rs. 940.
The charity-funded or NGO hospitals seem to generally fall into the middle of the price range, and the extremely high private cost in Mumbai could be a reason why a larger share of the population prefers them. Overall, Mumbai has the highest weighted average hospitalisation cost at about 79,000 INR while Delhi is the cheapest at 36,000 INR.
Health Insurance Coverage by Social Group
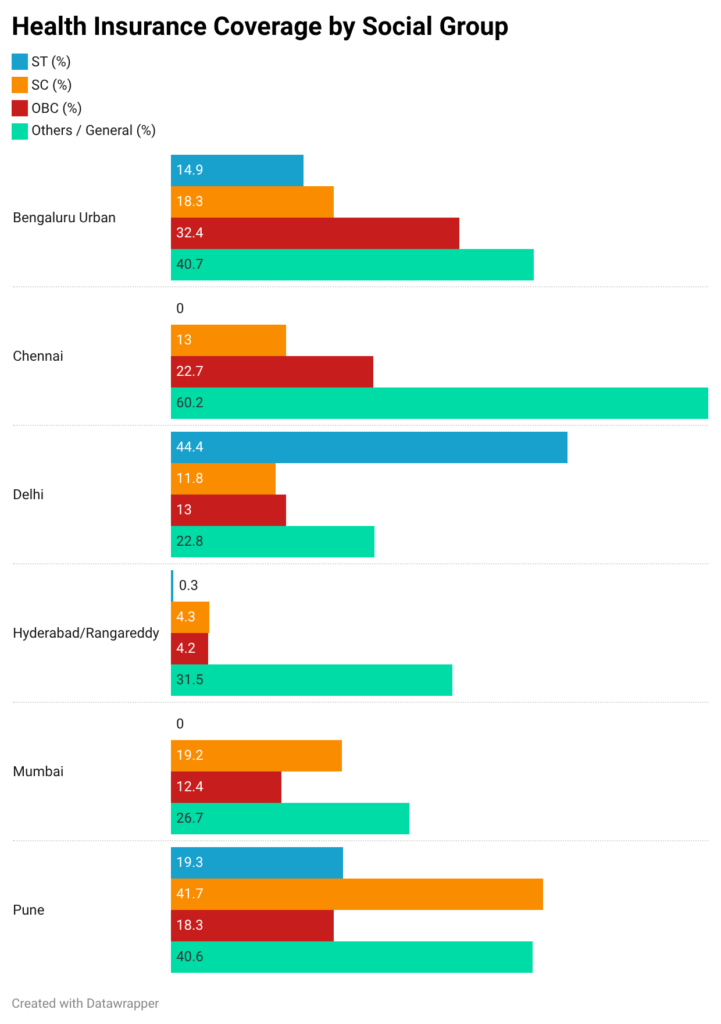
With such a high cost of healthcare, how well is the insurance coverage among the people and how does it vary across different social groups?
The first thing that stands out is that the scheduled tribes (ST) have next to no health insurance in Chennai, Hyderabad/Rangareddy, and Mumbai, but are the most well-covered group in Delhi.The scheduled castes (SC) see 42% coverage in Pune, which is more than double that of the other cities; another interesting outlier. Pune and Bengaluru seem to be the two cities with the overall best coverage for these social groups.
The biggest gap is the OBC category: 32% coverage in Bengaluru compared to just 4% in Hyderabad. Also, the gap between cities is widest for ST households: 44.4 % coverage in Delhi compared to 0.3% in Hyderabad. Hyderabad has the lowest coverage across every social group, suggesting the issue is systemic rather than limited to one community.
Source of Finance for Private Hospital Patients
With such poor coverage of insurance, and high cost of hospitalisation, how are families covering hospitalisation costs?
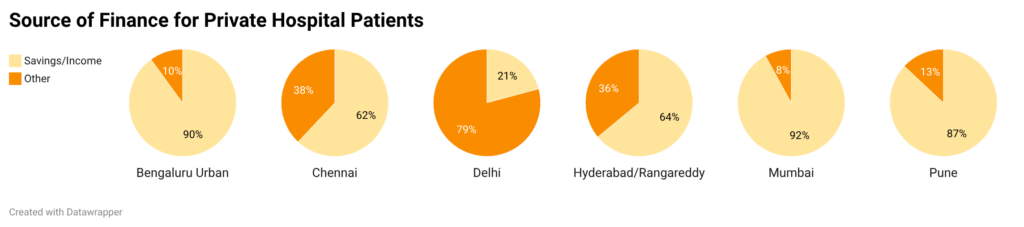
In all the cities families are forced to dip into their savings to finance hospitalisations. While in Delhi, Bengaluru, Mumbai and Pune savings almost entirely fund healthcare, in Chennai and Hyderabad area there is a much larger portion of patients financing hospitalisations by borrowing and other means, suggesting higher overall debts in these areas for medical care. The data is concerning how hospitalisations can deplete savings and investments of families and, worse, push them into debt traps.
Top Reasons For Hospitalisation
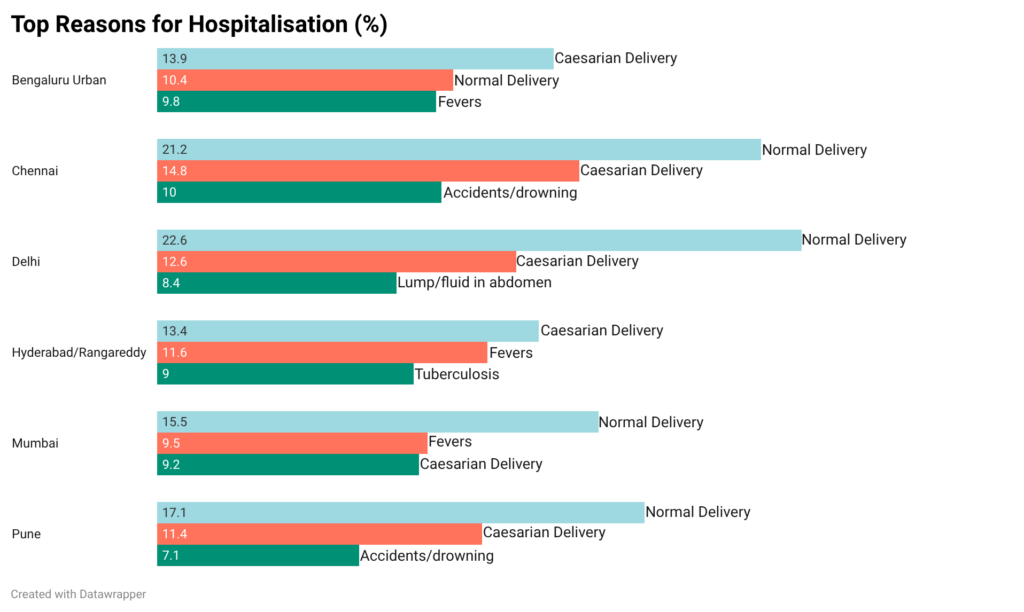
Childbirth is the most common reason for hospitalisation, with either normal delivery or C-section delivery taking the biggest share. In Delhi and Chennai, patients overwhelmingly come for normal delivery, with both cities seeing 20% of the share taken up. Accidents/drowning finds itself in the top 3 in both Pune and Chennai, a logical observation due to their proximity to water bodies and beaches. Unusually however, it is not seen in Mumbai’s top 3. We also can see that Hyderabad/Rangareddy is the only region where tuberculosis is in the top 3.
Average Cost of Child Delivery in a Hospital (INR)
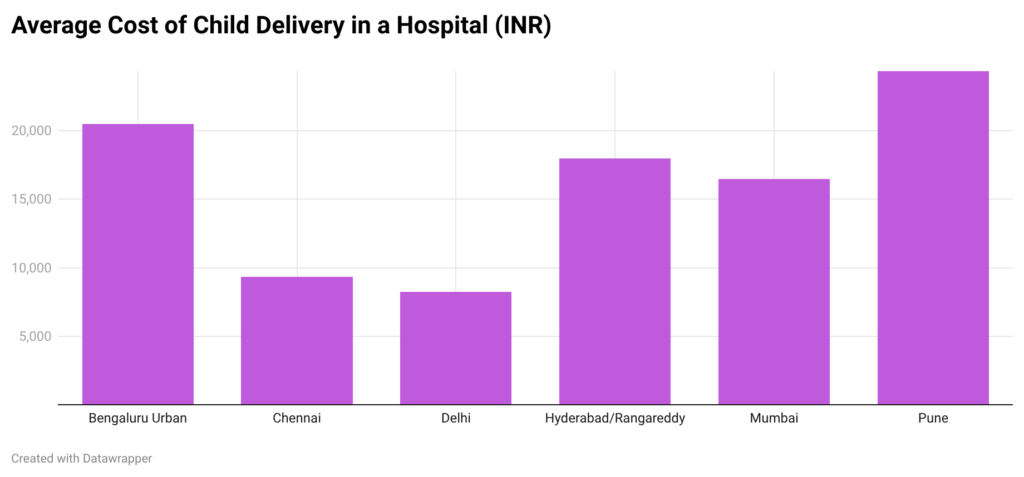
With childbirth being the main reason for hospitalisation in the cities, how expensive is it to give birth in an Indian city?
Pune and Bengaluru are the most expensive cities for child delivery, with average costs being 20,000 and 24,000 INR respectively. Chennai and Delhi are comparatively cheaper, and this ties into the fact that we saw the majority of cases are treated in public hospitals. The costs we see here are also alluding to what we saw in the hospital usage data, where Bengaluru and Pune have a high share of cases being private hospitals i.e. higher costs.
Conclusions
The HCES health survey gives us a window into how much it costs to get sick in Indian cities and how families manage those costs. Private hospitals dominate treatment in most cities but are much more expensive, and households mostly pay out of their own pockets. Public hospitals are a very important cheaper alternative in Delhi and Chennai, while insurance coverage especially for marginalised groups still has a long way to go in cities like Hyderabad. Childbirth, the single biggest reason for hospitalisation, also varies greatly in cost between the cheapest and most expensive cities, reflecting how much the choice of facility and type of delivery will have an impact on the total payment.