
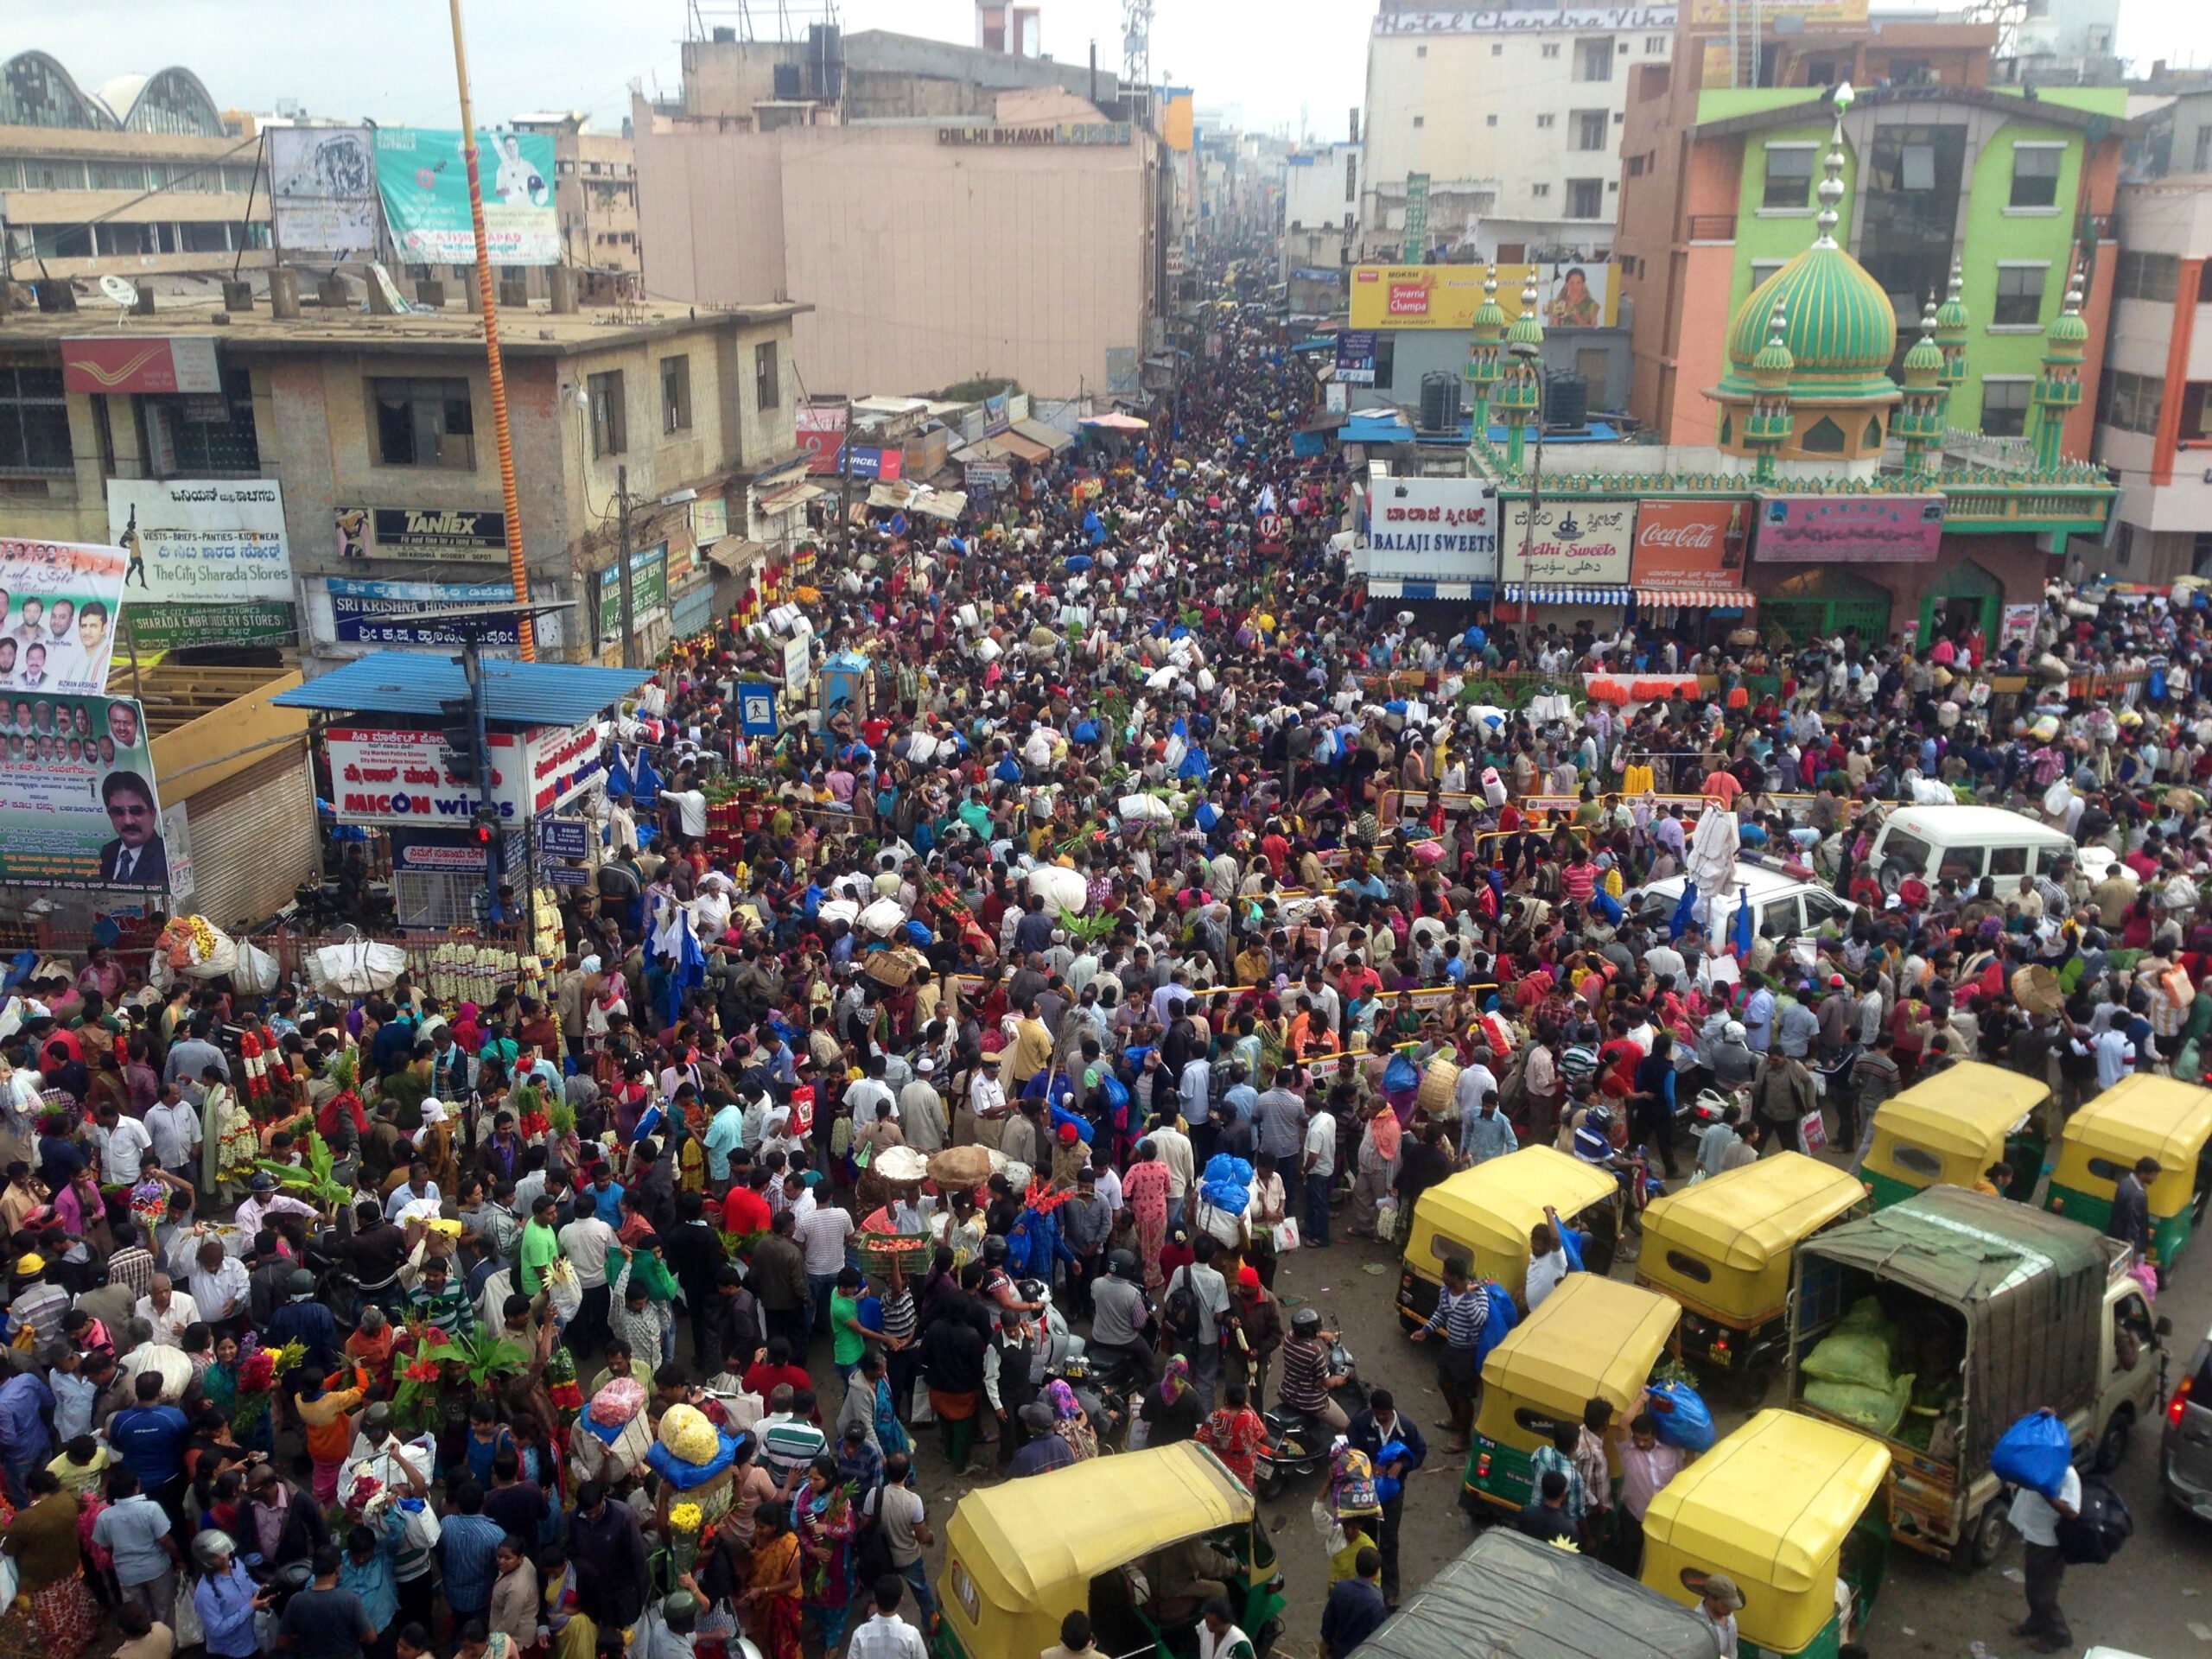
The Household Consumption and Expenditure Survey (HCES) conducted by the National Statistics Office (NSO) of the Ministry of Statistics and Program Implementation (MoSPI), Government of India, captures details of how households in India are spending money. Capturing total expenditure, expenditure on individual items, and specific categories of expenses were the main goals of this survey.
In the latest round conducted in 2023-24 the survey also tries to capture the shift of consumption towards e-commerce by measuring how much households are spending online. It also looks at gains to households from subsidies and welfare from governments in the form of free items like educational materials, gadgets or vehicles.
In this analysis we look at how the major cities in India – Bengaluru, Chennai, Delhi, Hyderabad, Kolkata, Mumbai and Pune compare with each other in terms of household expenses and their components like rent, transport education etc. We also look at the spending on e-commerce in these cities and access to subsidies.
Since the sample size for Hyderabad is very poor, around 36 households in total, we have used data from Rangareddy which has a sample size comparable to other cities for the analysis. All mentions of Hyderabad in the analysis below refer to the samples from Rangareddy district.
Expensive cities
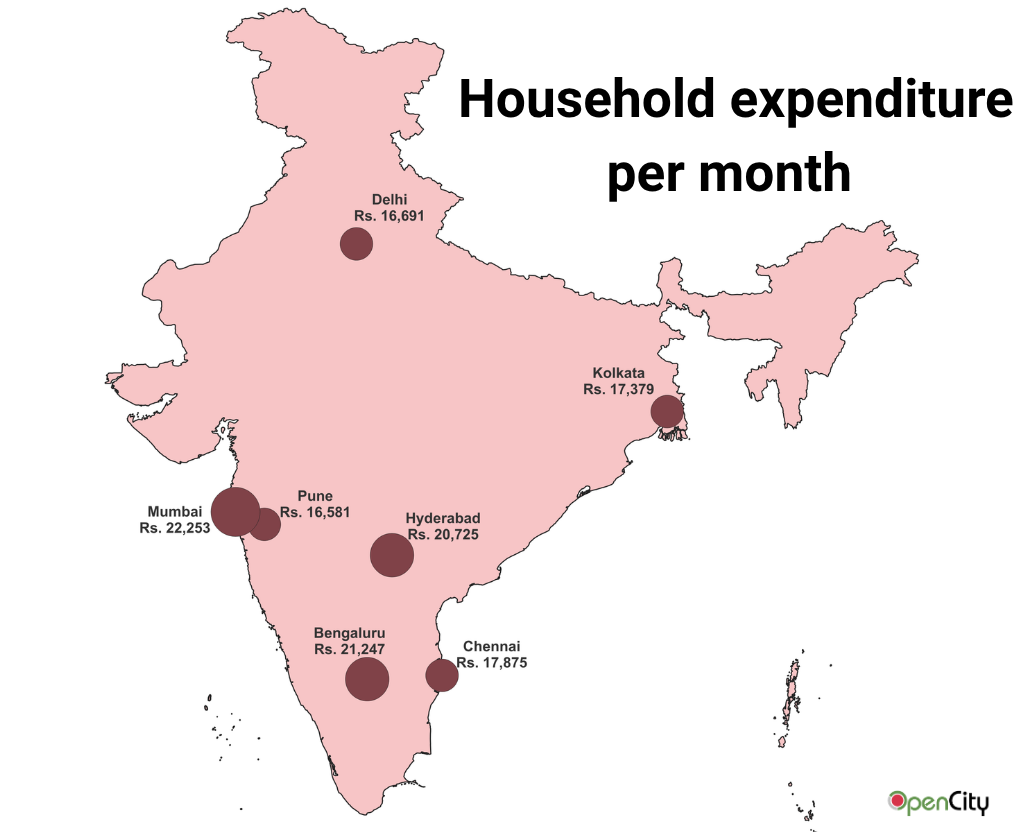
It costs more than Rs. 16,000 for a household to survive in an Indian metro. Of the metros, Mumbai and Bengaluru are the costliest to live in, costing more than Rs. 22,000 and Rs. 21,000 per month respectively. Hyderabad is the only other city to cost over Rs. 20,000.
Pune and Delhi are the least expensive, costing less than Rs. 17,000 per month followed by Kolkata and Chennai at under Rs. 18,000.
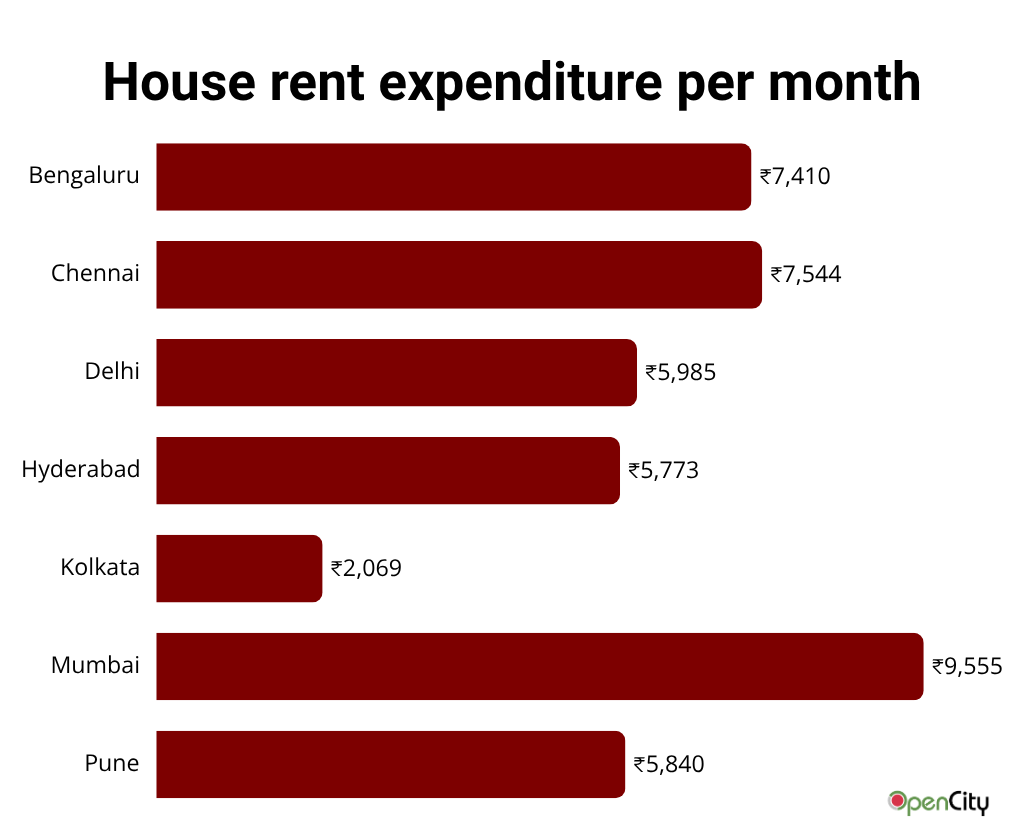
One of the biggest expenses in large cities is housing. Across all cities households spend a large chunk of their income on housing. Mumbai is the most expensive of the cities, costing just under Rs. 10,000 to afford a place to live.
Mumbai is followed at a distance by Bengaluru and Chennai where it costs around Rs. 7,500 to rent a place to live. Kolkata is the cheapest where households spend just over Rs. 2000 on average.
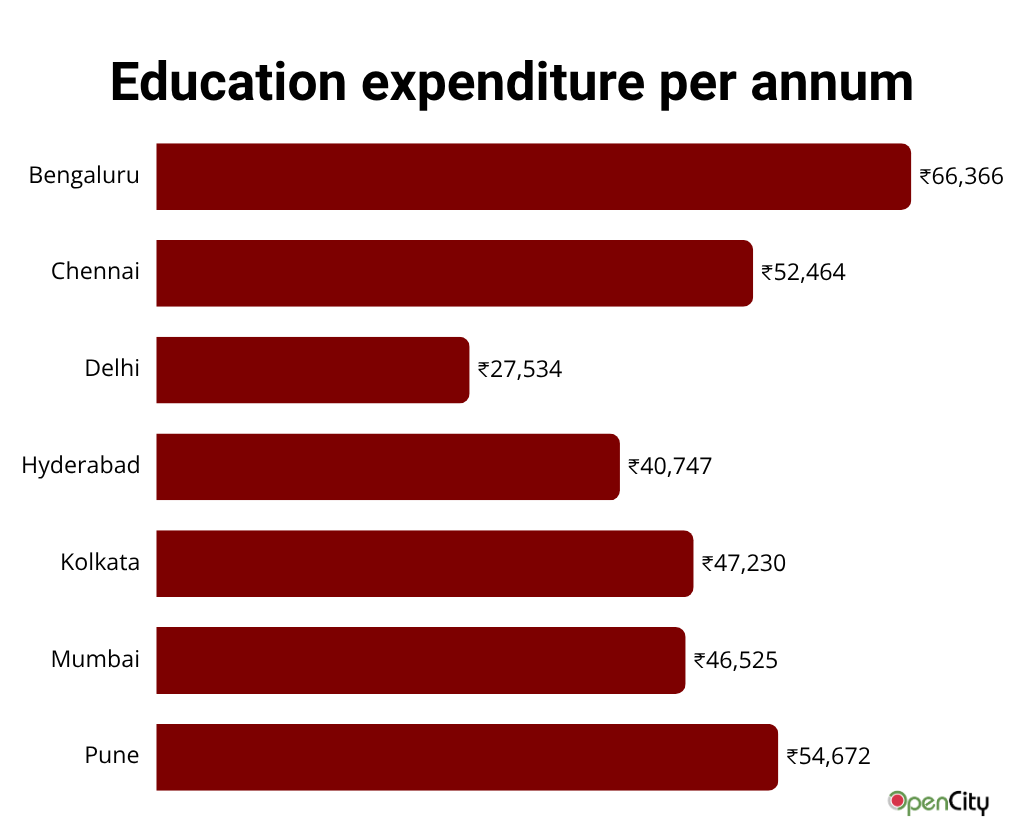
Households with children spend a large amount on education. The survey captures education expenses at an annual level. Bengaluru is the most expensive city to educate children costing a household Rs. 66,000 per annum followed by Mumbai and Chennai at Rs. 54,000 and Rs. 52,000 respectively. In the rest of the cities it costs less than Rs. 50,000 for education.
Note that the survey captures only the spending of each household on education, not per child. The cost is thus the average spending of a family on education each year. The survey also tries to find where the children of a household are being educated, whether in private or government schools, and the findings show that it is a mixed bag. While some families have enrolled all their children in government or private schools, some households with more than one child enroll them in different types of schools. The number of children also varies across households.
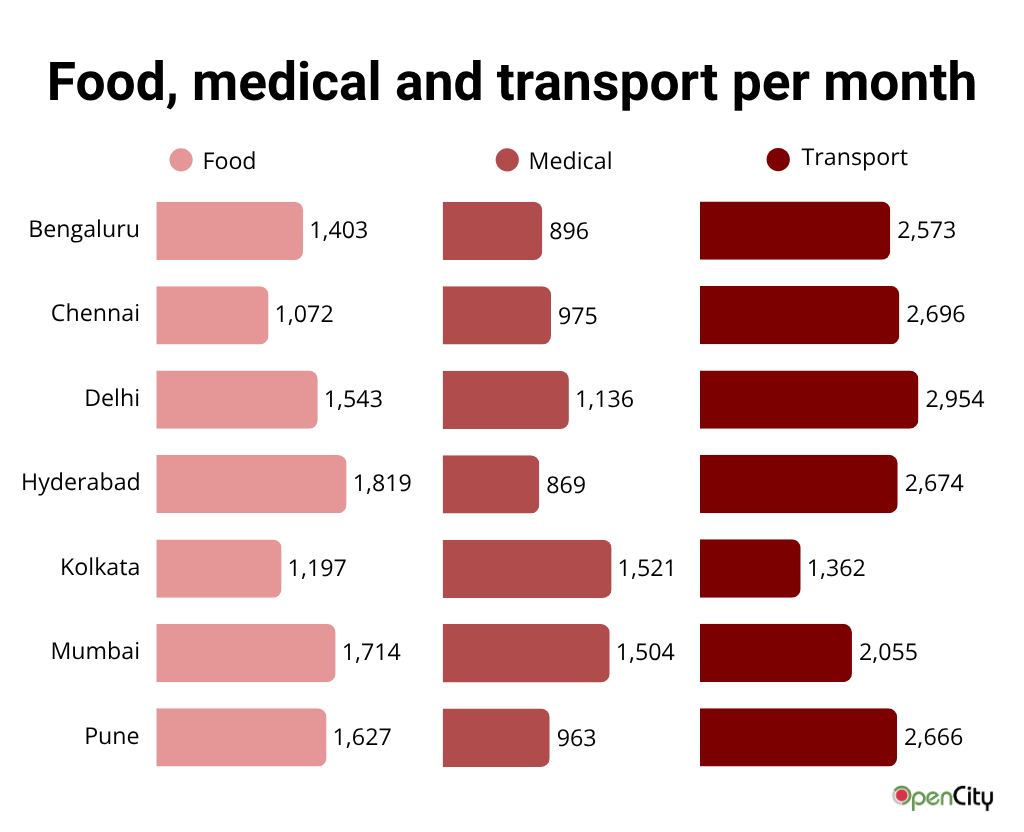
Food, transport and increasingly medical expenses form a large chunk of a household’s expenditure. While households spend on average between Rs. 1000 and Rs. 2000 on food in Indian cities, it is cheapest in Chennai at just over Rs. 1000 and most expensive in Hyderabad at almost Rs. 2000.
Household non-hospitalisation medical expenses vary across cities. Households in Hyderabad and Bengaluru spend the least at less than Rs. 900 per month, while a household in Mumbai and Kolkata is forced to spend more than Rs. 1,500 per month. Delhi is the only other city where medical expenses cost more than Rs. 1,000.
Transport is expensive across most cities, costing more than Rs. 2,500 in all cities except Chennai and Kolkata. While it costs just over Rs. 2000 in Chennai, in Kolkata transport remains the cheapest with an average household spending just Rs. 1,362, less than half of Delhi.
Online spending
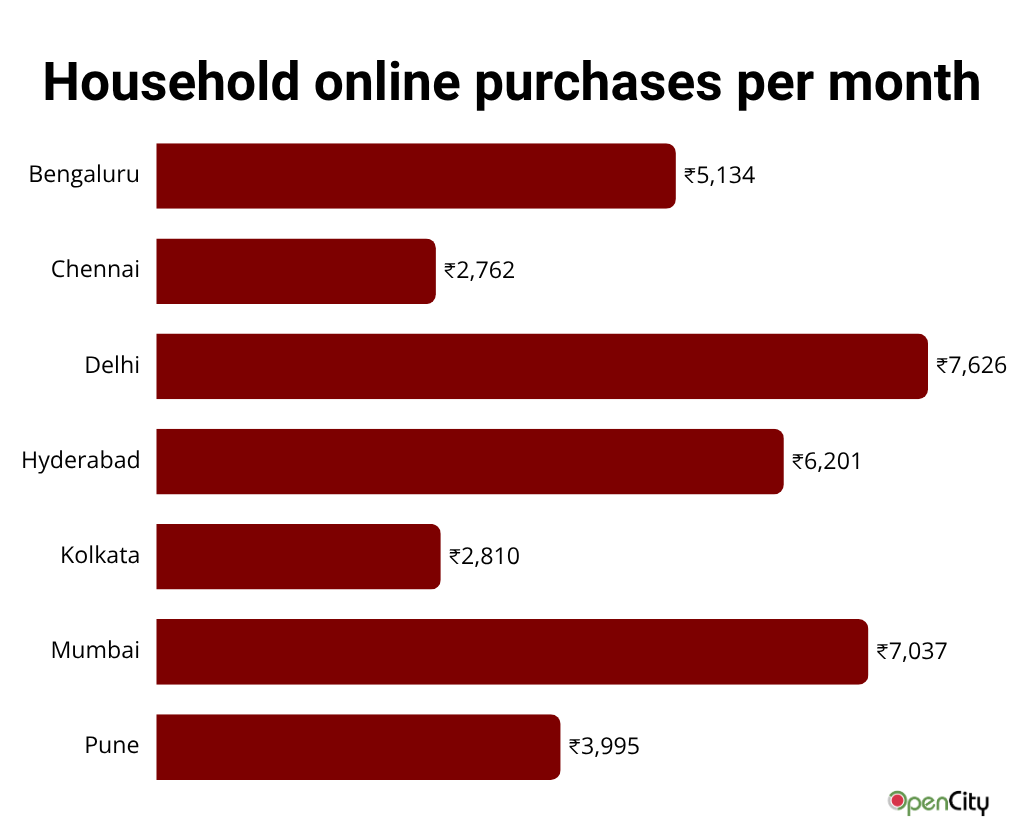
Online spending has become an integral part of a household’s expenditure. However, there is a large variance in how our cities spend on buying things online. While a household in Delhi or Mumbai spends more than Rs. 7,000 per month online, its counterpart in Chennai and Kolkata would spend only 20% of it, around Rs. 2,800. Households in the IT capitals Bengaluru and Hyderabad spend Rs. 5000 and Rs. 6000 respectively.
Energy subsidies and welfare
While there is a fair amount of discussion on the prevalence of “freebies” in the form of handouts to people, the survey shows otherwise. Free items for education like school bags, books or uniforms are present across most cities, but the number of households that received them are in single digits in all cities except Hyderabad and Pune.
While 209 households in Hyderabad received some form of educational support, that number was 88 in Pune. Free gadgets like mobiles and laptops were received by barely one or two households across the cities. No households received vehicles, except one of two receiving bicycles in Chennai and Kolkata. The data was too negligible to generate charts.
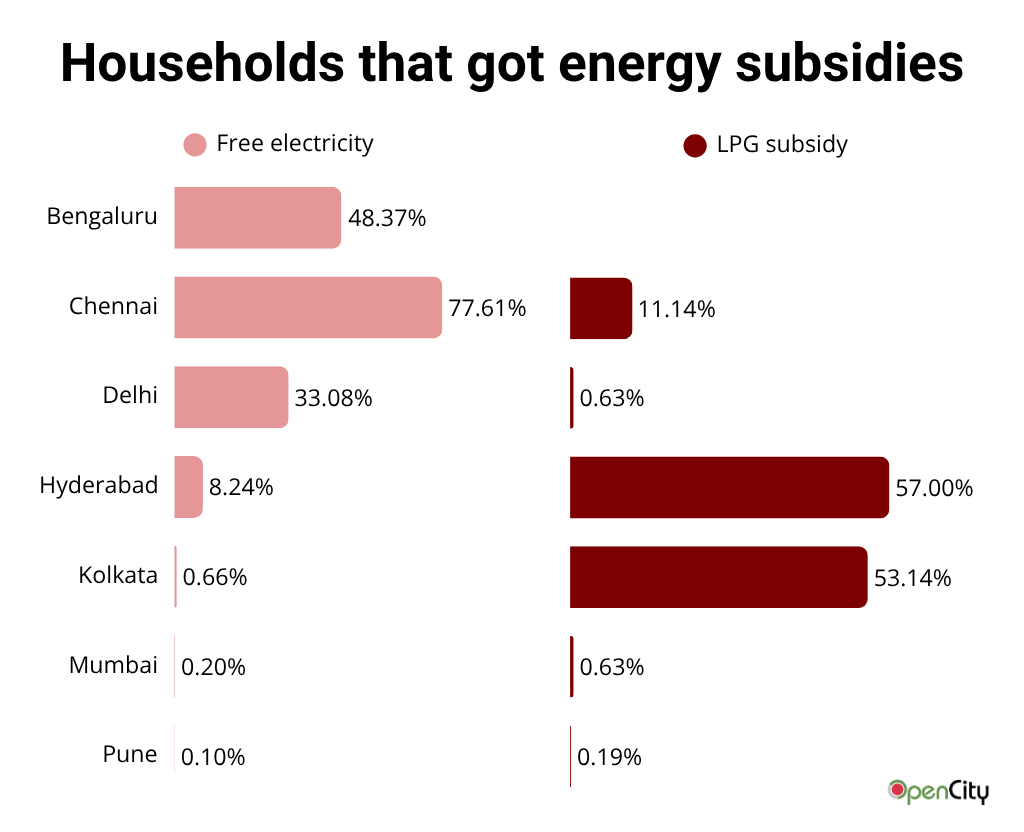
However, subsidies like free electricity and LPG subsidy are received by households in different cities at different levels. State governments in Karnataka, Telangana, Tamil Nadu and Delhi have provided free electricity up to a certain number of units and the survey reflects that.
However, the implementation is different in each of the states. In Chennai where the subsidy is available to all domestic connections without opt-in, the uptake is much higher with 77% of the households benefiting. In the case of other cities where it is opt-in or registration based, the usage dips. In Hyderabad despite the scheme being similar to Bengaluru the uptake is less than 10%.
LPG subsidies are offered by the Central government, but there is a wide variance in households receiving them. While more than half the households in Hyderabad and Kolkata received the LPG subsidy not a single household in Bengaluru recorded receiving it. In Delhi, Mumbai and Pune less than 1% of the households received any subsidy for LPG.
The HCES provides a window into how households are doing financially and where their money is going. Higher expenses for transport suggests an immediate intervention. Our cities also record high medical expenses, which is a factor of the general quality of life in terms of air, water, sanitation etc.
While the discourse is about a large increase in “freebies”, the survey does not find the prevalence as much. Few families, if any received any goods as handouts. The survey records only subsidies from governments in the form of electricity and LPG. Reach of cash-transfer based welfare schemes was not recorded.