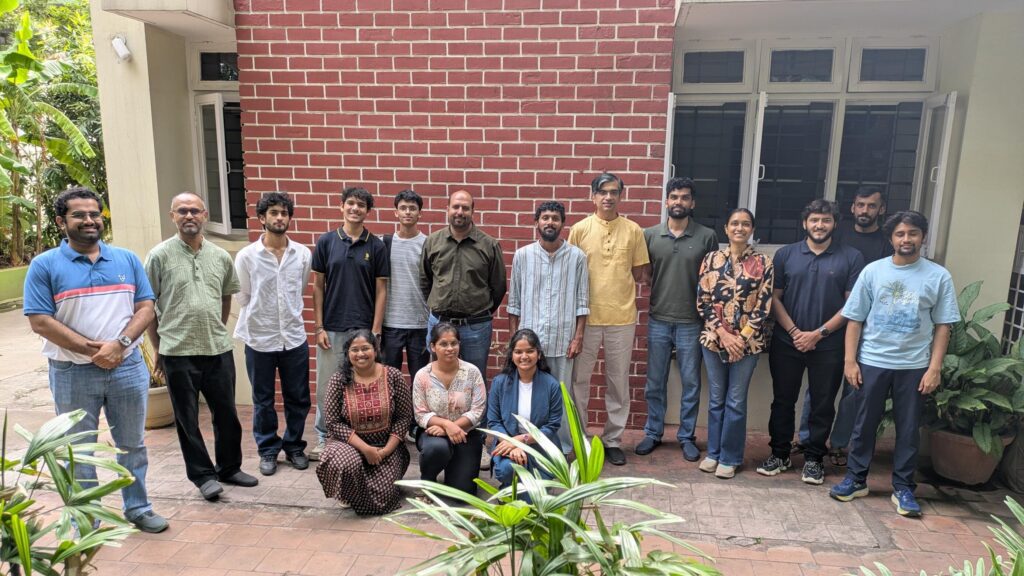
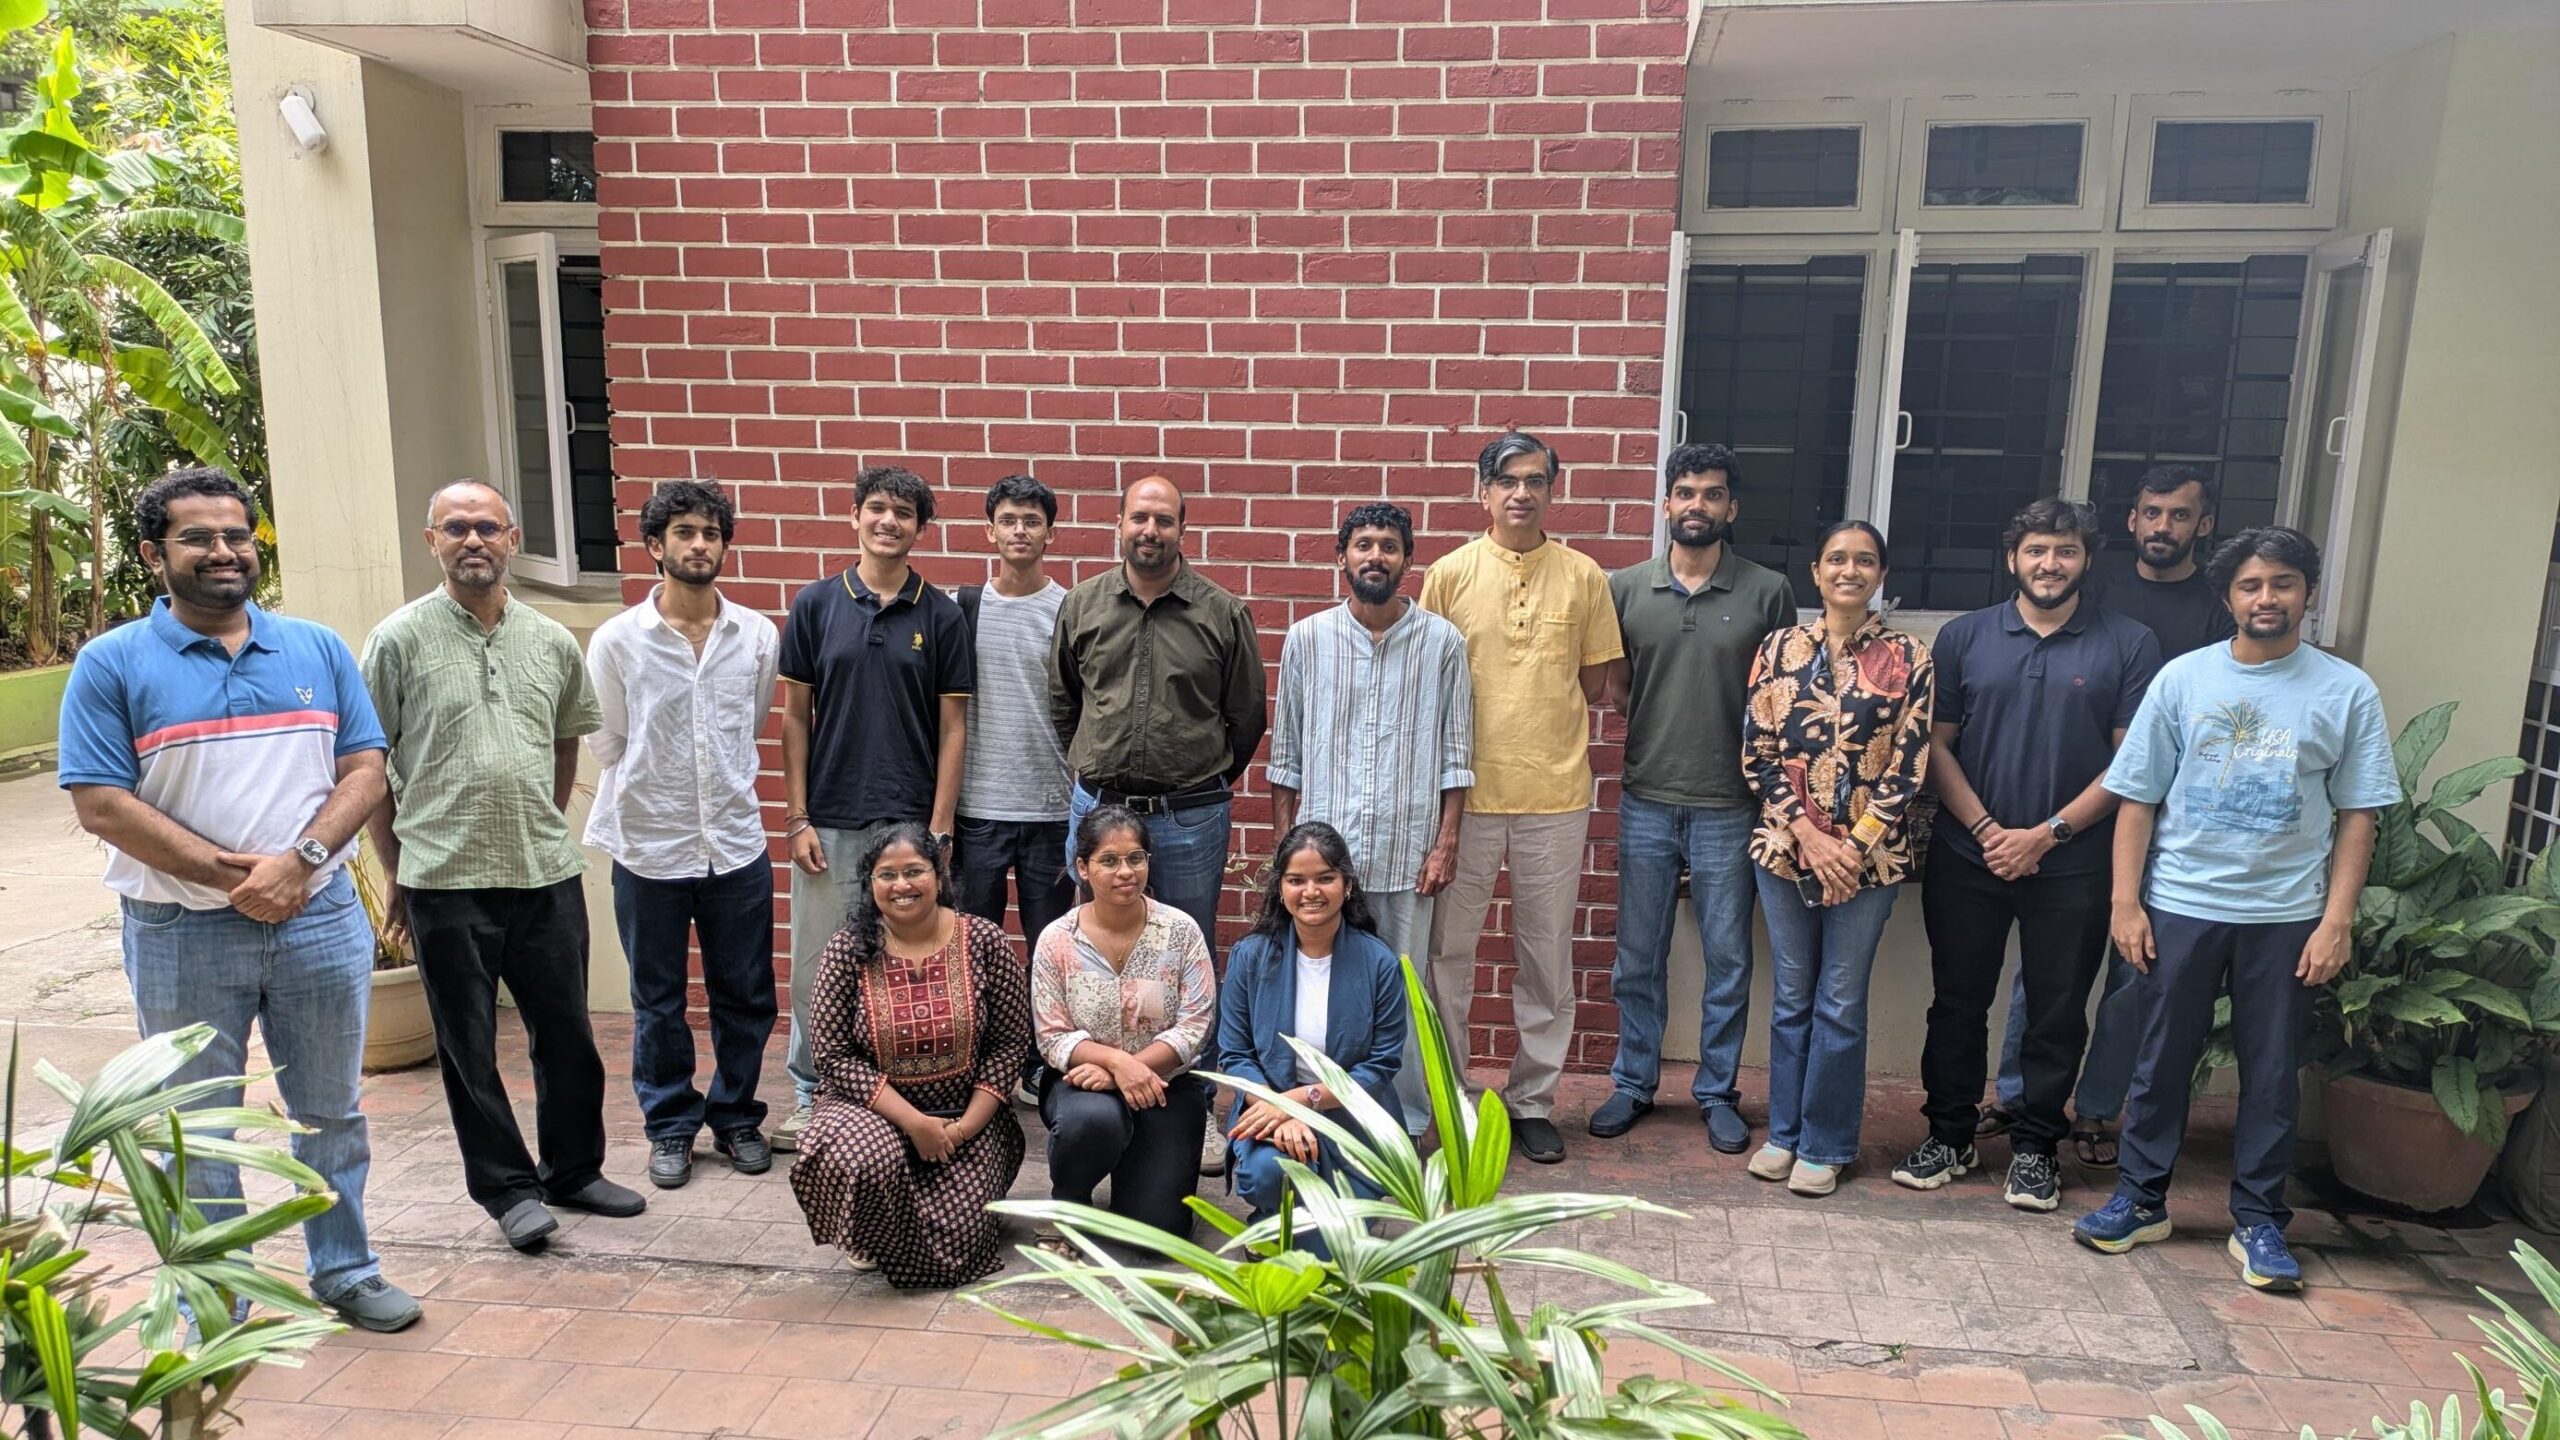
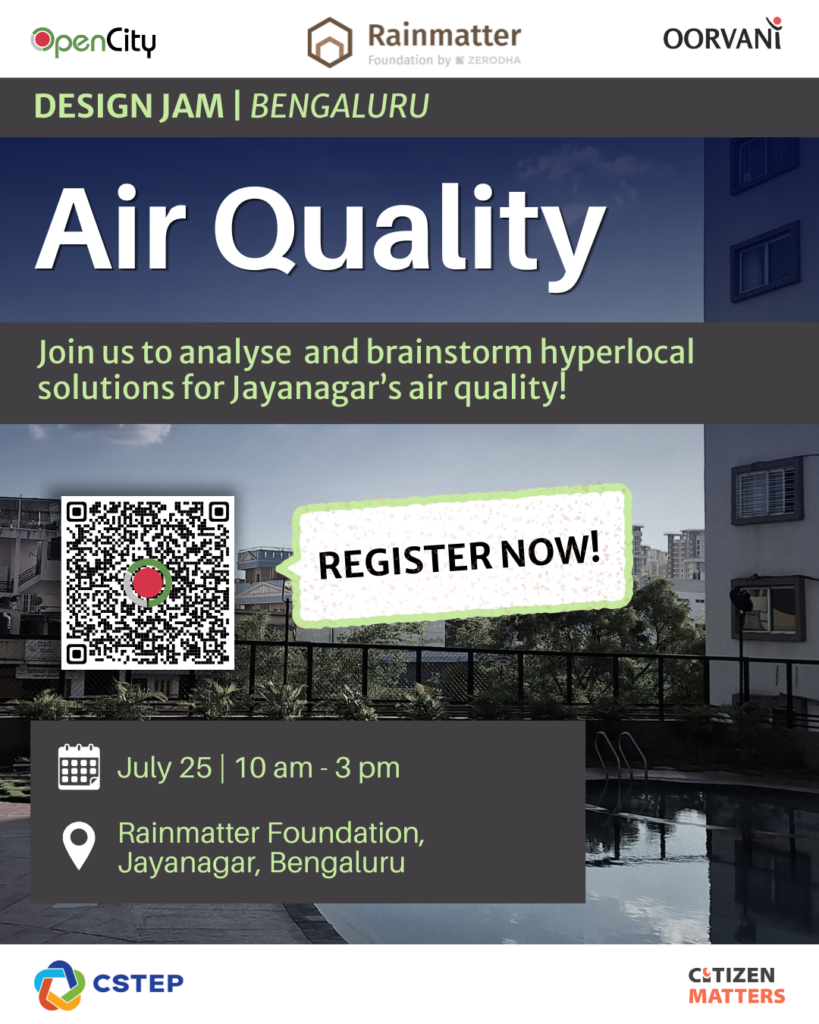
On the 25th July 2026, OpenCity organised the Hyperlocal Air Quality Design Jam focused on Jayanagar. The event was organised in collaboration with Rainmatter Foundation and CSTEP and was held at the office of Rainmatter Foundation in Jayanagar.
The participants were expected to analyze hyperlocal air quality data from one specific monitor, look at how air quality varies over time and draw correlations with daily activities, seasonal trends, construction, burning of waste, traffic patterns, and other human activities.
Participants were provided with a set of datasets that included:
- Pavitra Dashboard (CSTEP) — An interactive simulation tool that allows users to model hypothetical policy outcomes, such as reducing private car emissions by a set percentage, and observe the resulting changes in air quality composition at the country, state, district, and GBA zone level using interactive sliders.
- OAQ Notif Dashboard (Rainmatter foundation) — A dashboard for visualising and exploring trends from individual air quality monitors over days, weeks, and years.
- A list of OpenCity datasets on air quality and related variables including vehicle registration data, construction activity, and other civic datasets.
Hyperlocal Air Quality Datajam
The jam brought together 13 participants from diverse backgrounds such as software developers, environmental engineers, students, researchers, etc. The participants were divided into four teams who looked at different problem statements related to air quality in Jayanagar.
Problem Statements
- Making air quality data relatable to the public
- Correlating air quality with school activity and traffic
- Seasonal variations in AQI at Jayanagar 5th Block
- Source apportionment of air pollutants
Outputs
Making Air Quality Data Relatable
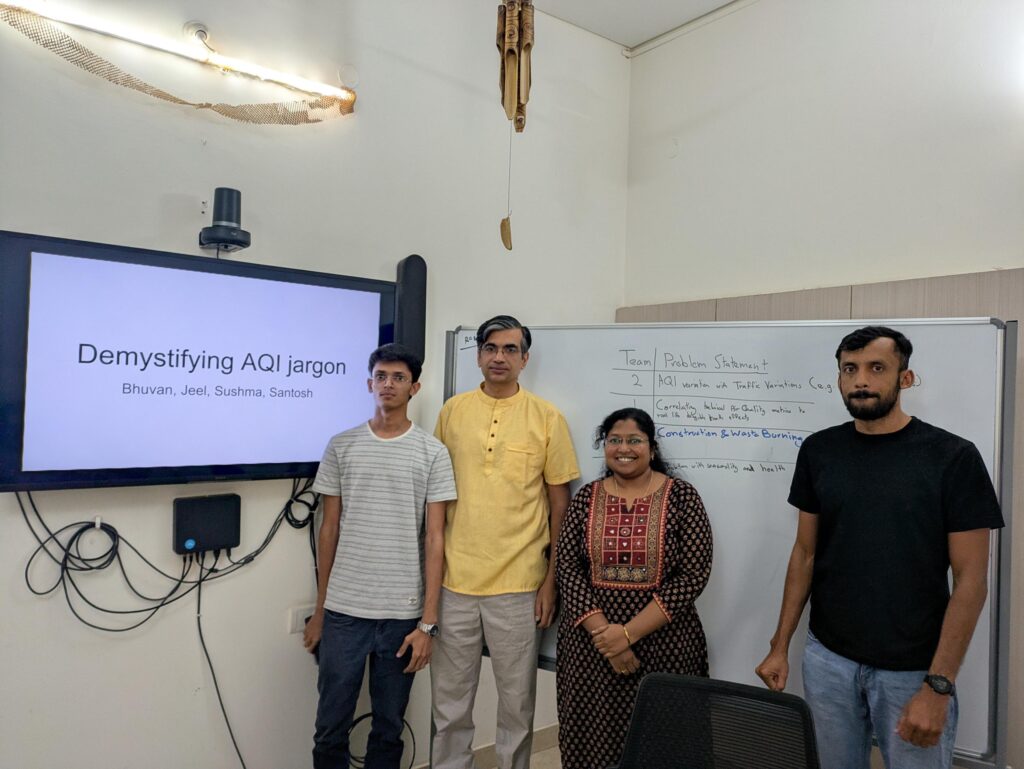
Bhuvan, Jeel, Santosh,, Sushma tackled the challenge of making complex air quality data understandable to everyday citizens. They presented raw PM2.5 or NO2 values, which mean little to most people, and developed a simulation interpretation layer for tools like the Pavitra and NOTF dashboards.
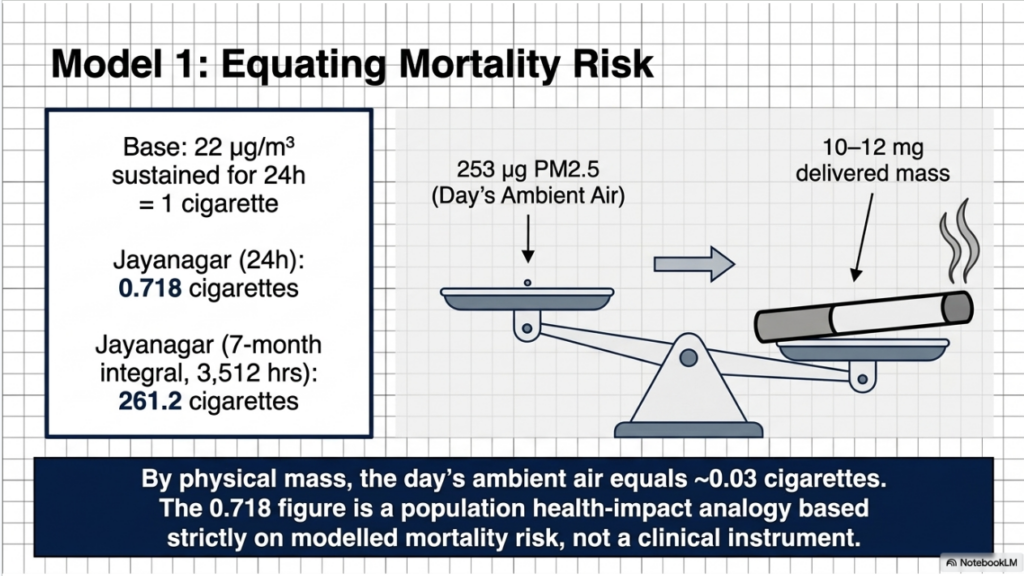
Using the Berkeley Earth model, they translated concentration values into three relatable metrics: the equivalent number of cigarettes smoked (living in Jayanagar for a year is equivalent to smoking 647 cigarettes, or about 1.8 cigarettes a day), life expectancy lost due to long-term exposure (approximately 17 days lost per year, or about 3 years over a lifetime in Jayanagar), and the percentage of inhaled particles that remain in the lungs and enter the bloodstream.
School Activity and Air Quality
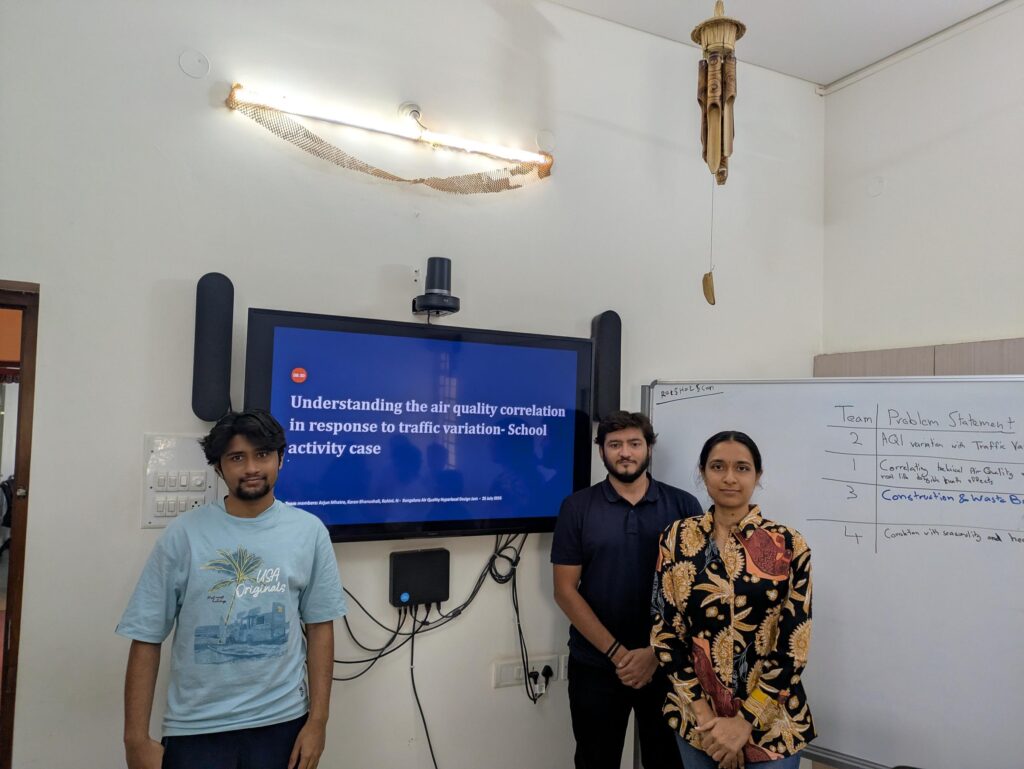
Arjun, Bhanushali and Rohitni explored whether school activity, particularly school buses and drop-off traffic, has a measurable impact on local air quality. They noted that Jayanagar has medium-to-high government school density, a significant traffic corridor, and is predominantly residential with low industrial activity, making it a cleaner environment to isolate the school variable.
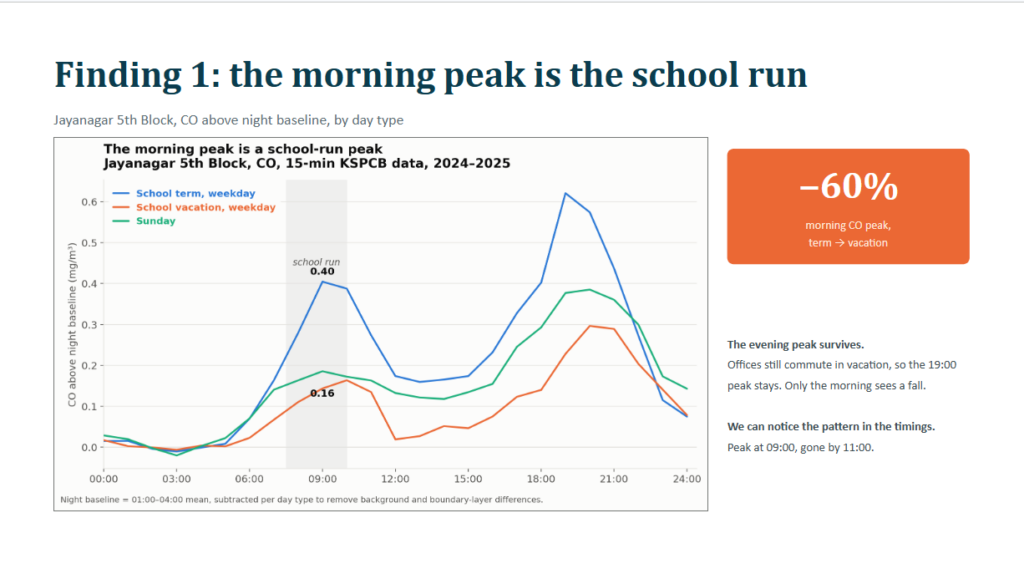
Comparing AQI data across school term weekdays, weekends, and school vacation weekdays, they found a 40–60% gap in morning CO peaks between school term and vacation days. They also used the Pavitra dashboard to model what would happen if diesel buses were reduced by 60% and private vehicles by 30% in a school vacation scenario, finding a notable drop in NOx levels.
Seasonal Variation in AQI
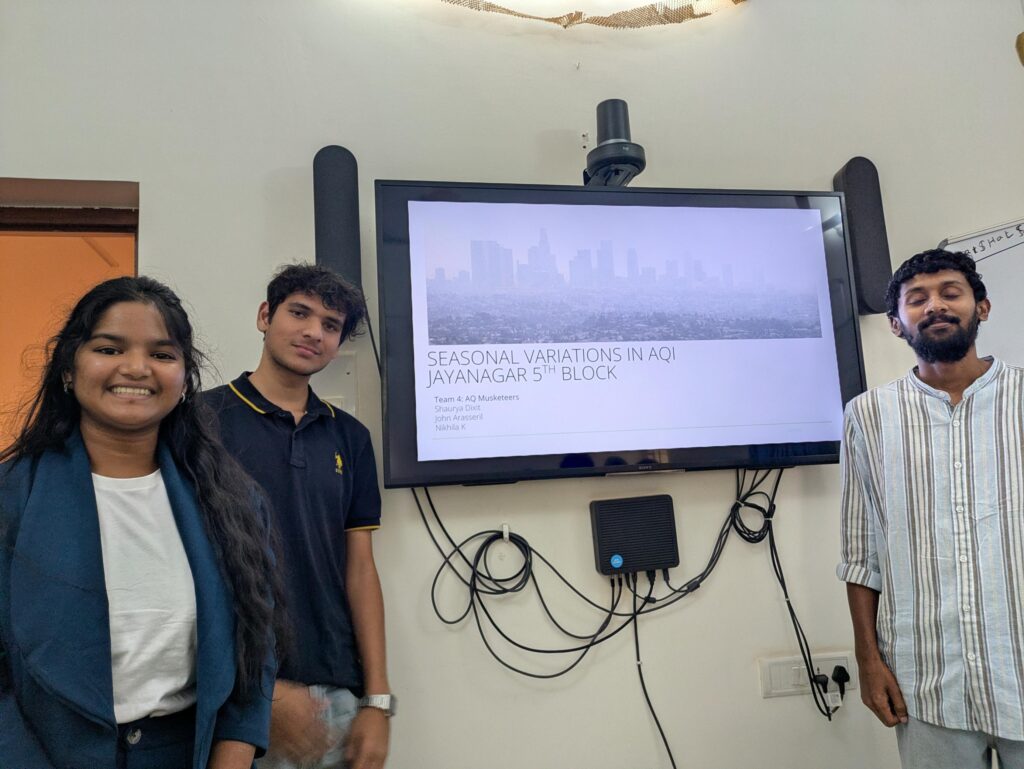
John, Nikhila and Shaurya analysed how air quality at Jayanagar 5th Block varies across four seasons; summer (March–May), monsoon (June–September), post-monsoon (October–November), and winter (December–February), using data from NOTF, CPCB, and KSPCB, as well as health impact modelling through an online tool by TERI (The Energy and Resources Institute).
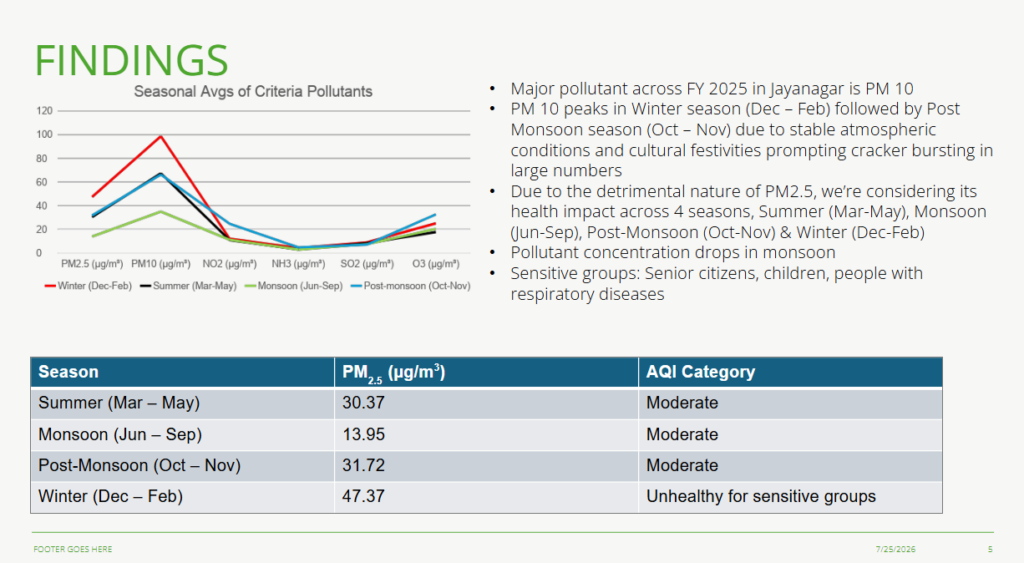
Their key finding was that PM10 consistently dominates as the major pollutant across all seasons, with winter being the most dangerous period, AQI reaches unhealthy levels due to poor air mixing at low temperatures, with 47.1% of winter days classified as unhealthy for sensitive groups. The team also discussed the broader policy and urban planning challenges driving air pollution in Bengaluru, including poor chimney regulation enforcement, unplanned urban growth, loss of lakes, and interstate migration adding pressure to the city’s resources.
Source Apportionment
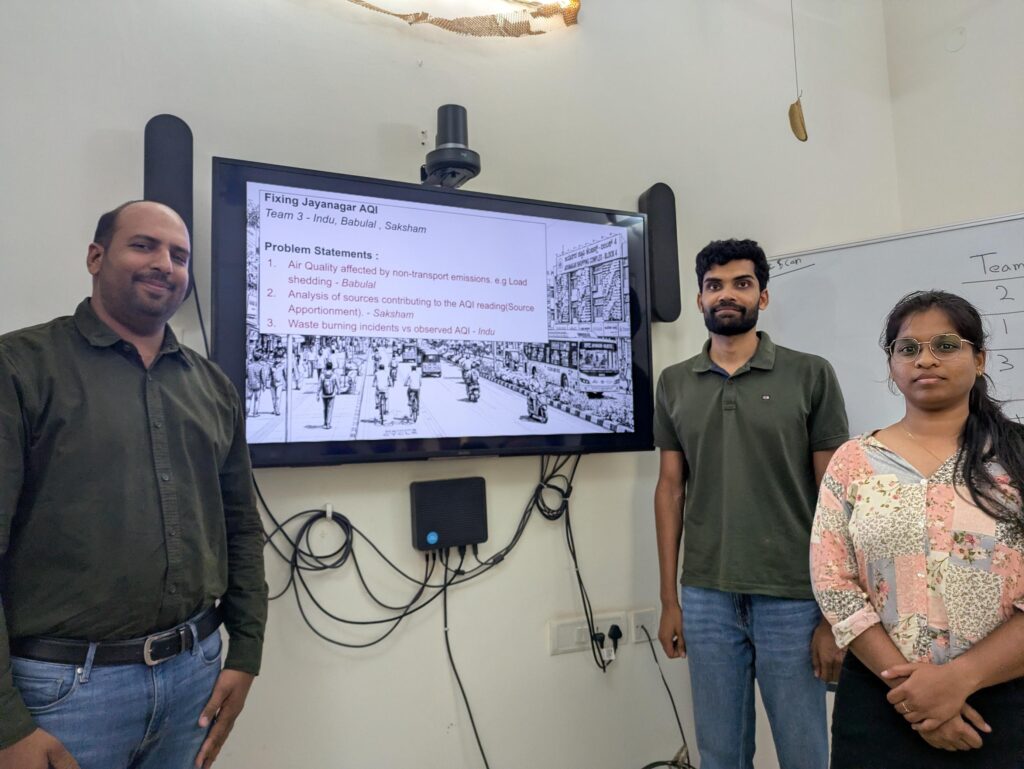
Babulal, Indu and Saksham presented three different problem statements. One identifying what proportion of air pollution comes from different sources such as traffic, dust, industrial activity, and open burning. Using Non-negative Matrix Factorisation (NMF), they worked backwards from the pollutant data to identify four probable source categories, distinguishing between them using the ratio of PM10 to PM2.5 (higher ratios suggesting dust; lower ratios suggesting vehicle combustion) and the presence of sulphur dioxide as an industrial marker.
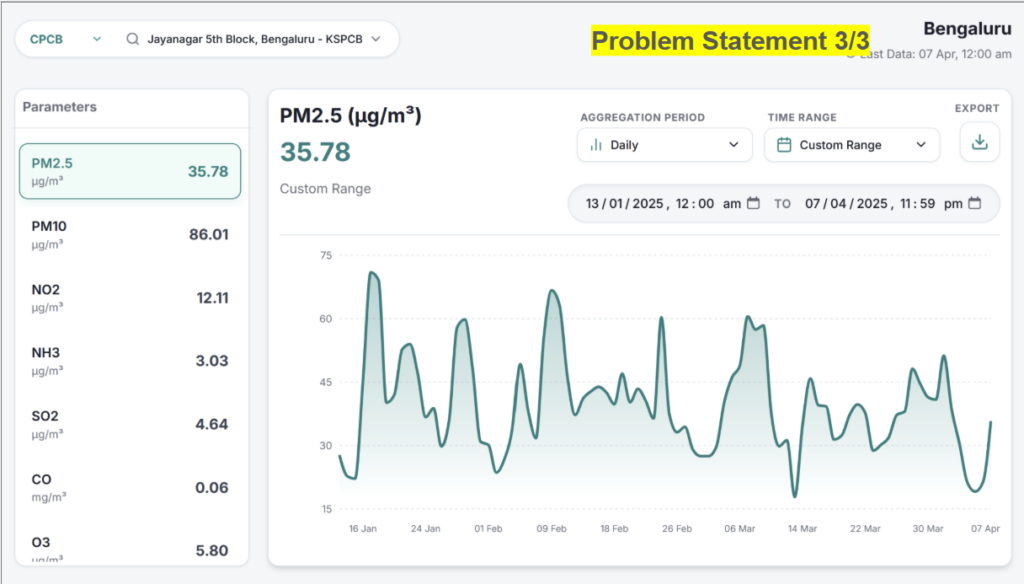
The team also explored a correlation with open burning incidents from the BBMP grievances data with spikes in PM2.5 values, finding that PM2.5 exceeded 50 on every reported open burning date.
Key Themes Across the Day
A few threads ran through all four presentations and the discussions that followed:
- Data as indicators, not conclusions: Every team was careful to frame their findings as directional signals rather than definitive proof, reflecting a healthy approach to working with imperfect, multi-variable data in a short timeframe.
- Sensor limitations: Multiple teams flagged gaps in the data: dead days, wind lag effects, sensors placed in ways that may not capture hyperlocal variation, and the challenge of PM2.5 and PM10 readings not always being consistent.
- The gap between policy and ground reality: Teams consistently noted that enforcement and ground implementation of good policies remain poor. E.g. chimney heights, vehicle emissions, or urban planning and growth.
- Making data meaningful: The most animated discussions of the day were around Team 1’s cigarette equivalence model, which made abstract AQI numbers feel personal and immediate. There was broad agreement about the importance of communicating air quality in relatable terms