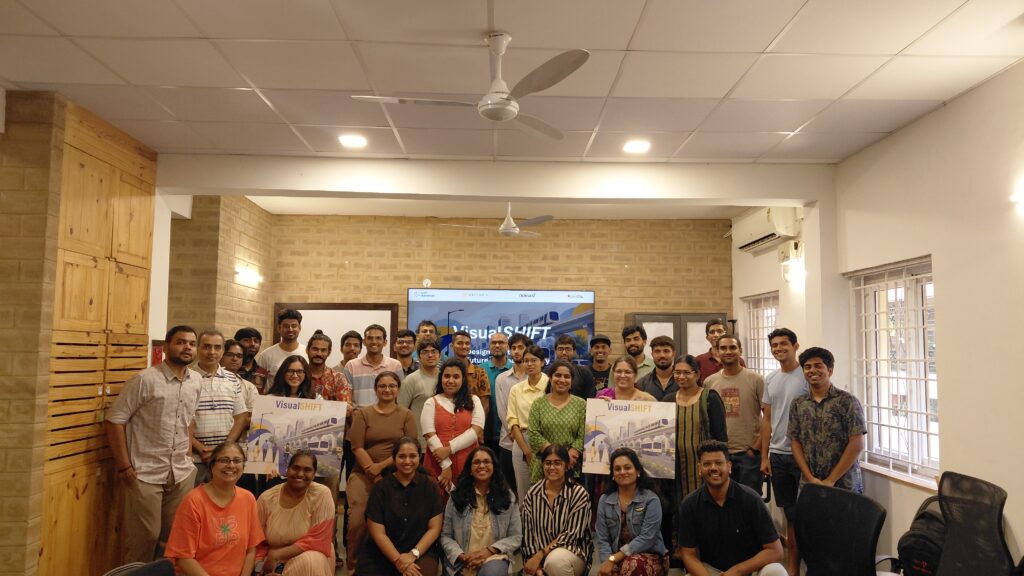
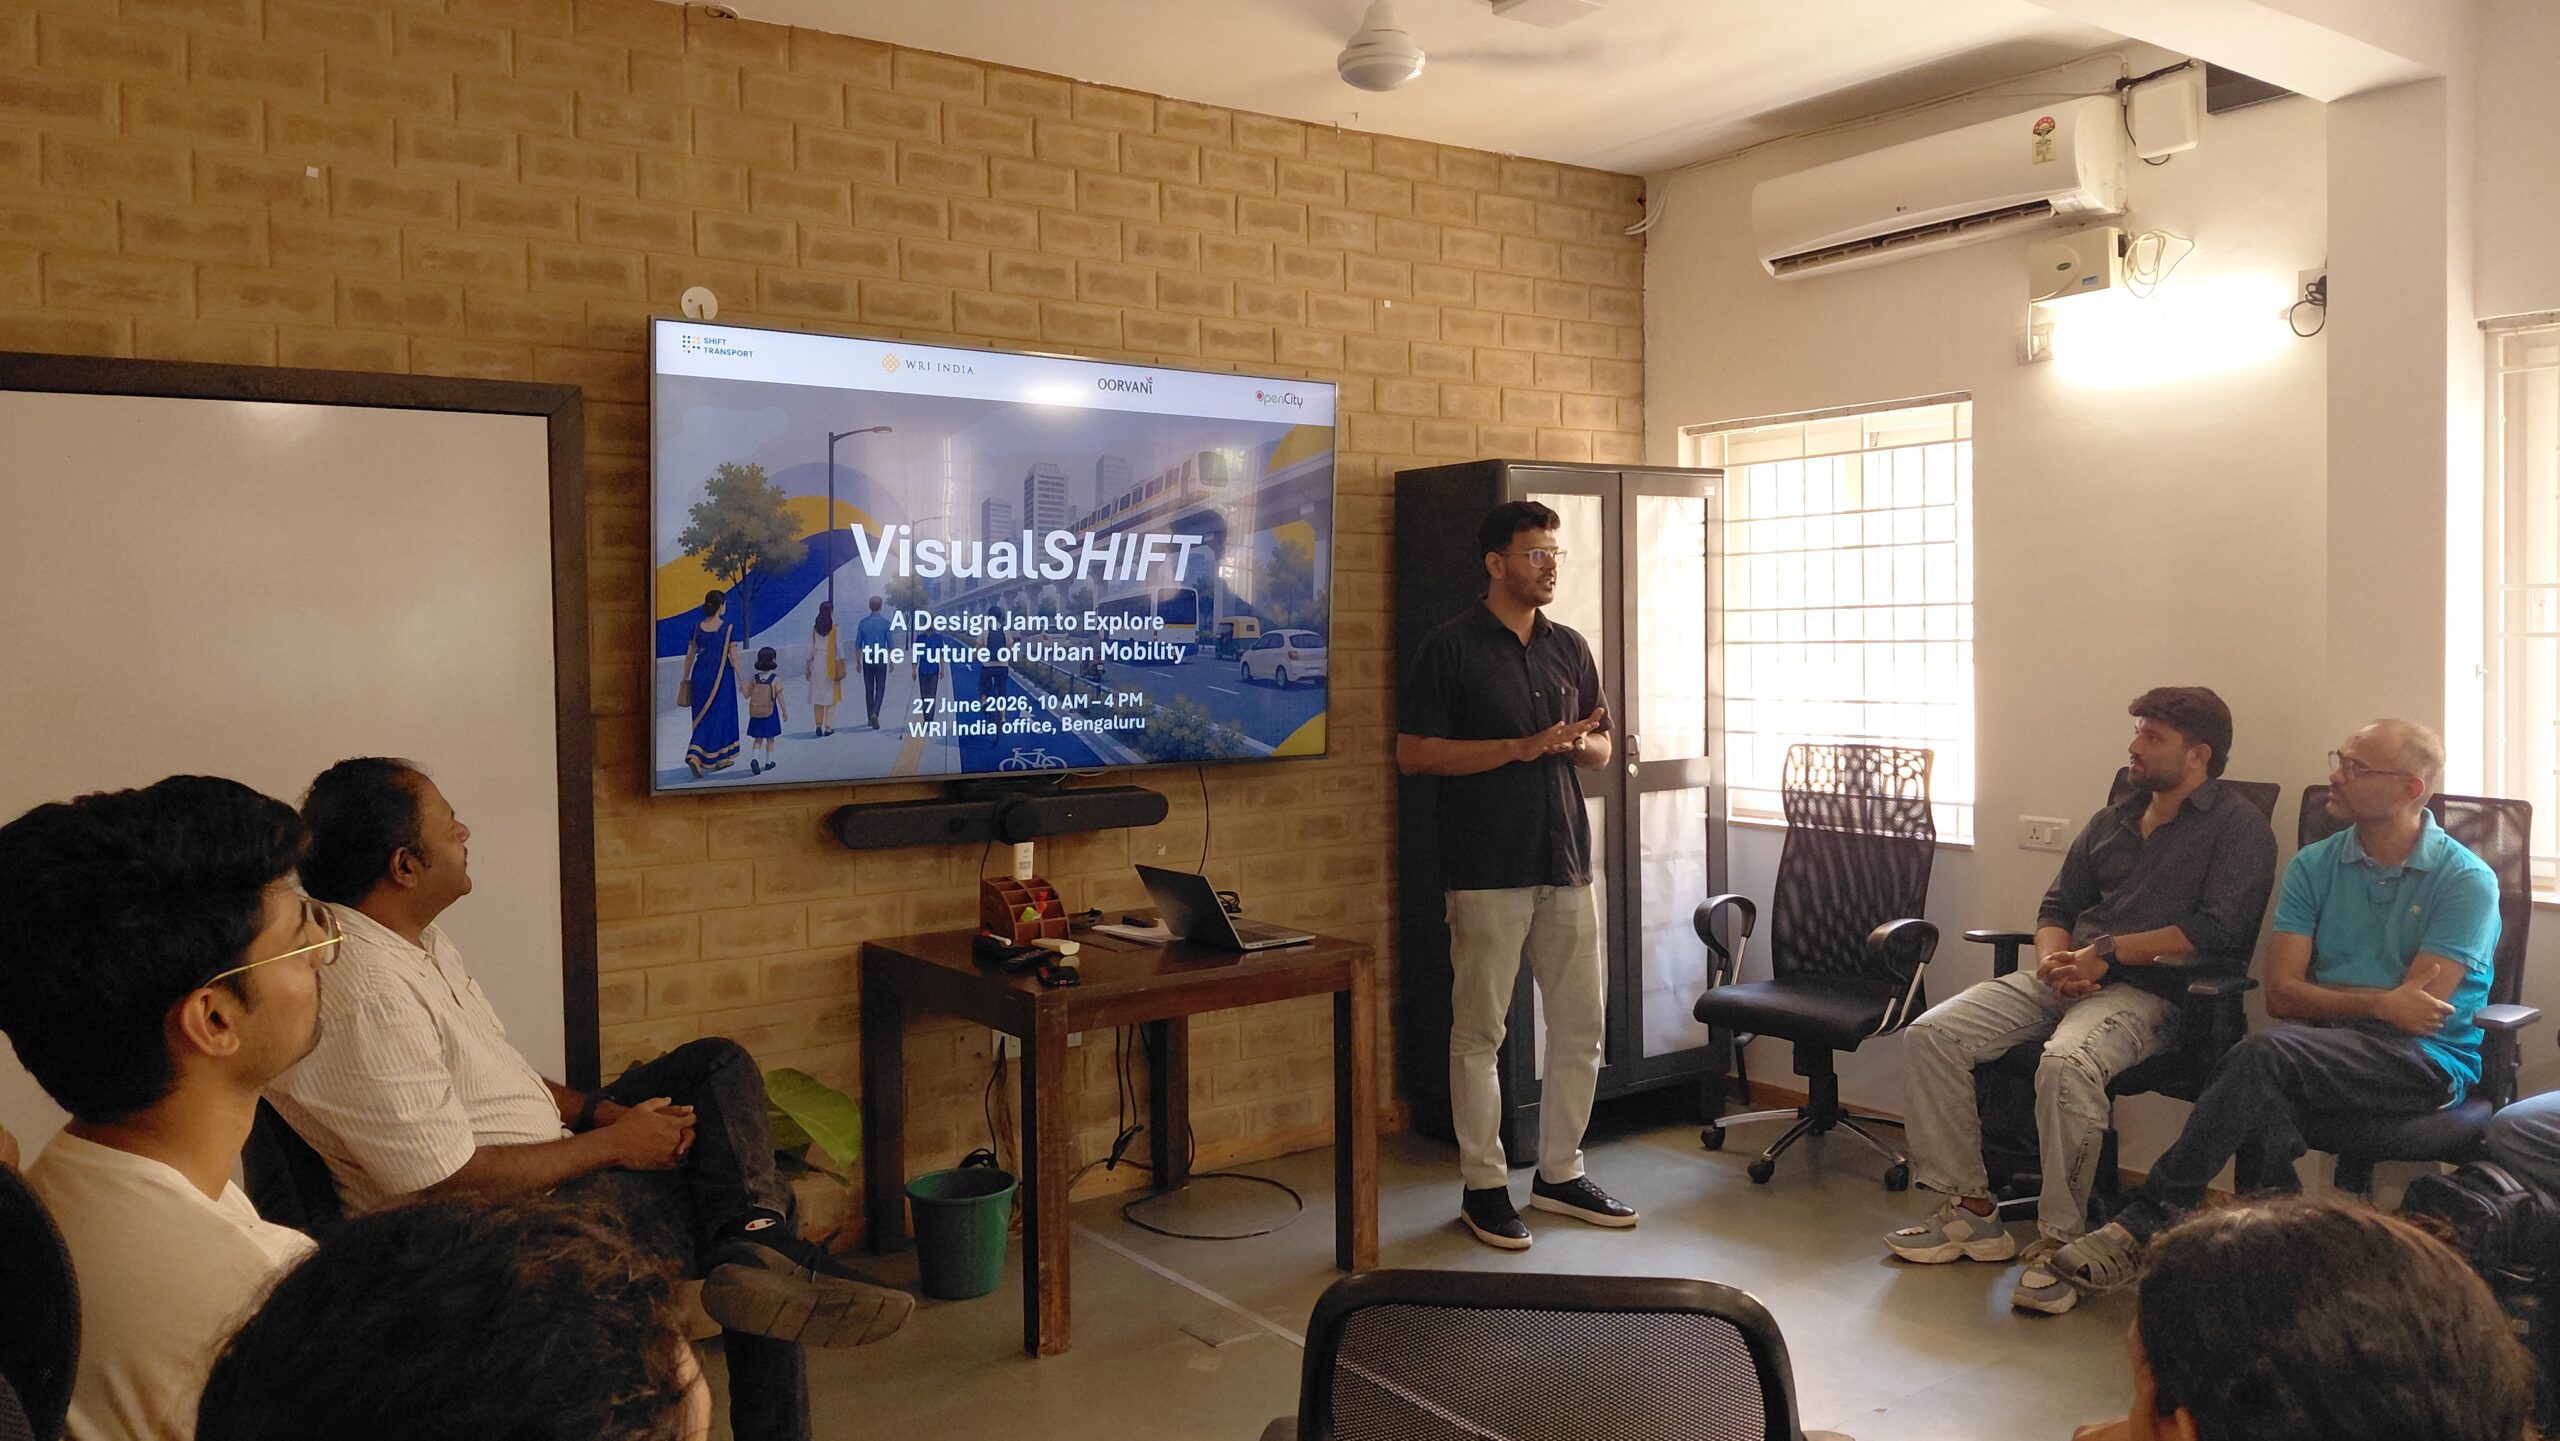
The VisualSHIFT Design Jam brought together students, planners, designers, software developers, researchers and transport enthusiasts from across Bengaluru. Organised by WRI India in partnership with Oorvani Foundation, 31 participants gathered at WRI India’s Basavanagudi office to explore how mobility data could be turned into stories that are easier to understand and more useful for everyday decision-making.
The diverse backgrounds of each participant brought a collaborative atmosphere, with different perspectives working towards the same goal. After a round of introductions, teams were formed, keeping the diversity in mind. Each team was introduced to the datasets and began brainstorming problem statements they were looking to question deeper.
As the day unfolded, a few themes kept resurfacing. Many teams looked beyond transport to ask what shapes a commuter’s experience. One team layered transport data with tree cover to show how a lack of shade can discourage people from walking to transit.
Another mapped employment hubs against metro stations, revealing where Bengaluru’s workforce remains underserved despite existing infrastructure. Several teams returned to the city’s persistent first- and last-mile challenge, exploring feeder bus connectivity, route overlaps and ways to make public transport work as one integrated system.
By the afternoon, conversations shifted to outputs and design ideas. This was followed by a Lunch break over pizza, before the teams got back to refining their visualisations for the afternoon presentations.
This being a Design Jam, participants were asked to focus on how to communicate insights found within the data. The aim was to explore ways to make complex data easier for anyone to understand. This created relatable metrics such as ‘hours lost to inefficient connections’, storytelling that followed a fictional commuter through the city, or using visuals to compare how different modes of transport use road space. Teams were given time to finish their outputs before presenting them to the rest of the room.
Thoughtful questions and feedback came from everybody, including road safety expert Srinivas Alavilli, Transport Fellow at WRI India, whose enthusiasm set the tone for the beginning of the day. The presentations became an opportunity to exchange ideas, receive feedback and explore where these concepts could go next.
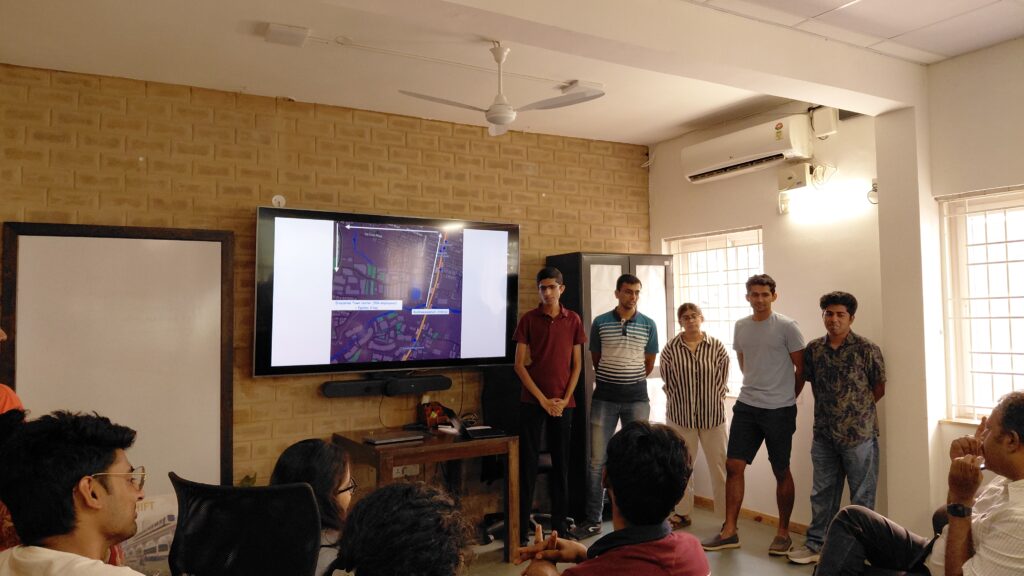
This included a humorously relatable presentation from Group 5’s Vivek Matthew, one of the teams that explored Bengaluru’s first- and last-mile connectivity. They used simple maps to ask a practical question: How can Bengaluru’s road network better connect people to public transport? By showcasing gaps in road and pedestrian access between large residences and offices to metro stations, they highlighted how relatively small improvements could make public transport much more accessible for thousands in the city.
An encouraging takeaway from VisualSHIFT was seeing the range of people willing to spend a Saturday thinking deeply about how Bengaluru could work better. The ideas and people are already here in our city. Events like this simply create the space for them to meet, and imagine what’s possible when open data is put to good use.