While Chennai has three important modes of transport in the metro, buses and the MRTS, the connectivity remains unequal with many pockets not having access to public transport. Bus stops and interchanges also suffer from lack of accessibility for wheelchairs and the visually disabled.
These were some of the insights to emerge from the Chennai Public Transport Datajam held by OpenCity, an initiative of the Oorvani Foundation on the 8th August 2026, at IIT-M Research Park in Tharamani. The event was organised in collaboration with Nagariyal, CAG Chennai, Asar, ITDP and Poovulagin Nanbargal.
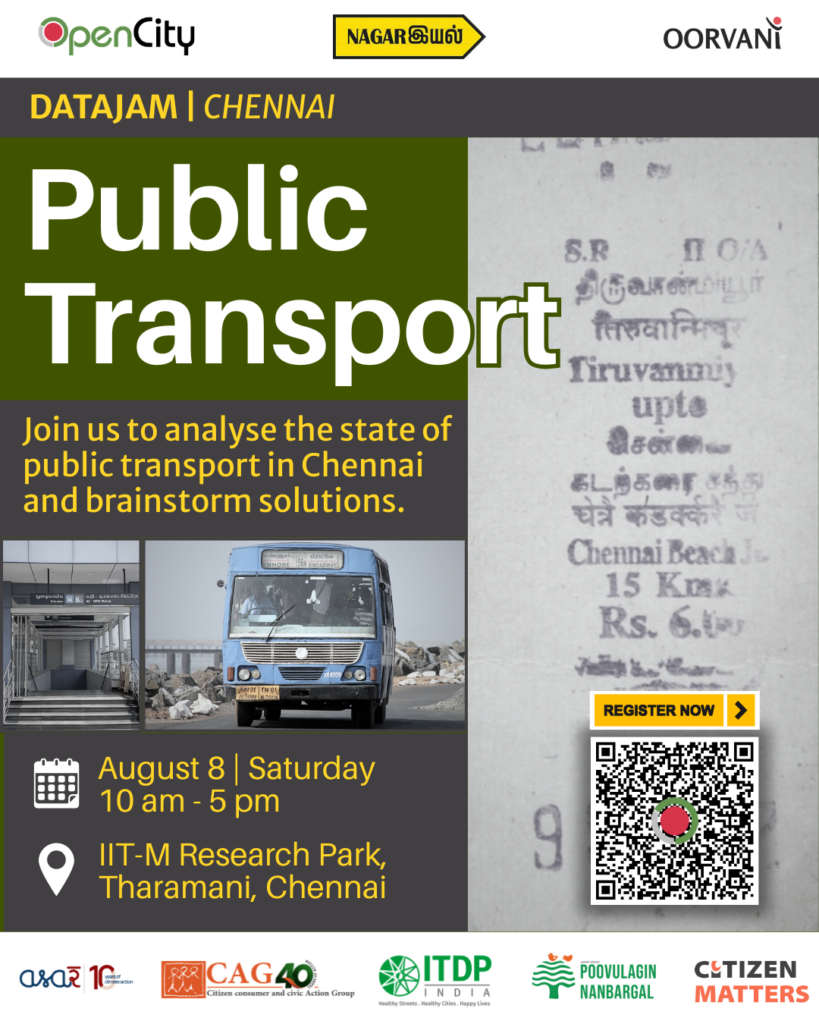
Participants were expected to analyse the state of public transport in Chennai across the city’s different transport types. Looking for connectivity gaps, accessibility for people with disabilities, and first- and last-mile access.
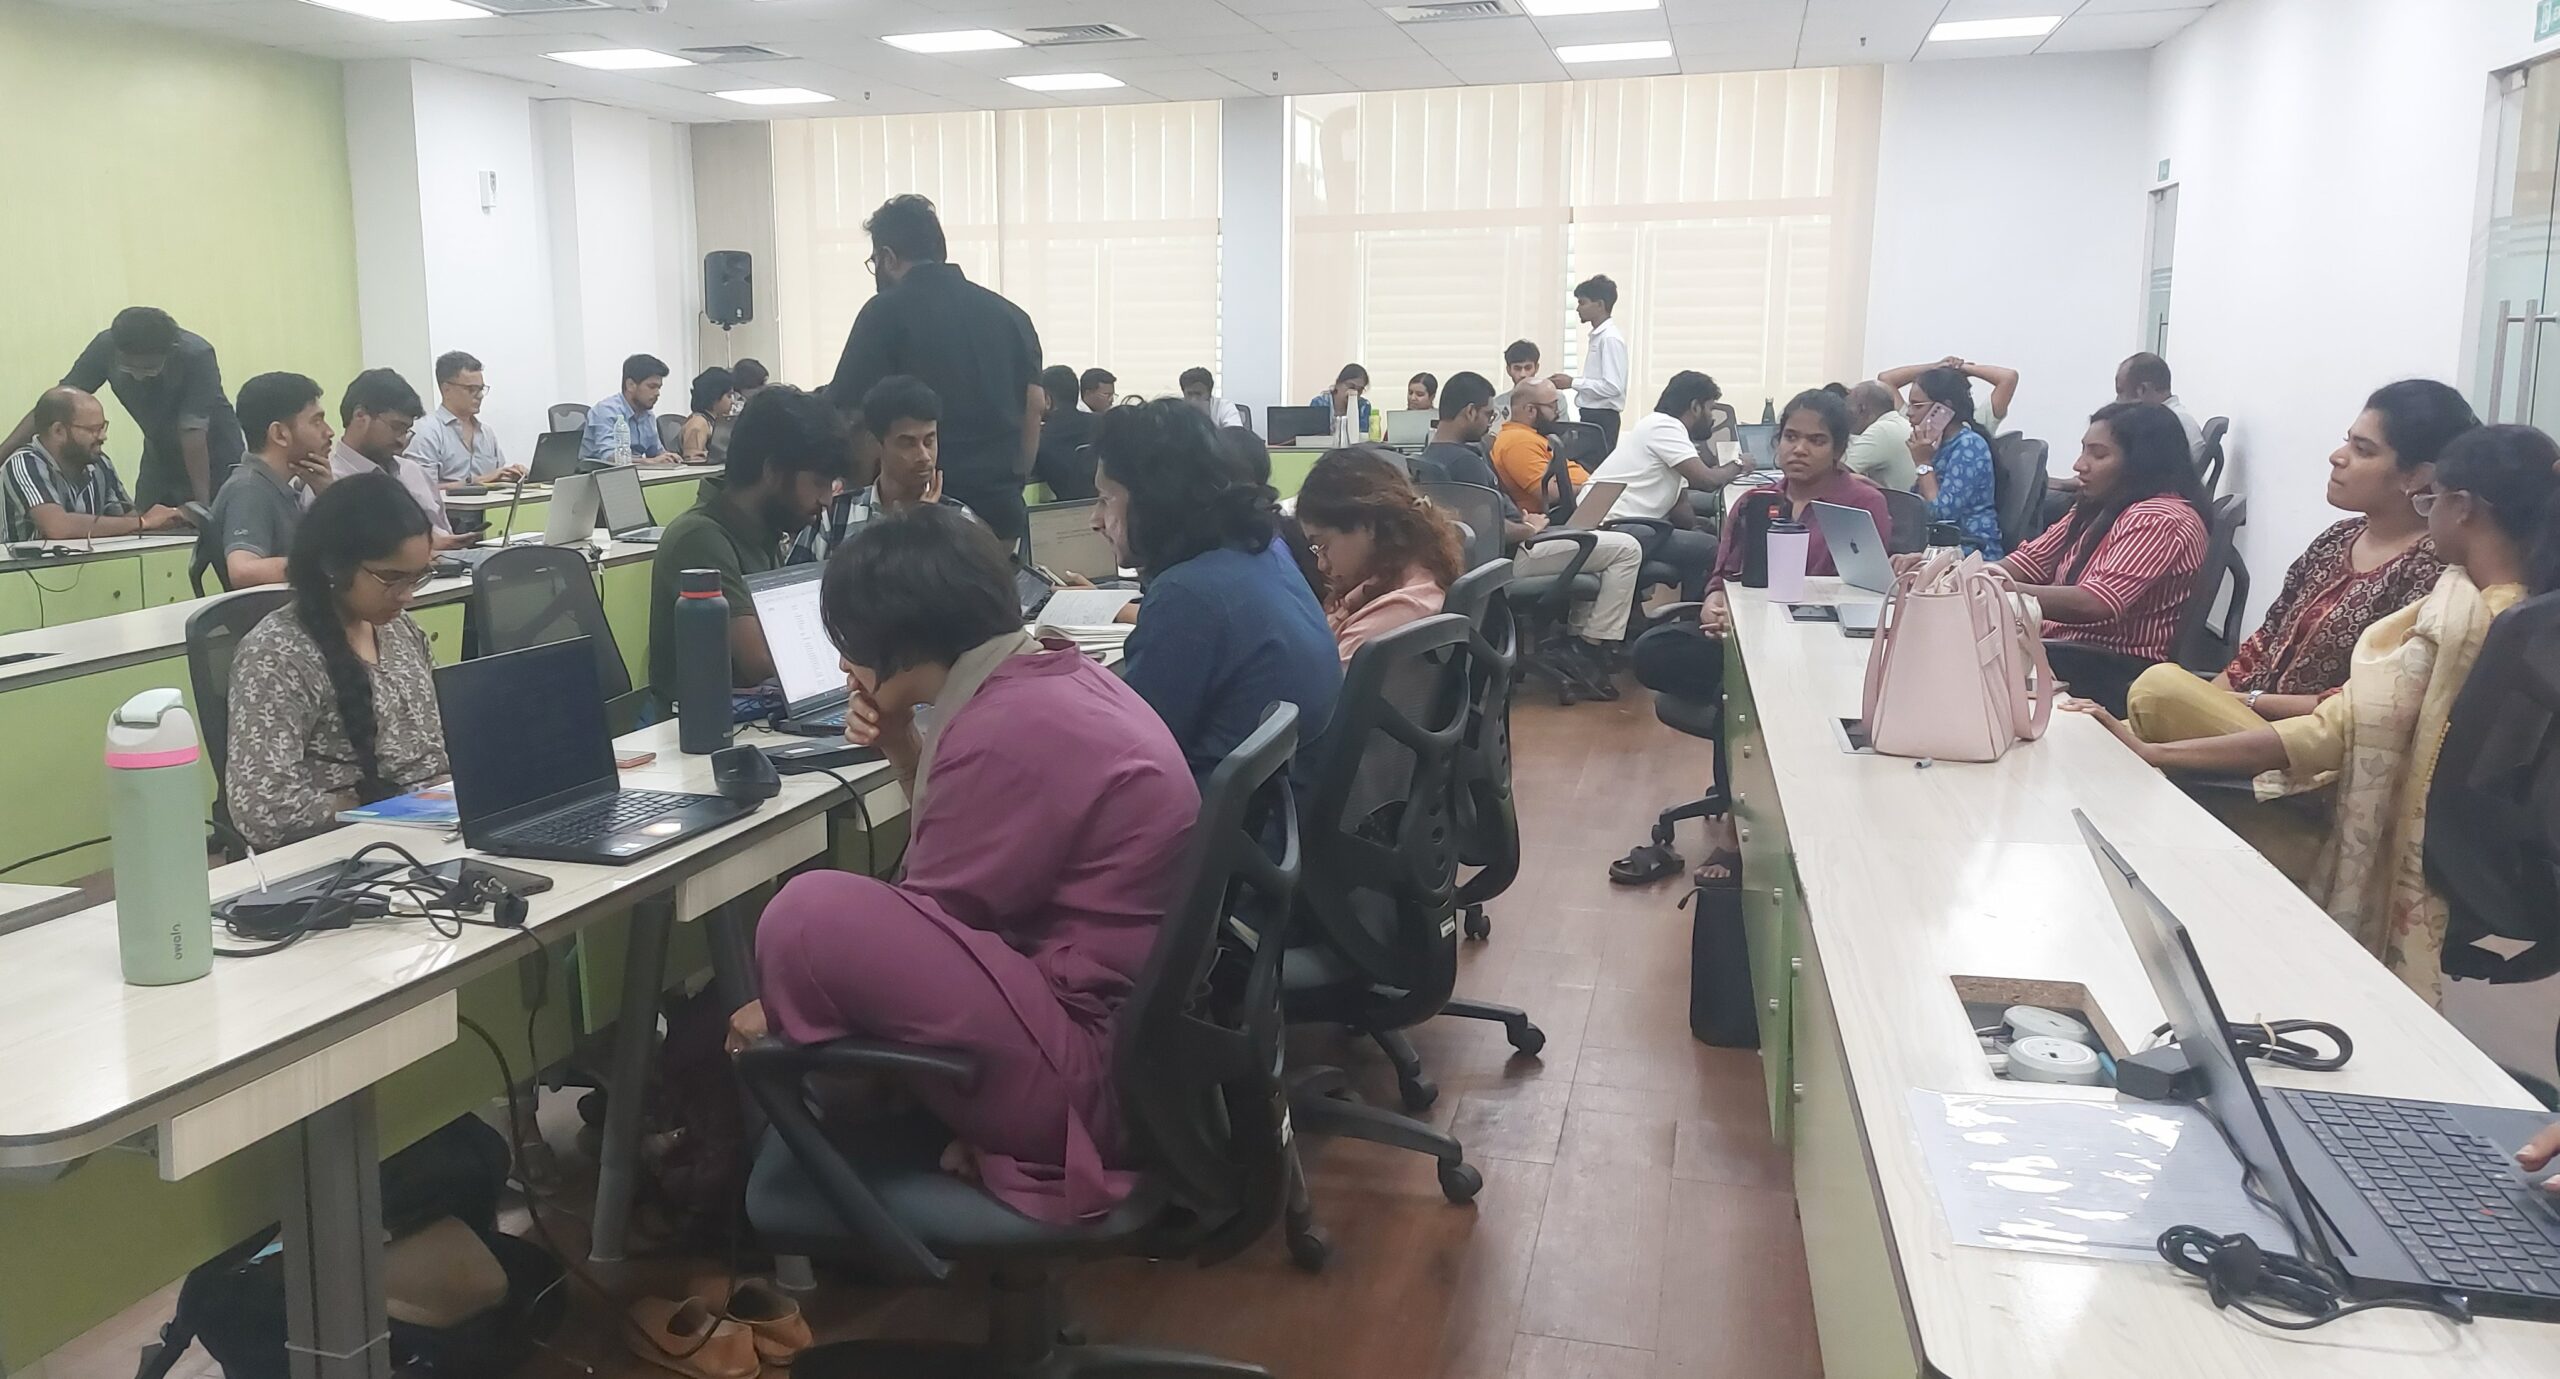
Participants looked at a range of datasets that included Oorvani Foundation & Nagariyal’s Bus Stop Audit (BSA), where citizen-collected audit data on 200+ bus stops, MTC, MRTS and Chennai Metro datasets.
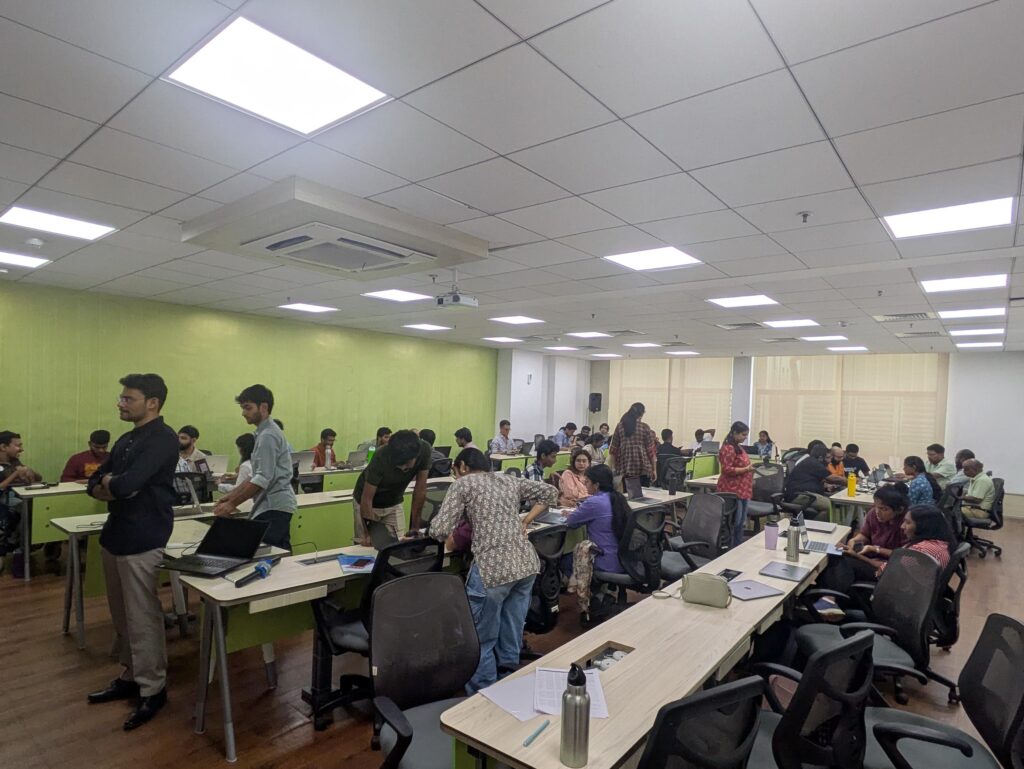
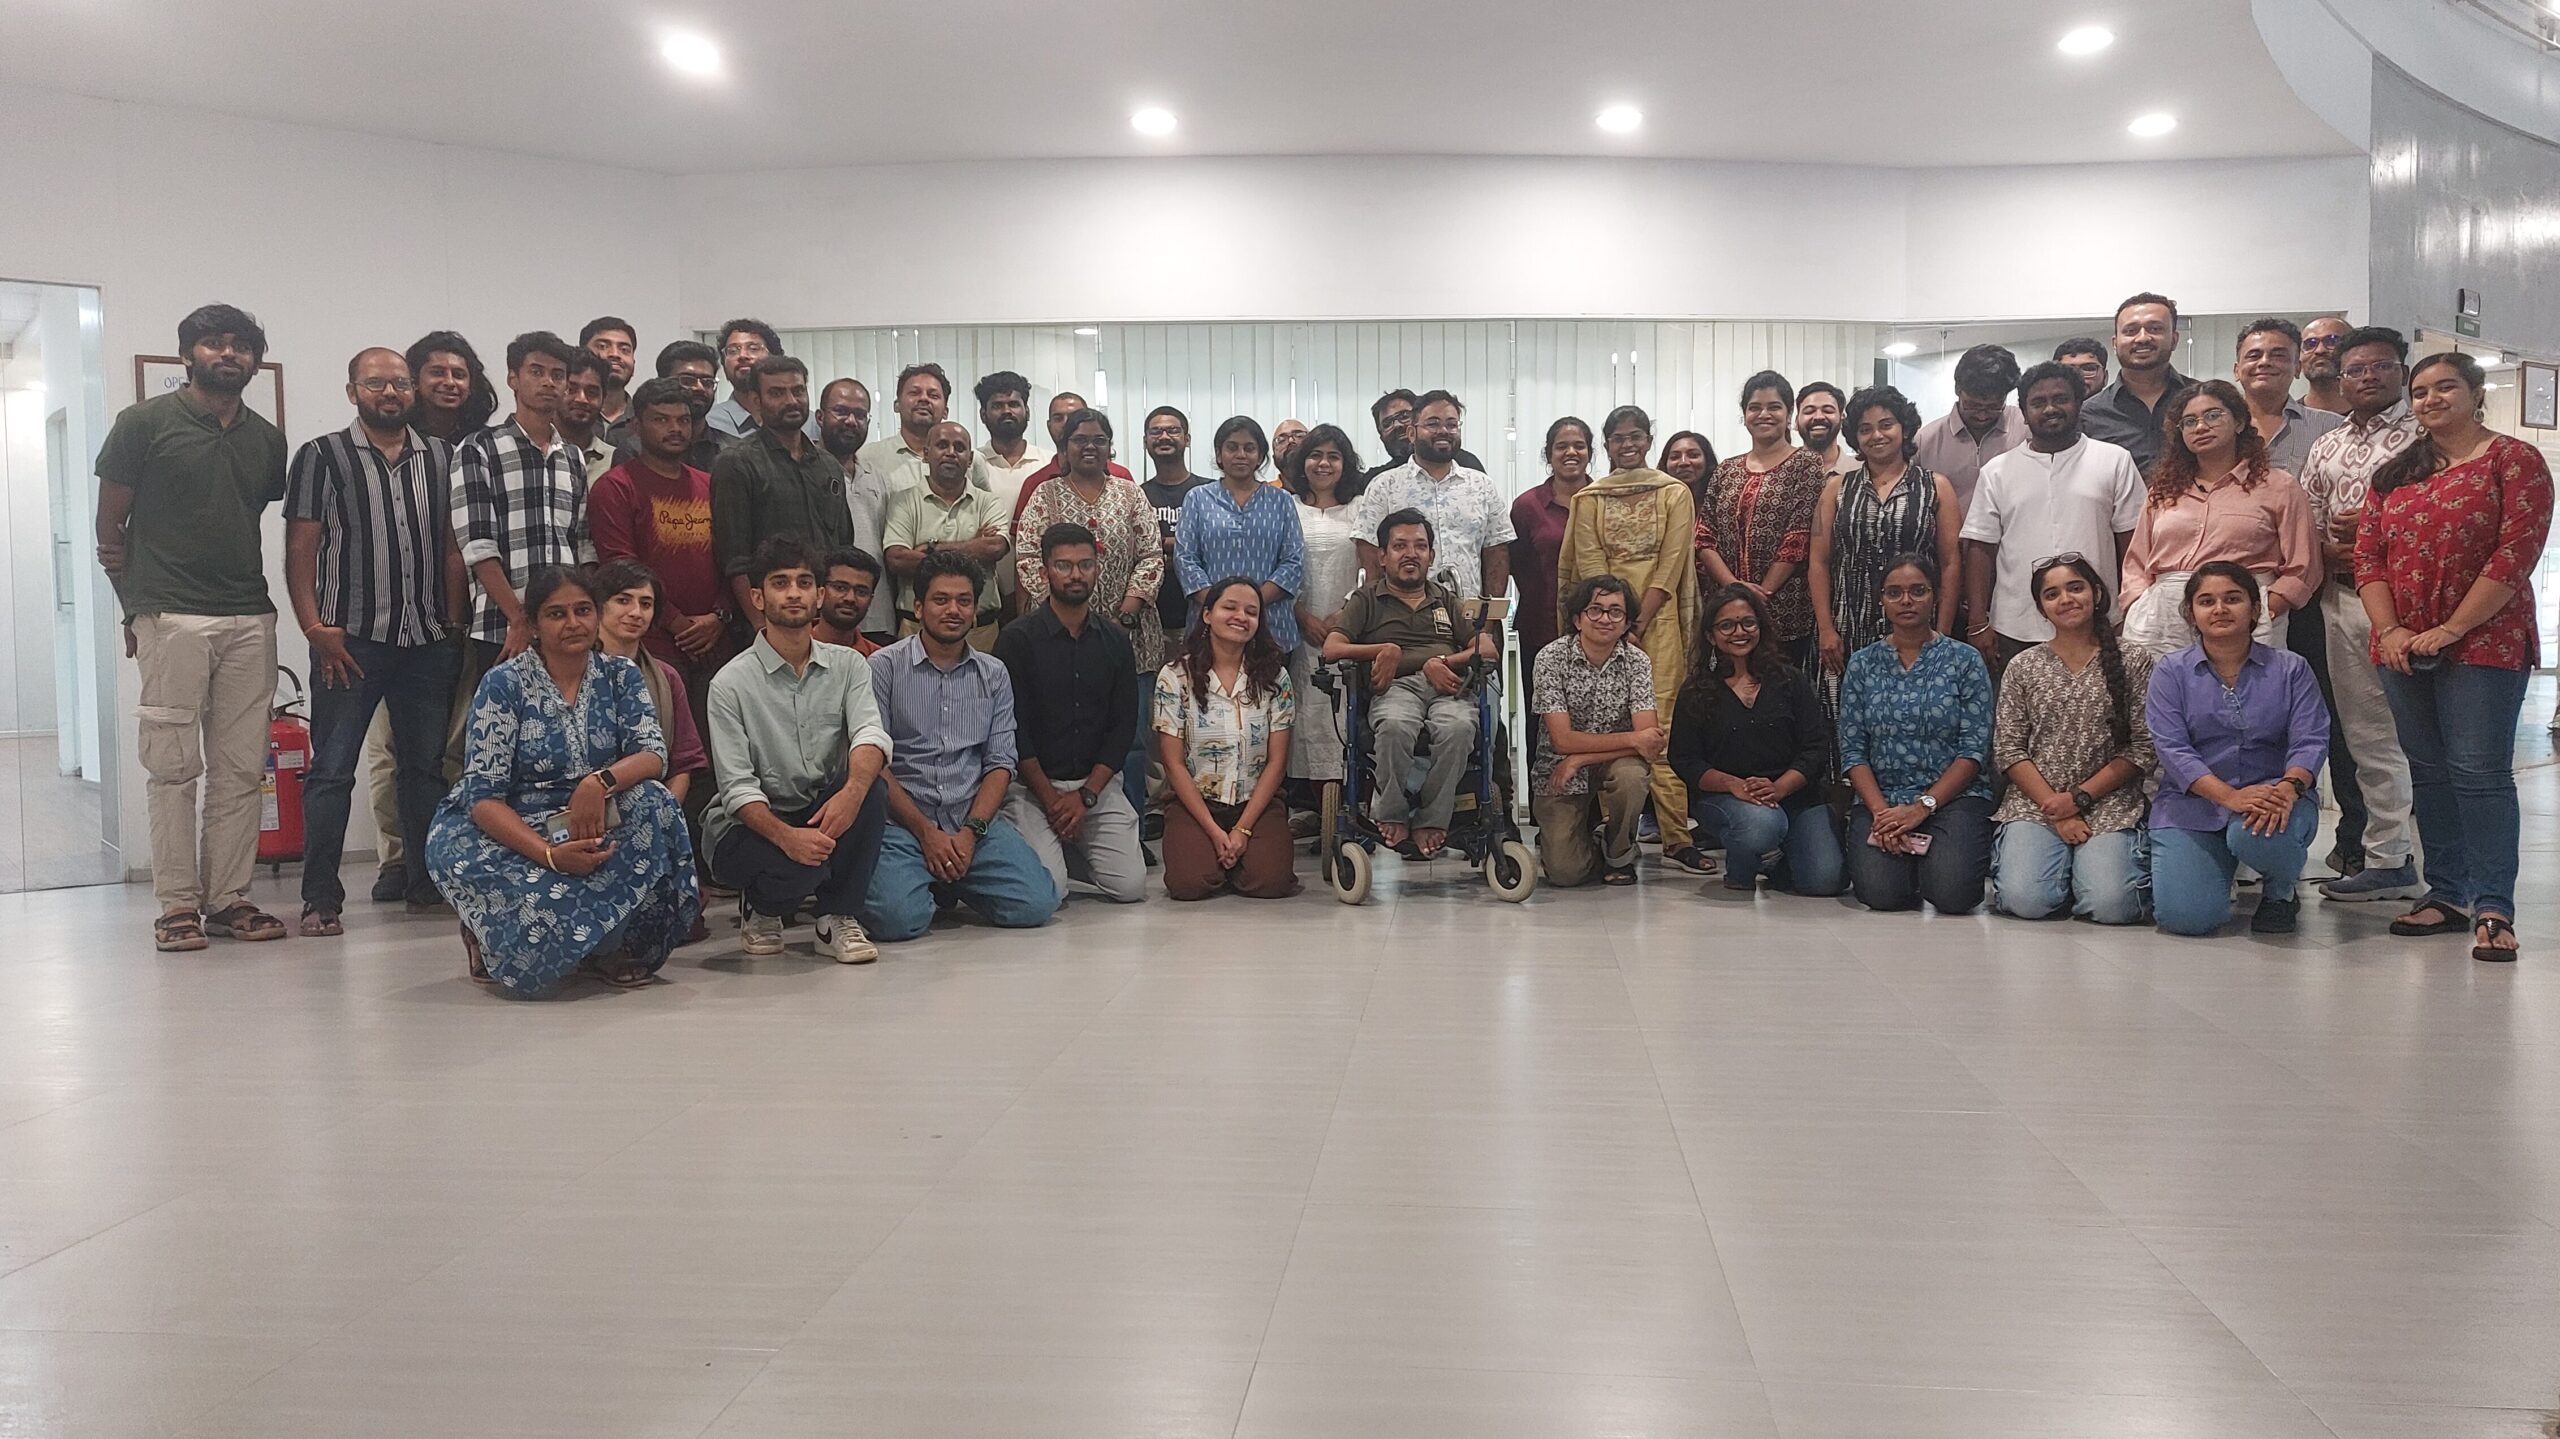
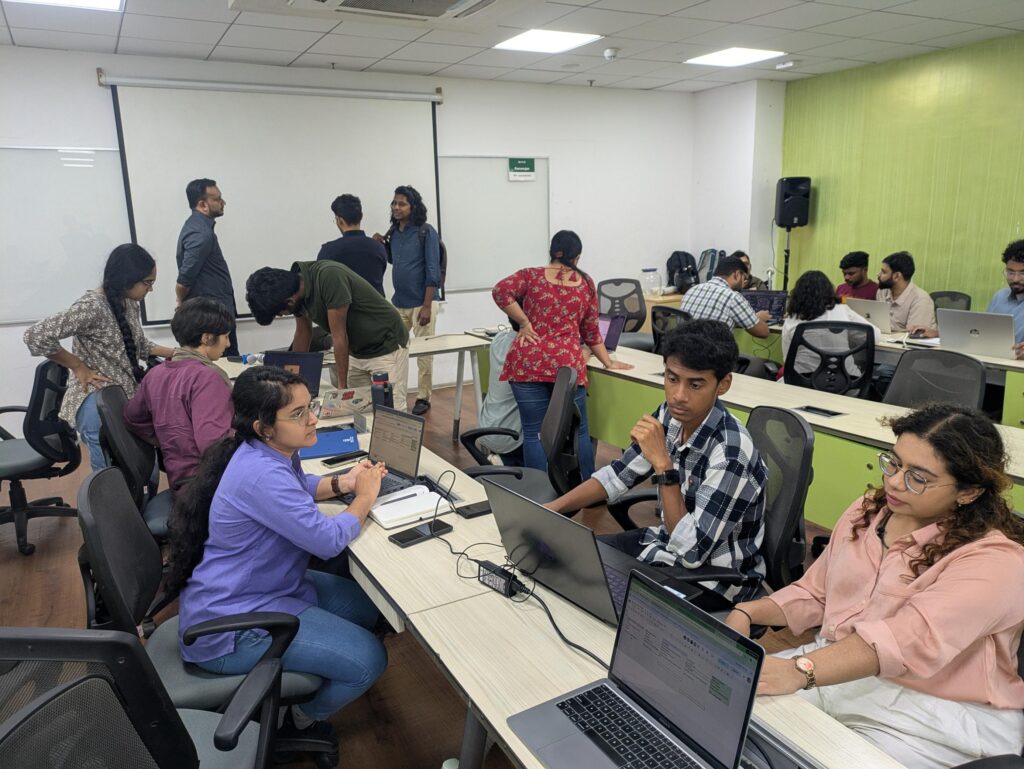
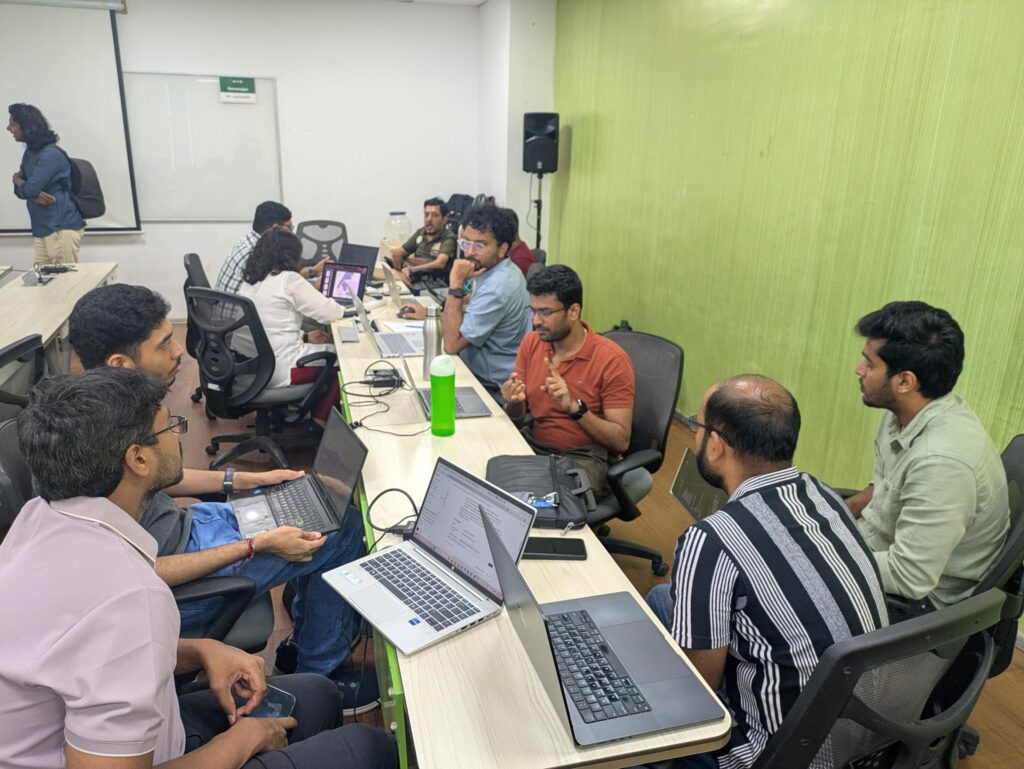
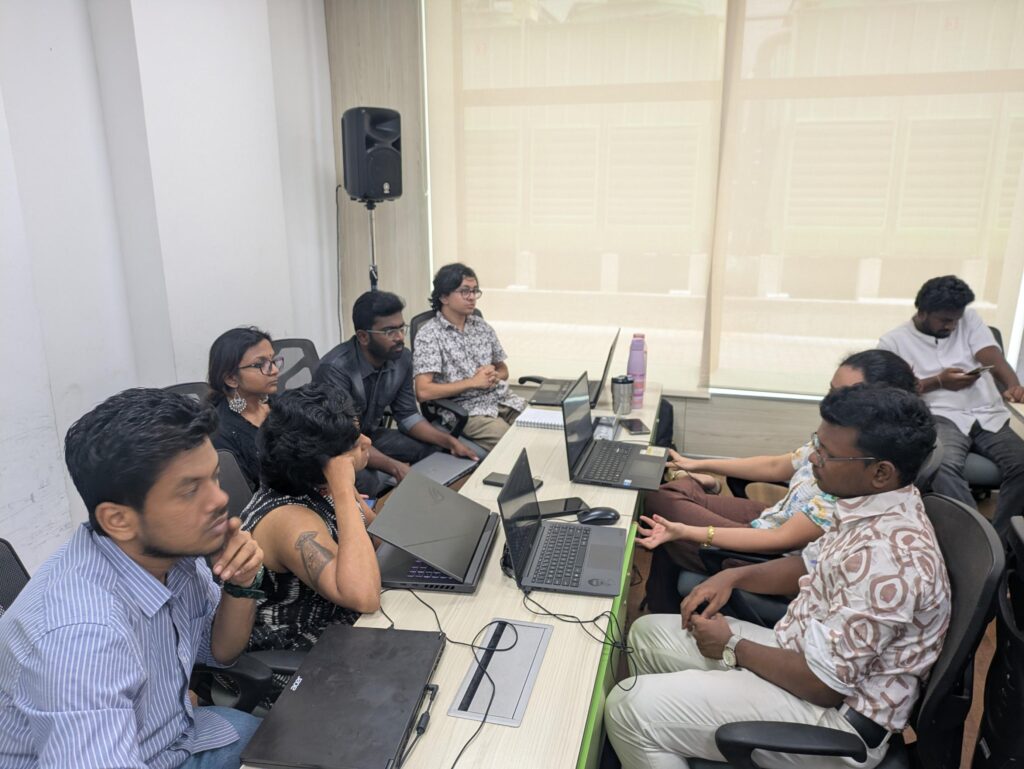
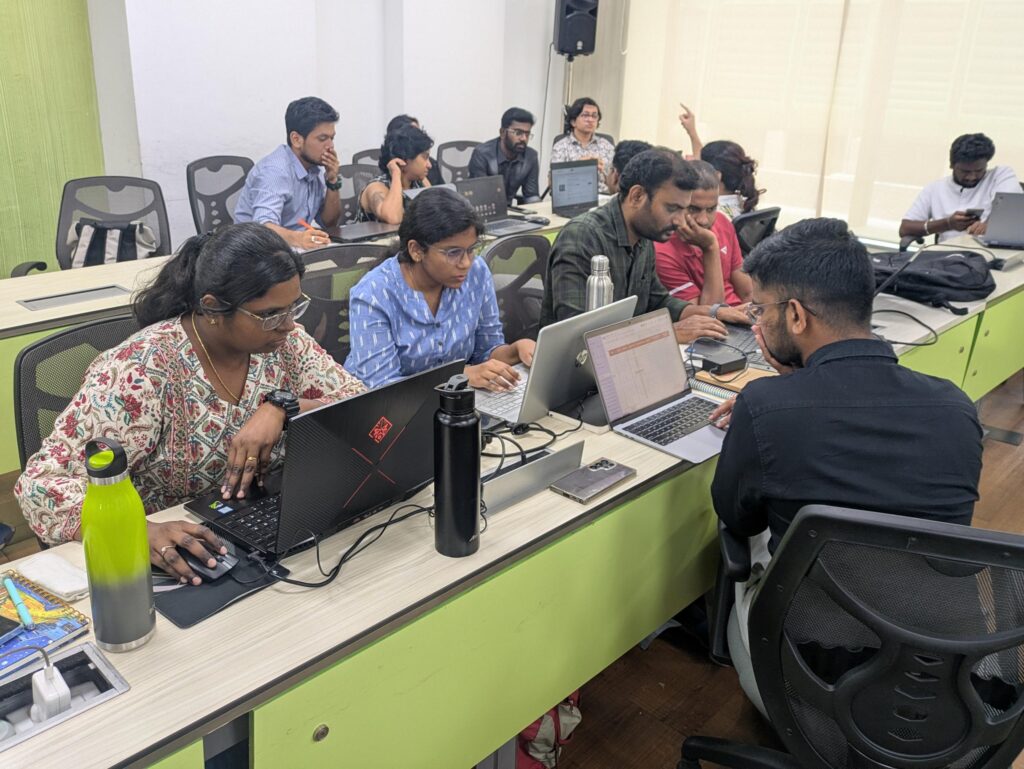
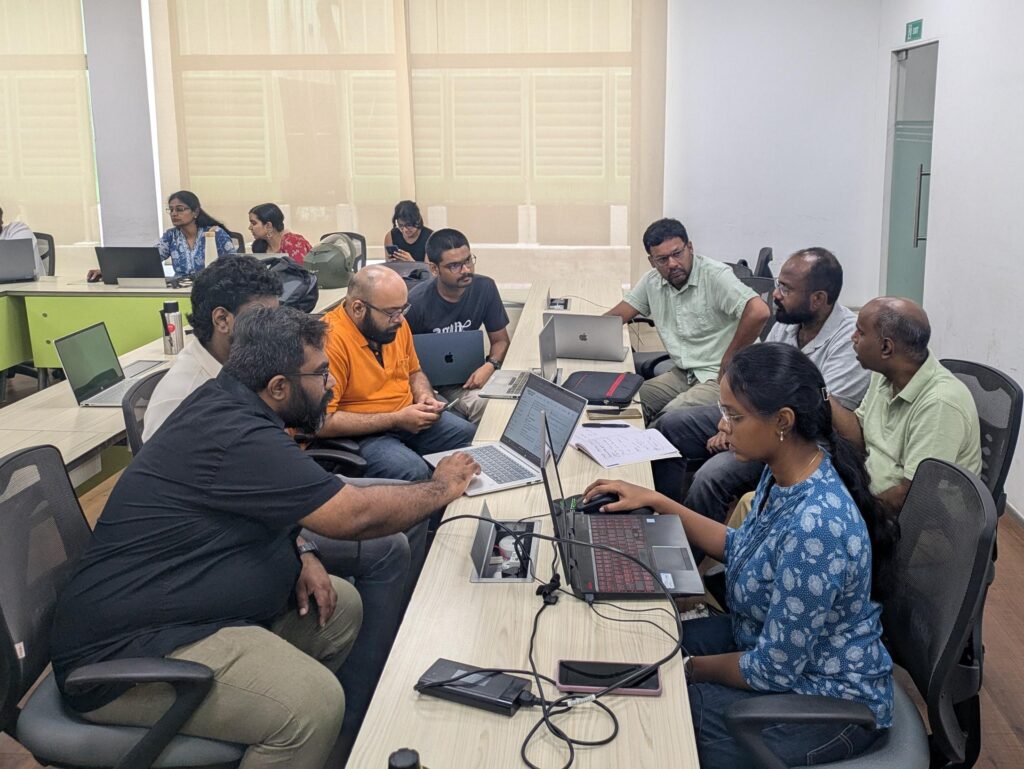
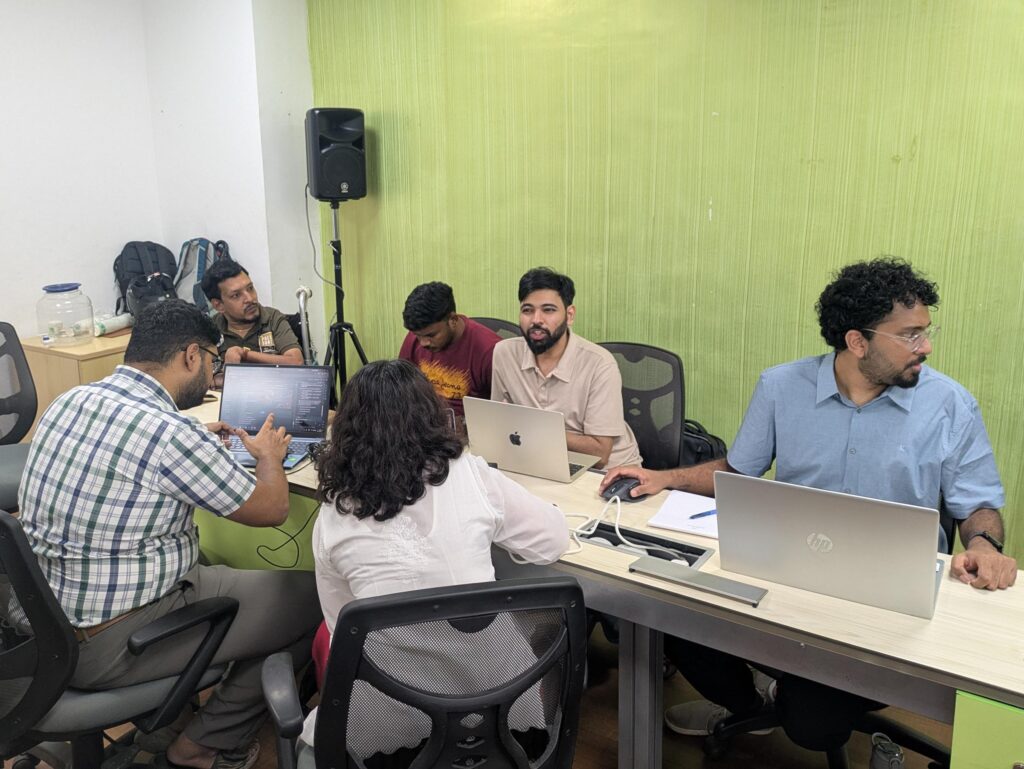
The jam brought together 38 participants from diverse backgrounds such as transport planners, GIS practitioners, students, urban researchers and citizen volunteers. The participants were divided into six teams who each looked at different problem statements of various issues.
Problem Statements
- Chennai Bus Stop Report Card: Auditing stop quality and access across Chennai’s bus stops to identify first- and last-mile connectivity gaps.
- Public Transport Accessibility to Schools & Healthcare Facilities: Assessing how far public transit is from essential services and identifying wards requiring urgent intervention.
- Multimodal Interchange Efficiency: Understanding the efficiency and accessibility of interchange networks between different transport modes at high-footfall hubs.
- Ward-Level Public Transport Index: Ranking 33 wards in Zones 5 and 9 by relative multimodal access to guide future transit investment.
- Last-Mile Connectivity in OMR: Identifying underserved areas along the Old Mahabalipuram Road stretch and profiling their socio-economic access gaps.
- Bus Stops for ALL: Designing a universally accessible bus stop to ensure level boarding between sidewalks and low-floor buses
Outputs
Chennai Bus Stop Report Card
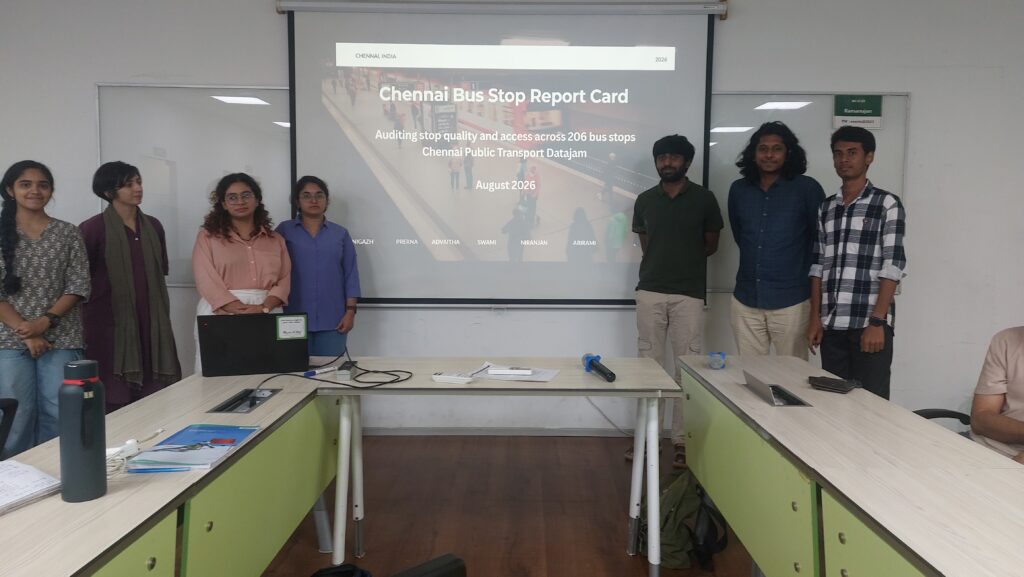
Advaitha, Abirami, Deepa, Nigazh, Niranjan, Prerna and Swami built a 12-point report card for Chennai’s bus stops using the data from the Oorvani, Nagariyal and ITDP Bus Stop Audits, to score each stop against eight indicators – helter, cleanliness, position on the footpath, footpath access, roofing, passenger information systems, amenities, and lighting .
The team found that while Chennai is investing heavily in shelters, which scored 84% on the report card, it is failing on accessibility, with footpath and wheelchair access scoring just 12%. Of 210 audited stops, only 20 had a usable ramp.
Public Transport Accessibility to Schools & Healthcare Facilities
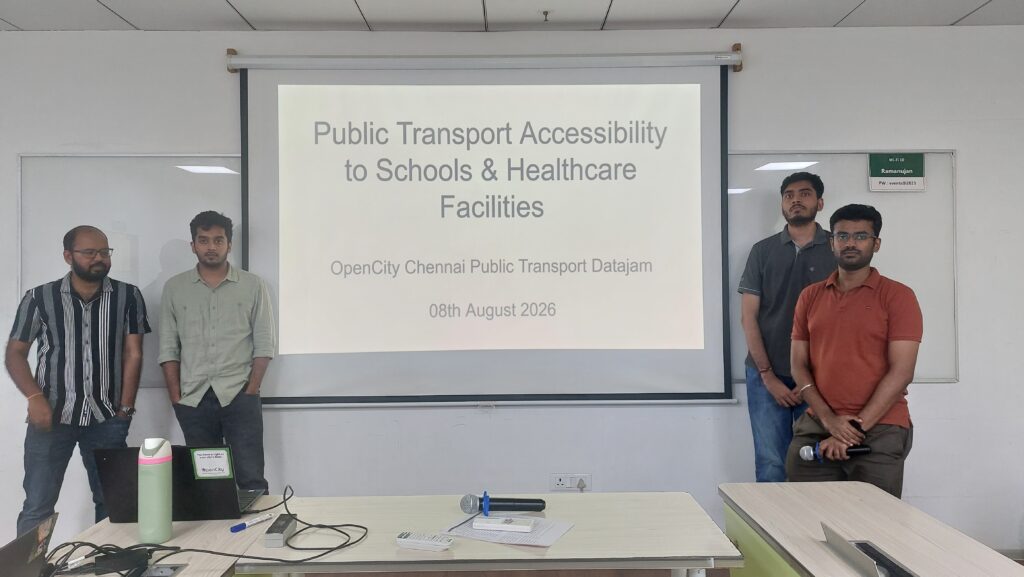
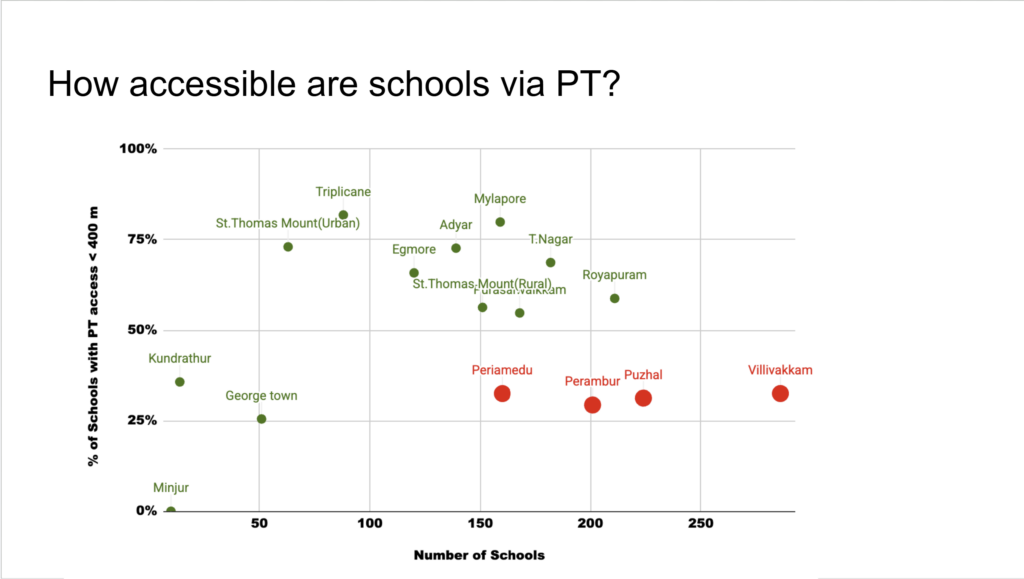
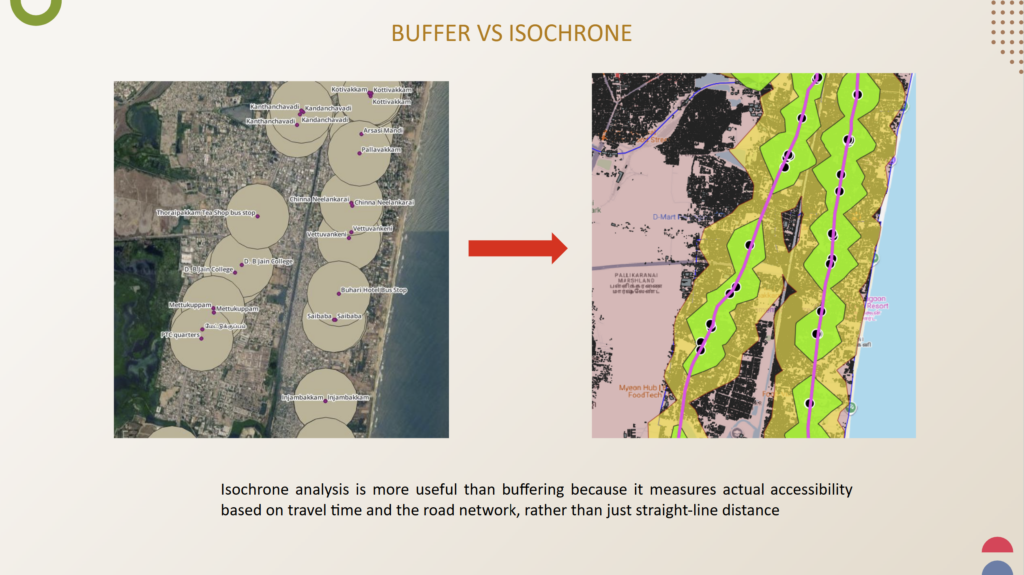
Adi, Sabhari, Santhosh S, Satheskumar (Satish), Tharun and Vijay set out to measure how far Chennai’s schools and healthcare facilities are from public transport, using a 400-metre buffer around every bus stop, metro station and MRTS/suburban station as their benchmark for access.
They found that only 51% of schools and 54% of Primary Health Centres in their study area had adequate access within that radius, and just 2 of the 14 Community Health Centres they mapped fell within the buffer. Schools serving specially-abled and disadvantaged communities showed particularly poor access. The team flagged Periyamedu, Perambur, Pudur and Vellivakkam as priority zones for schools, and areas around Royapuram and Thiruvottiyur for healthcare access.
Multimodal Interchange Efficiency
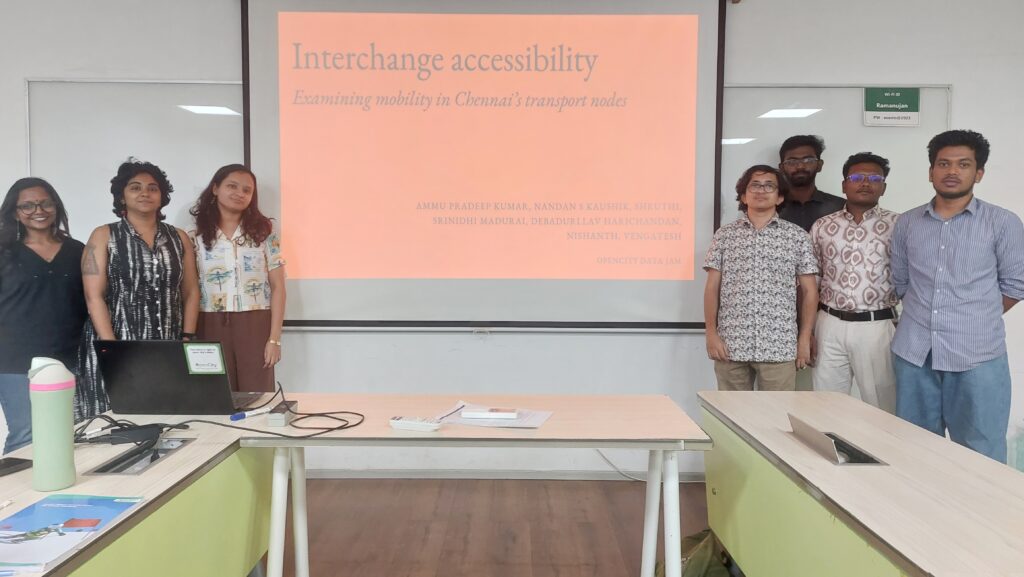
Ammu K, Debadurllav H, Nandan K, Nishanth, Shruthi, Srinidhi M and Vengatesh looked at how easily commuters can actually move between transport modes at Chennai’s two busiest interchange hubs – Chennai Central and Guindy, combining GIS mapping with on-ground Google Maps and Street View audits.
The team noted that at Central, all networks converge within a short walking distance, but the connection to Park Town station is let down by a narrow, roughly 2-metre-wide footover bridge with no wheelchair access – a concern given the high volume of passengers that can arrive on a single train.
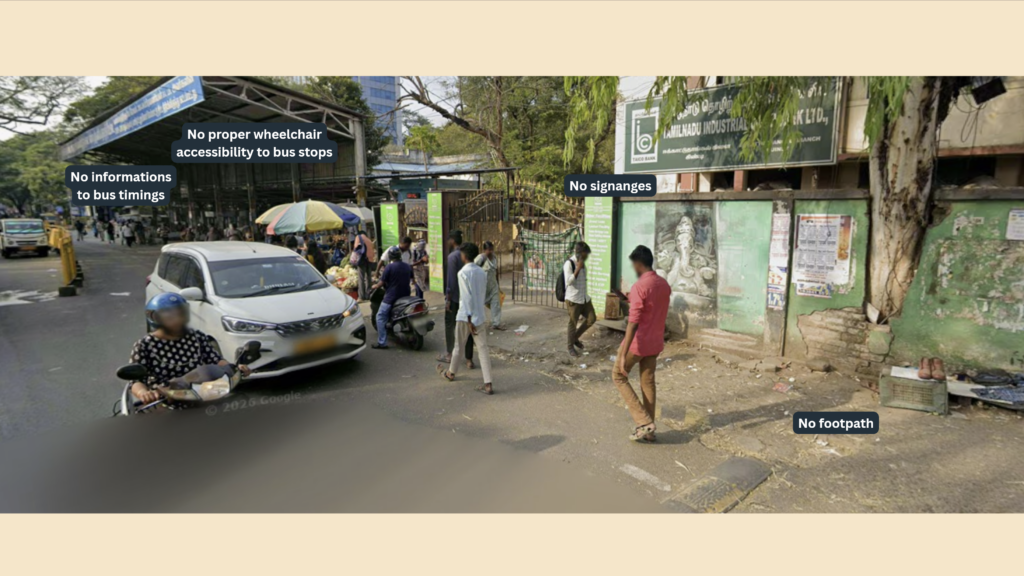
At Guindy, the connecting subway has no elevator, poor lighting at night, and pavements blocked by encroachments, with almost no signage for first-time visitors. The team’s recommendations centred on universal design including 1:12 ramps, unobstructed tactile flooring, clearer wayfinding, tabletop crossings, and better-scheduled train timings to avoid dangerous platform crowding.
Ward-Level Public Transport Index
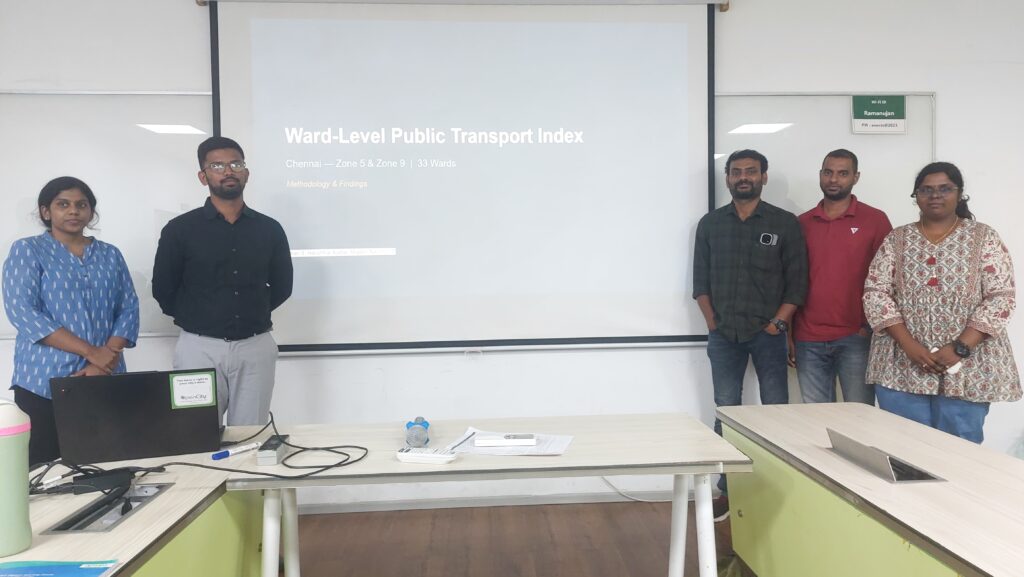
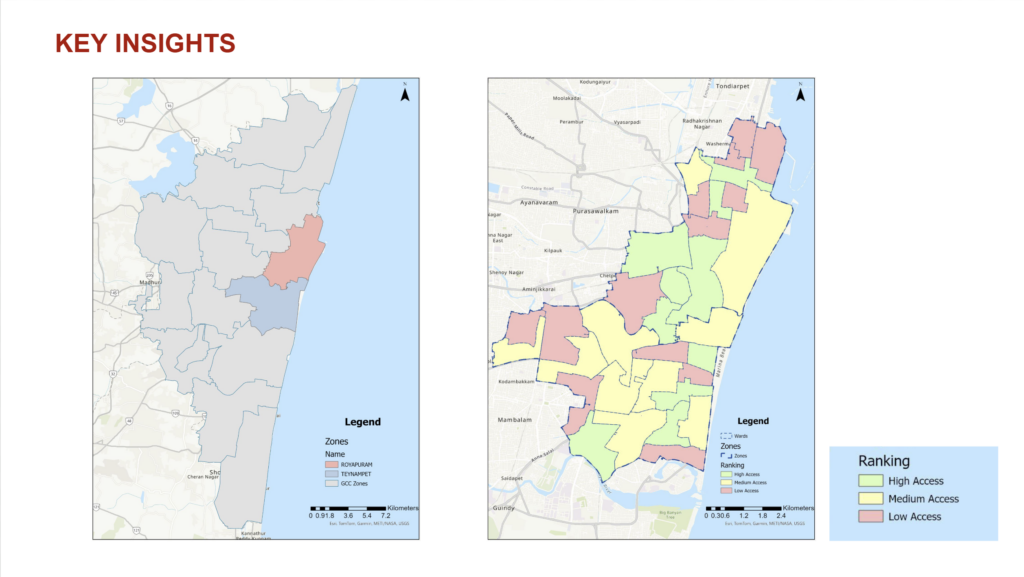
Gowdhaman S, Harishtha, Kumar, Migash and Nandhini M t ranked 33 wards across Zones 5 and 9 in terms of accessiblity to public transport. These zones were evaluated according to their access to buses, metro and suburban rail.
The team found that 70% of the wards studied fell into a “Low Access” band, and only 4 of the 33 had access to all three modes. Zone 5, which includes Royapuram and Thondiarpet, scored better overall than Zone 9, largely thanks to its metro and rail coverage. The team noted that the index purely measures the presence of stops, rather than service quality or ridership, and suggested extending it citywide as next steps for their outputs.
Last-Mile Connectivity in OMR
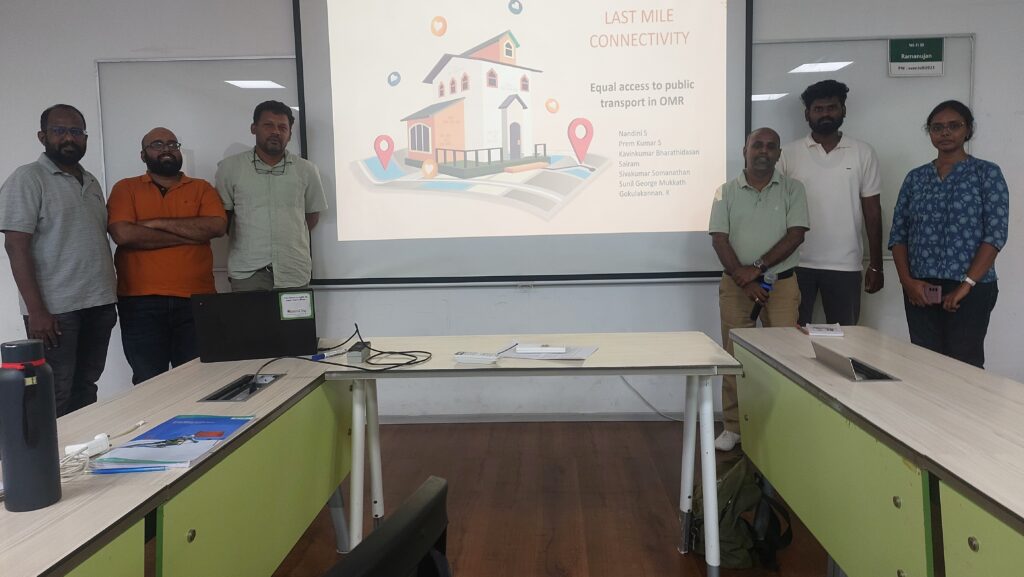
Gokulakannan K, Kavinkumar B, Nandini S, Prem S, Sairam, Sivakumar S and Sunil GM focused on OMR, a stretch that they described as being almost entirely covered by buses, with no suburban rail or MRTS and its upcoming metro line not yet operational.
The team identified many areas that were more than a kilometre from the nearest stop, and recommended a complementary Bus Rapid Transit or feeder service once the metro opens.
Bus Stops for ALL
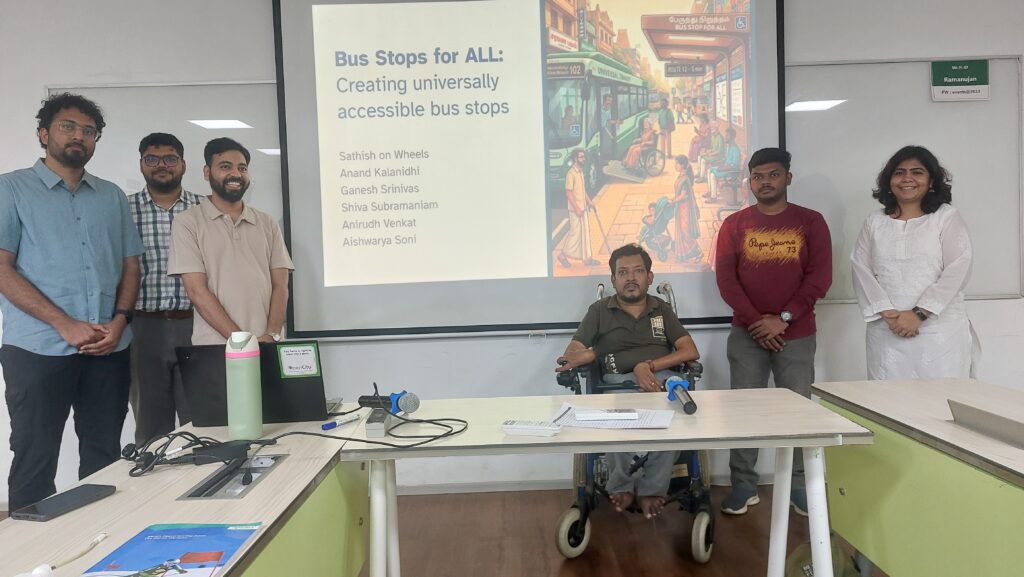
Aishwarya S, Anand K, Anirudh V, Ganesh S, Sathish on Wheels and Shiva S worked with guidance from the Disability Rights Alliance and Nagariyal to design a universally accessible bus stop, after analysing data from the Oorvani/Nagariyal Bus Stop Audit. They first highlighted that 86% of the audited bus stops lack ramps despite the city having one of the highest shares of low-floor buses in the country.
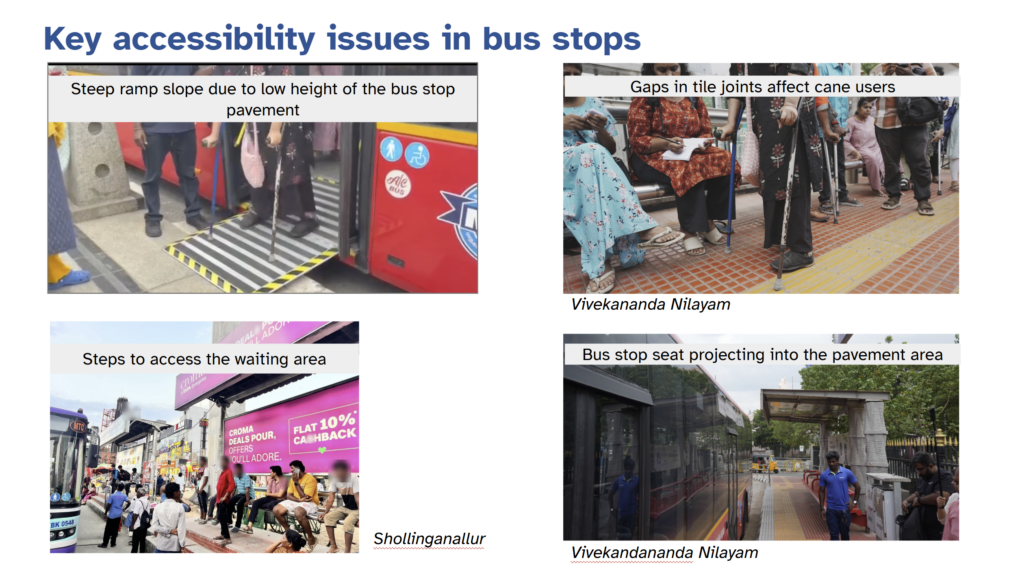
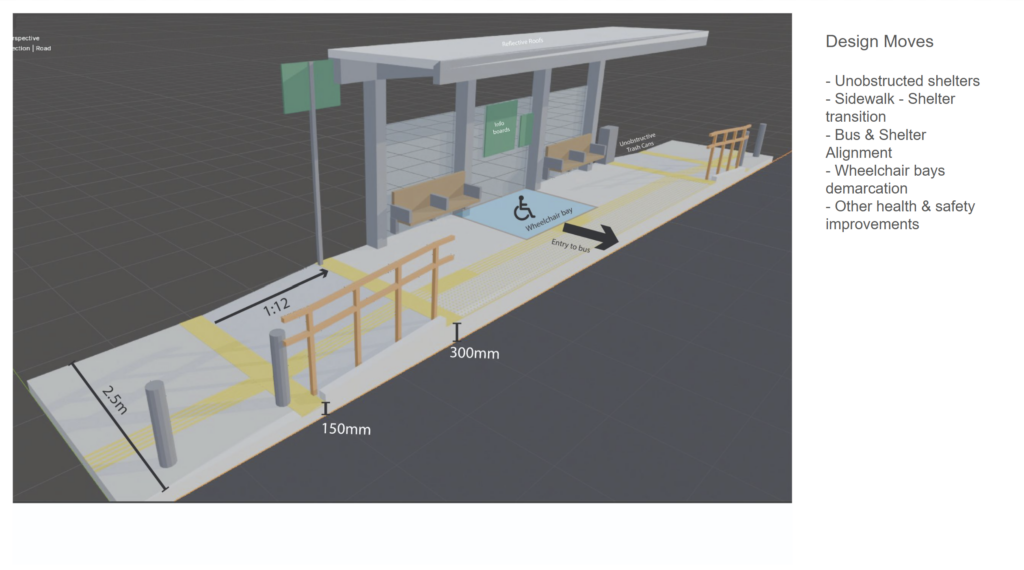
The team identified 50 high-frequency stops and analysed the state of these bus stops. They highlighted that standard bus stop platforms built around 150mm high against a low-floor bus height of roughly 400mm, force ramp gradients as steep as 1:6, against a recommended minimum of 1:12. The team built a rendered model, “Bus Stop for ALL”, with a 250mm platform height, a contiguous sidewalk-to-shelter surface rather than a shelter dropped onto the pavement, and driver-alignment markers to help buses consistently pull up at the ramp.
Key Themes Across the Day
A pattern emerges around Chennai’s investment priorities, where isolated bus stop infrastructure gets attention, while footpaths, integrated design with surrounding roads, and wheelchair access lag far behind. Even where ramps or accessible infrastructure exists, it is often unusable, encroached upon, or poorly maintained. This shows up in the numbers, where roughly half of schools and PHCs lack transit access within 400 metres, and long stretches of OMR fall over a kilometre from the nearest stop, pointing to a persistent last-mile connectivity problem in many areas.
This disconnect extends to well-connected hubs as well: being well-connected doesn’t mean being well-integrated. A hub can have every mode converging in one place and still be hard to actually use, thanks to poor coordination, a lack of pedestrian infrastructure, or counterintuitive crowd management techniques.
The direct involvement of Mr. Sathish (Sathish on Wheels) and the Disability Rights Alliance helped conversationsabout accessibility, with user anecdotes and practical lived experience. From the angle of a ramp to how a cane catches on certain tile designs and materials. It was also pointed out how accessible infrastructure benefits everyone, including elderly commuters, people with walkers or strollers, and women and children.
Finances and budgets were front of mind as teams proposed solutions and implications. Team 2 spoke of “low-hanging fruit” zones and framed its findings for “a decision maker on budgets and fiscal spending,” pointing to boosted feeder-bus routes as a “minimum budget” fix for last-mile gaps. Team 6 took a similar approach in its bus stop design, aiming for something easily replicable and buildable with minimum resources.
Vaidya R of OpenCity noted that “while cities prioritise private vehicles in terms of infrastructure it was refreshing to see people show up and reinforce the focus on public transport, with a focus on making bus stops and metro/MRTS stations more accessible for pedestrians as well as for the disabled.
According to Santhosh Loganaathan, founder of Nagariyal Research and Action Foundation, “public transport is the answer to a lot of problems our city is facing right now: traffic congestion, poor air quality, unsafe streets, etc. But do we understand where our public transport system works well and more importantly — where it fails? This datajam witnessed people from different walks of life coming together with passion and curiosity to understand Chennai’s public transport systems a bit better — through data.”
“I was glad to see one of the teams working on a design standard for universally accessible bus stops with guidance from Mr.Sathish, a wheelchair user and a representative of the Disability Rights Alliance — who has been relentlessly advocating for universally accessible bus stops in Chennai. Despite Chennai having more than 40% of its buses as low-floor buses—the highest in the country—our bus stops remain inaccessible for persons with disabilities,” he added.
Kavipriya, representing CAG Chennai noted that “spaces for adults and professionals who care about the city to come together and discuss some of the problems we face collectively are rare. It was heartening to witness Open City’s Public Transport Data Jam operate today as such a space.”
Achuthan TD, researcher at Asar added that “the Chennai Public Transport Datajam demonstrated the transformative power of open data and civic collaboration. By bringing together transport planners, data technologists, and passionate citizens who care deeply about how Chennai moves—whether on foot, by bus, metro, or suburban rail—we were able to look at the city’s mobility ecosystem holistically. The workshop highlighted not just how these modes complement one another, but critically exposed the blind spots caused by inaccessible or undecipherable data.”
Lokesh P, of Poovulagin Nanbargal felt that “public transport is not just about moving people from one place to another; it is about building a city that is accessible, equitable and climate-resilient. Chennai has a diverse public transport network, but to understand whether it truly serves everyone, we need reliable and accessible data. The Public Transport Data Jam showed how open data can help us identify gaps in connectivity, accessibility and service, and turn them into meaningful conversations and solutions. Bringing together people from different backgrounds to look at the same city through data is an important step towards making Chennai’s public transport more inclusive, efficient and sustainable.”
For Sooraj EM, ITDP, “it was inspiring to see technical experts and mobility enthusiasts come together to tackle Chennai’s public transport challenges through evidence-based solutions in the Data Jam event hosted by Oorvani foundation. Teams explored accessibility from multiple angles — from school connectivity, Public Transport Accessibility Index and strengthening multimodal interchange options to improve the commuter experience. More than anything, this workshop reaffirmed that when open data is placed in people’s hands, they don’t just study problems — they solve them together!”
Ammu Pradeep Kumar, a participant in the datajam noted that “OpenCity Data Jams have consistently provided a platform to connect with peers and local champions passionate about urban issues. This session explored the ‘good, bad, and ugly’ of public transit systems that serve the majority of our urban populations. As an urban professional working in this field, the Data Jam offered a valuable opportunity to understand diverse perspectives and experiences within a short span of time.”