The Sixth Economic census conducted in 2012-13 enumerated the businesses, type of businesses and number of people employed, male and female, in each of these businesses. The exercise was pan-India and data is available at district as well as ward-level. A previous analysis looked at Bengaluru and how the workforce is distributed. Here, we look at the data for Chennai and see how the workforce is distributed – spatially, gender-wise as well as by type of business.
Since the census was conducted in 2011, it considered the 155 wards of Greater Chennai Corporation that were in force at that time. The number of wards later grew to the current 200 taking in more areas in the surroundings. This analysis also uses the 155 wards and the ward map from that time.
The workforce in numbers
The economic census recorded 3.33 Lakh businesses in Chennai employing 7.79 Lakh (7,79,532 to be precise) workers. Only 1.64 Lakh of these workers are women. On average, a business employs 2.34 workers.

In terms of percentage, men make up close to 79% of the workforce, and women 21%. The census did not record genders other than male and female.

Where is the economic activity in Chennai?
Like most cities, the economic activity is concentrated in specific parts of the city. The median workforce working in a ward in Chennai was 3555 of which 752 were women. However, ward 65, Koyambedu had the highest concentration of businesses and workforce with a total of 59,500 workers.
In terms of businesses too, the median number of businesses per ward is 1612, but Koyambedu tops with just over 29,000 businesses.

In terms of women workers too, Koyambedu has the most number of women workers at 18,000.

Where are the workers employed?
Looking at the split of workers by type of business, more than half (53.14%) are in retail trade, or in shops, followed by manufacturing at 12.54%. What it means is that while every other worker workers works in a shop, only every eighth worker is in manufacturing. The third sector is “accommodation and food”, basically hotels, restaurants and catering, followed by repair and other services.
Basically, the economy is heavily service oriented with manufacturing being a small portion. In manufacturing, close to half the workers are in businesses manufacturing apparel or food products.

In terms of people employed, most of these sectors continue to have a similar percentage as the overall businesses numbers for Chennai – around 21%. Only manufacturing, and repair, do marginally better than the city average.

Ward 65 – Koyambedu
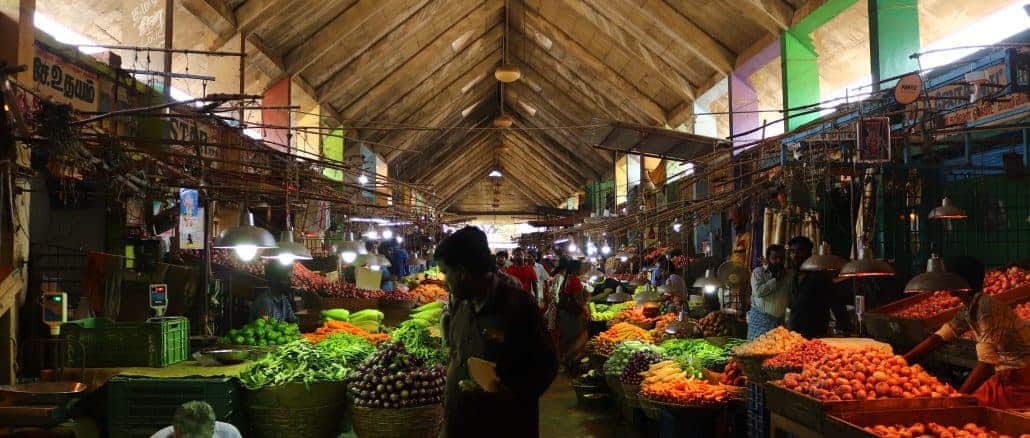
Koyambedu boasts a wholesale market which is considered one of the largest in Asia. The presence of this market as well as second order effects from this market means that Koyambedu has the largest number of businesses as well as employs the most number of workers in Chennai by a distance.
There are 59,500 workers of which 41,448 are men and 18,052 are women. The median number of workers per ward is 3,552 in the rest of Chennai.

Compared to the city as a whole, women form a much larger part of the workforce at 30%.

Retail trade is the predominant type of business employing workers, thanks to the wholesale markets in the area. It employs close to 92% of the workforce. Among women, 95% of the women are employed in retail trade.

Conclusions
The economic census provides valuable insights on the workforce in a city – the make-up, where people are working, and what type of businesses. From a state government’s perspective, it can guide where investments need to happen – for eg, to push for more manufacturing in specific sectors vs push for more services.
For an Urban Local Body, the GCC in this case, the insights are along where infrastructure needs to be targeted. More people working in a specific ward means more public transport and other necessary facilities like toilets, anganwadis, child care centres and clinics/hospitals will be needed to cater to that workforce.
It has been 12 years since the last economic census. The 7th economic census was conducted in 2019, but, even after five years, the data has not been made public yet. It would provide interesting insights on how the economy has shifted during the last decade, especially with the rise of e-commerce and the delivery economy.

