The National Crime Records Bureau (NCRB) published its report for the year 2021. This report includes
– Crime statistics across India
– Accidents statistics across India. This includes road accidents, railway accidents and railway crossing accidents.
– Suicide statistics across India. This includes information about change in rate of suicides in the population over the years, means and methods employed, causes, socio-economic and educational distribution, among others.
All the above statistics are presented at the national level, as well as split by States and UTs. The data is also available for 53 major Indian cities.
What does this data say about road accidents?
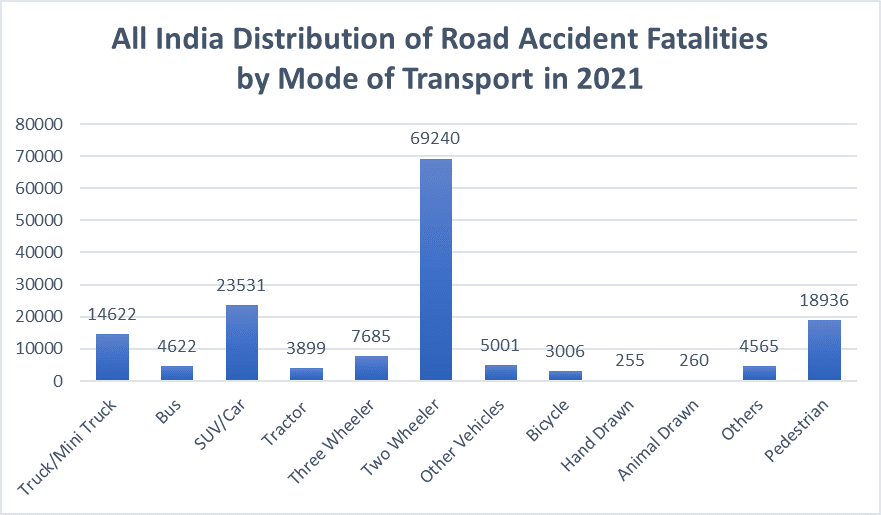
According to this data, there were 4,03,116 road accidents that occurred in India in 2021. These accidents caused 1,55,622 fatalities and left 3,71,884 people injured. Of these fatalities, the type of vehicle most in use were two-wheelers which accounted for close to 45% of the fatalities, followed by SUVs/cars at 15% and pedestrians at 12%.

How does Bengaluru fare?
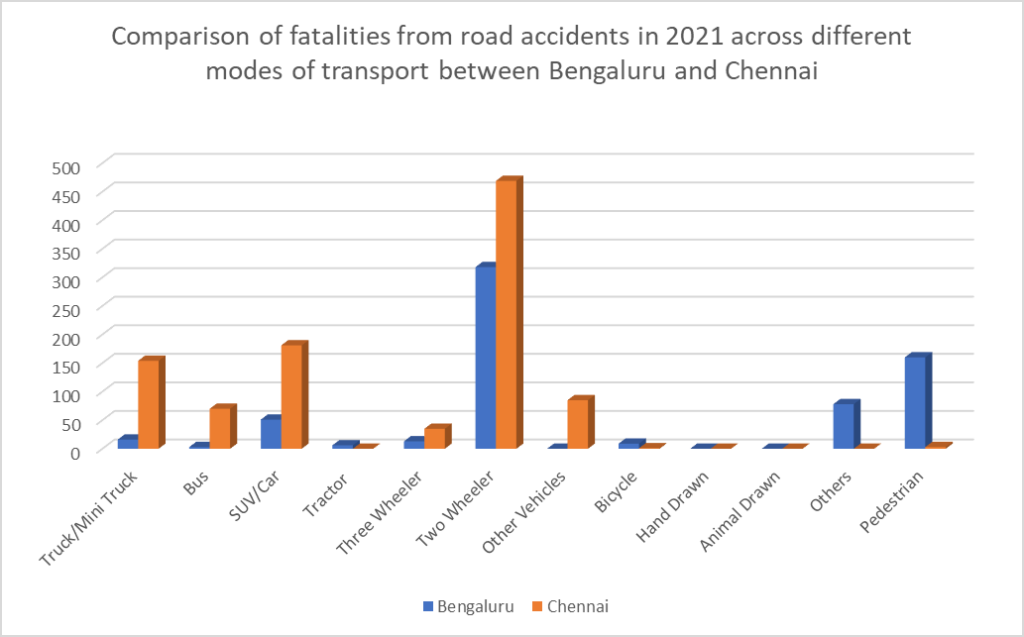
In 2021, Bengaluru recorded 3213 road accidents which resulted in 654 fatalities and left 2,820 injured. Similar to the rest of the country two-wheelers accounted for a majority of deaths. 318 of the 654 fatalities were from accidents involving two-wheelers. However, the more distressing part is that 160 of the 654 fatalities, close to a quarter, were pedestrians. This is a significant departure from the rest of the country where only 12% of the fatalities were pedestrians.

Amongst the common modes of transport, buses in Bengaluru account for only 3 fatalities and are the safest mode of transport. Cars/SUVs make up less than 10% of the fatalities, which is significantly less than the all India figure of 15%. This trend is seen across all vehicles that have more than two wheels, which seems to suggest that poor road conditions might be a major contributing cause for road accidents in Bengaluru, while preventing deaths in larger vehicles by reducing speed of travel.
However, the cause of road accidents identified by the same report lists over-speeding as the most significant contributor to fatalities – 601/654, followed by “dangerous driving/overtaking” at 34 and “driving under the influence” at 19. However, the report “Crime in India 2021” by NCRB lists 30 incidences and 31 deaths under the heading “Deaths due to Negligence of Civic Bodies”. It is not clear whether pothole related deaths were counted in this column or if this also includes incidents like electrocution.
Comparison with Chennai
Comparison of proportions of accidents from different modes of transport against the whole can be misleading as an increase in one category can push down the proportion of others. Comparison with Chennai, a city of similar population as Bengaluru can give us further insights.
Chennai recorded 5034 road accidents and 998 fatalities in 2021, making it the city with the most number of road accidents. Unlike Bengaluru, however, one of the main contributors was large vehicles. Trucks, buses, cars, SUVs and three-wheelers constituted 44% of the fatalities in Chennai as against less than 14% in Bengaluru. The all India proportion for the same is 35%. Of this, Cars/SUVs and trucks accounted for the largest share taking up 33% of the total accidents. The proportion for Bengaluru and all India were 10.24% and 24.5% respectively.
Interestingly, Chennai recorded only 3 pedestrian deaths in 2021 as against Bengaluru’s 160. Such a low number in an Indian city needs to be considered as extreme data. Even accounting for poor reporting, the number of pedestrian deaths in Chennai is likely to be lower than Bengaluru. Chennai does seem to be better suited for walking than Bengaluru.
The comparisons with all India and Chennai emphasizes the lack of infrastructure for pedestrians in Bengaluru. The Department of Urban Land Transport(DULT), Government of Karnataka’s report on Bengaluru’s mobility indicators, based on the 2011 census, found that 25% of the city’s population walks to work, and the same proportion commutes by two-wheelers.

Given that close to half of the city’s population commutes either by two-wheelers or by walk, it is absolutely imperative that the government focuses on road safety for two-wheelers and pedestrians. Pothole free roads, accessible footpaths and safe road-crossing facilities for pedestrians would go a long way in making Bengaluru a safer city.
How the data is organised?
The dataset “National Crime Data 2021” contains the following data in different formats:
- Crime data has been put out by NCRB in 3 Volumes, and all 3 Volumes have been uploaded to the dataset as “Crime in India 2021 – Volume 1“, “Crime in India 2021 – Volume 2” and “Crime in India 2021 – Volume 3“. These files are in the original pdf format and are a compilation of all registered crimes in India. They also contain information about road-accidents and their causes where an FIR was lodged with the law and order police. This is of importance when looking for issues like negligence that caused accidents and deaths.
- Road and railway accidents, and suicides data are in one pdf called “Accidental Deaths and Suicide Data 2021“. Many of the tables from this file have been consolidated into csv files:
- Total traffic accidents in India. This contains split-up of all accidents into road accidents, railway accidents and railway crossing accidents. Each such column includes data of number of cases, number injured and fatalities. These accidents are further split along rows into States and UTs. States and UTs data adds up to the all-India data. They are also split up along 53 major cities. But note that adding this data does not add up to all-India level.
- Total road accidents in India by cause. This contains split-up of road accidents by cause – dangerous driving, overspeeding, DUI, weather conditions, etc, and the number of injured and fatalities from each. The data is also distributed across States, UTs and 53 Indian cities.
- Total road accidents in India by mode of transport. This is an important set of data where the road accidents are split by the vehicles that were involved in the accidents, and the number of injured and fatalities from each. This data is also distributed across States, UTs and 53 Indian cities. This data can give you important insights into how safe different modes of travel are in different cities or states.
- Total road accidents in India by type of road. This contains split-up of road accidents by type of road – what kind of roads contributed how much to road accidents in India. It is also distributed along States, UTs and 53 major Indian cities. This data can give you important insights on where accidents are happening the most. The data seems to implicate local roads as the largest contributor to accidents followed by NHs and SHs.
- Total road accidents in India by time of occurrence. This contains split-up of road accidents into times of occurrence by splitting the day into eight 3-hour slots. It is also distributed along States, UTs and 53 major Indian cities. As one would expect, most accidents seem to happen during peak hours, with evening peak hours, especially between 6 PM and 9 PM, claiming more accidents than the morning ones.
- Tables on Suicides data have also been pulled into different csvs.
- Suicides in India – Causes, Age and Gender. The data is distributed along causes of suicide, along the rows. These causes are distributed first by different age-groups, and then by gender, in the columns. Family problems and illnesses are found to make up the bulk of the causes for suicides.
- Suicides in India – Mass and Family Suicides. This data is about mass and family suicides and is split along the marital status of those who committed suicide. It is also distributed along the states, UTs and cities.
- Suicides in India – Means and Methods. This data is the number of suicides distributed on one axis along the means and methods employed to commit suicide, and gender on the other axis. It also gives you the percentage share of different methods employed. Death by hanging (57%) and by consuming a poisonous substance (25%) account for 82% of the suicides in India.
- Suicides in India – Profession-wise distribution. This data is the number of suicides distributed one one axis along the professions of those who committed suicide, and gender on the other axis. It also gives you the percentage share of different professions. Daily-wage workers and housewives seem to be the most affected categories.
- Suicides in India – socio-economic and education-wise distribution. This data is the number of suicides distributed across socio-economic status and gender, along with the percentage share for each socio-economic indicator. It also contains the same distribution for education level vs gender and percentage share.
- Married persons constitute 67% while 24% were unmarried. This needs to be correlated with percentage share of married vs unmarried in the total population before drawing any conclusions.
- The data also shows that those earning less than 1 lakh per annum constituted 64% of those who committed suicide. Again, this data needs to be correlated with total population level data.
- When it comes to education level, those with a Diploma and above make up 6% of the share of those committing suicide. This needs to be correlated with nation-wide education data to draw more conclusions.
- Suicides in India – Rate of suicides by state/UT and city. This data lists the number of suicides, rate of suicides (number of suicides/per lakh of population) for all the states and UTs, as well as 53 Indian cities. It also compares the data with the 2020 level. The highest is noted to be Sikkim with 39.2 suicides per lakh population. Kerala and Telangana follow, at 26.9 suicides per lakh population. Among cities, Kollam in Kerala registers 43.9 suicides per lakh population with a total of 487 suicides in 2021.
- Suicides in India – Rate of Suicides from 2011 to 2021. This data lists the number and rate of suicides in India from 2011 to 2021. There seems to be very little variation in the rate over the decade, staying between 10 and 12 suicides per lakh population.