All Articles
-
Explainer: National Time Use Survey Data 2024
The National Time Use Survey (TUS) is a periodic survey conducted across the country by the National Statistics and Surveys Office (NSSO), Ministry of Statistics and Program Implementation (MoSPI), Government of India. The most recent… Continue reading
Posted in: Explainers -

State of Under Construction Road Works in Bengaluru – 2025
A week back, OpenCity conducted a survey to crowd-source all the under construction road projects in Bengaluru. The goal was to first see how many such projects are lying around in the city and then… Continue reading
Posted in: Analysis -
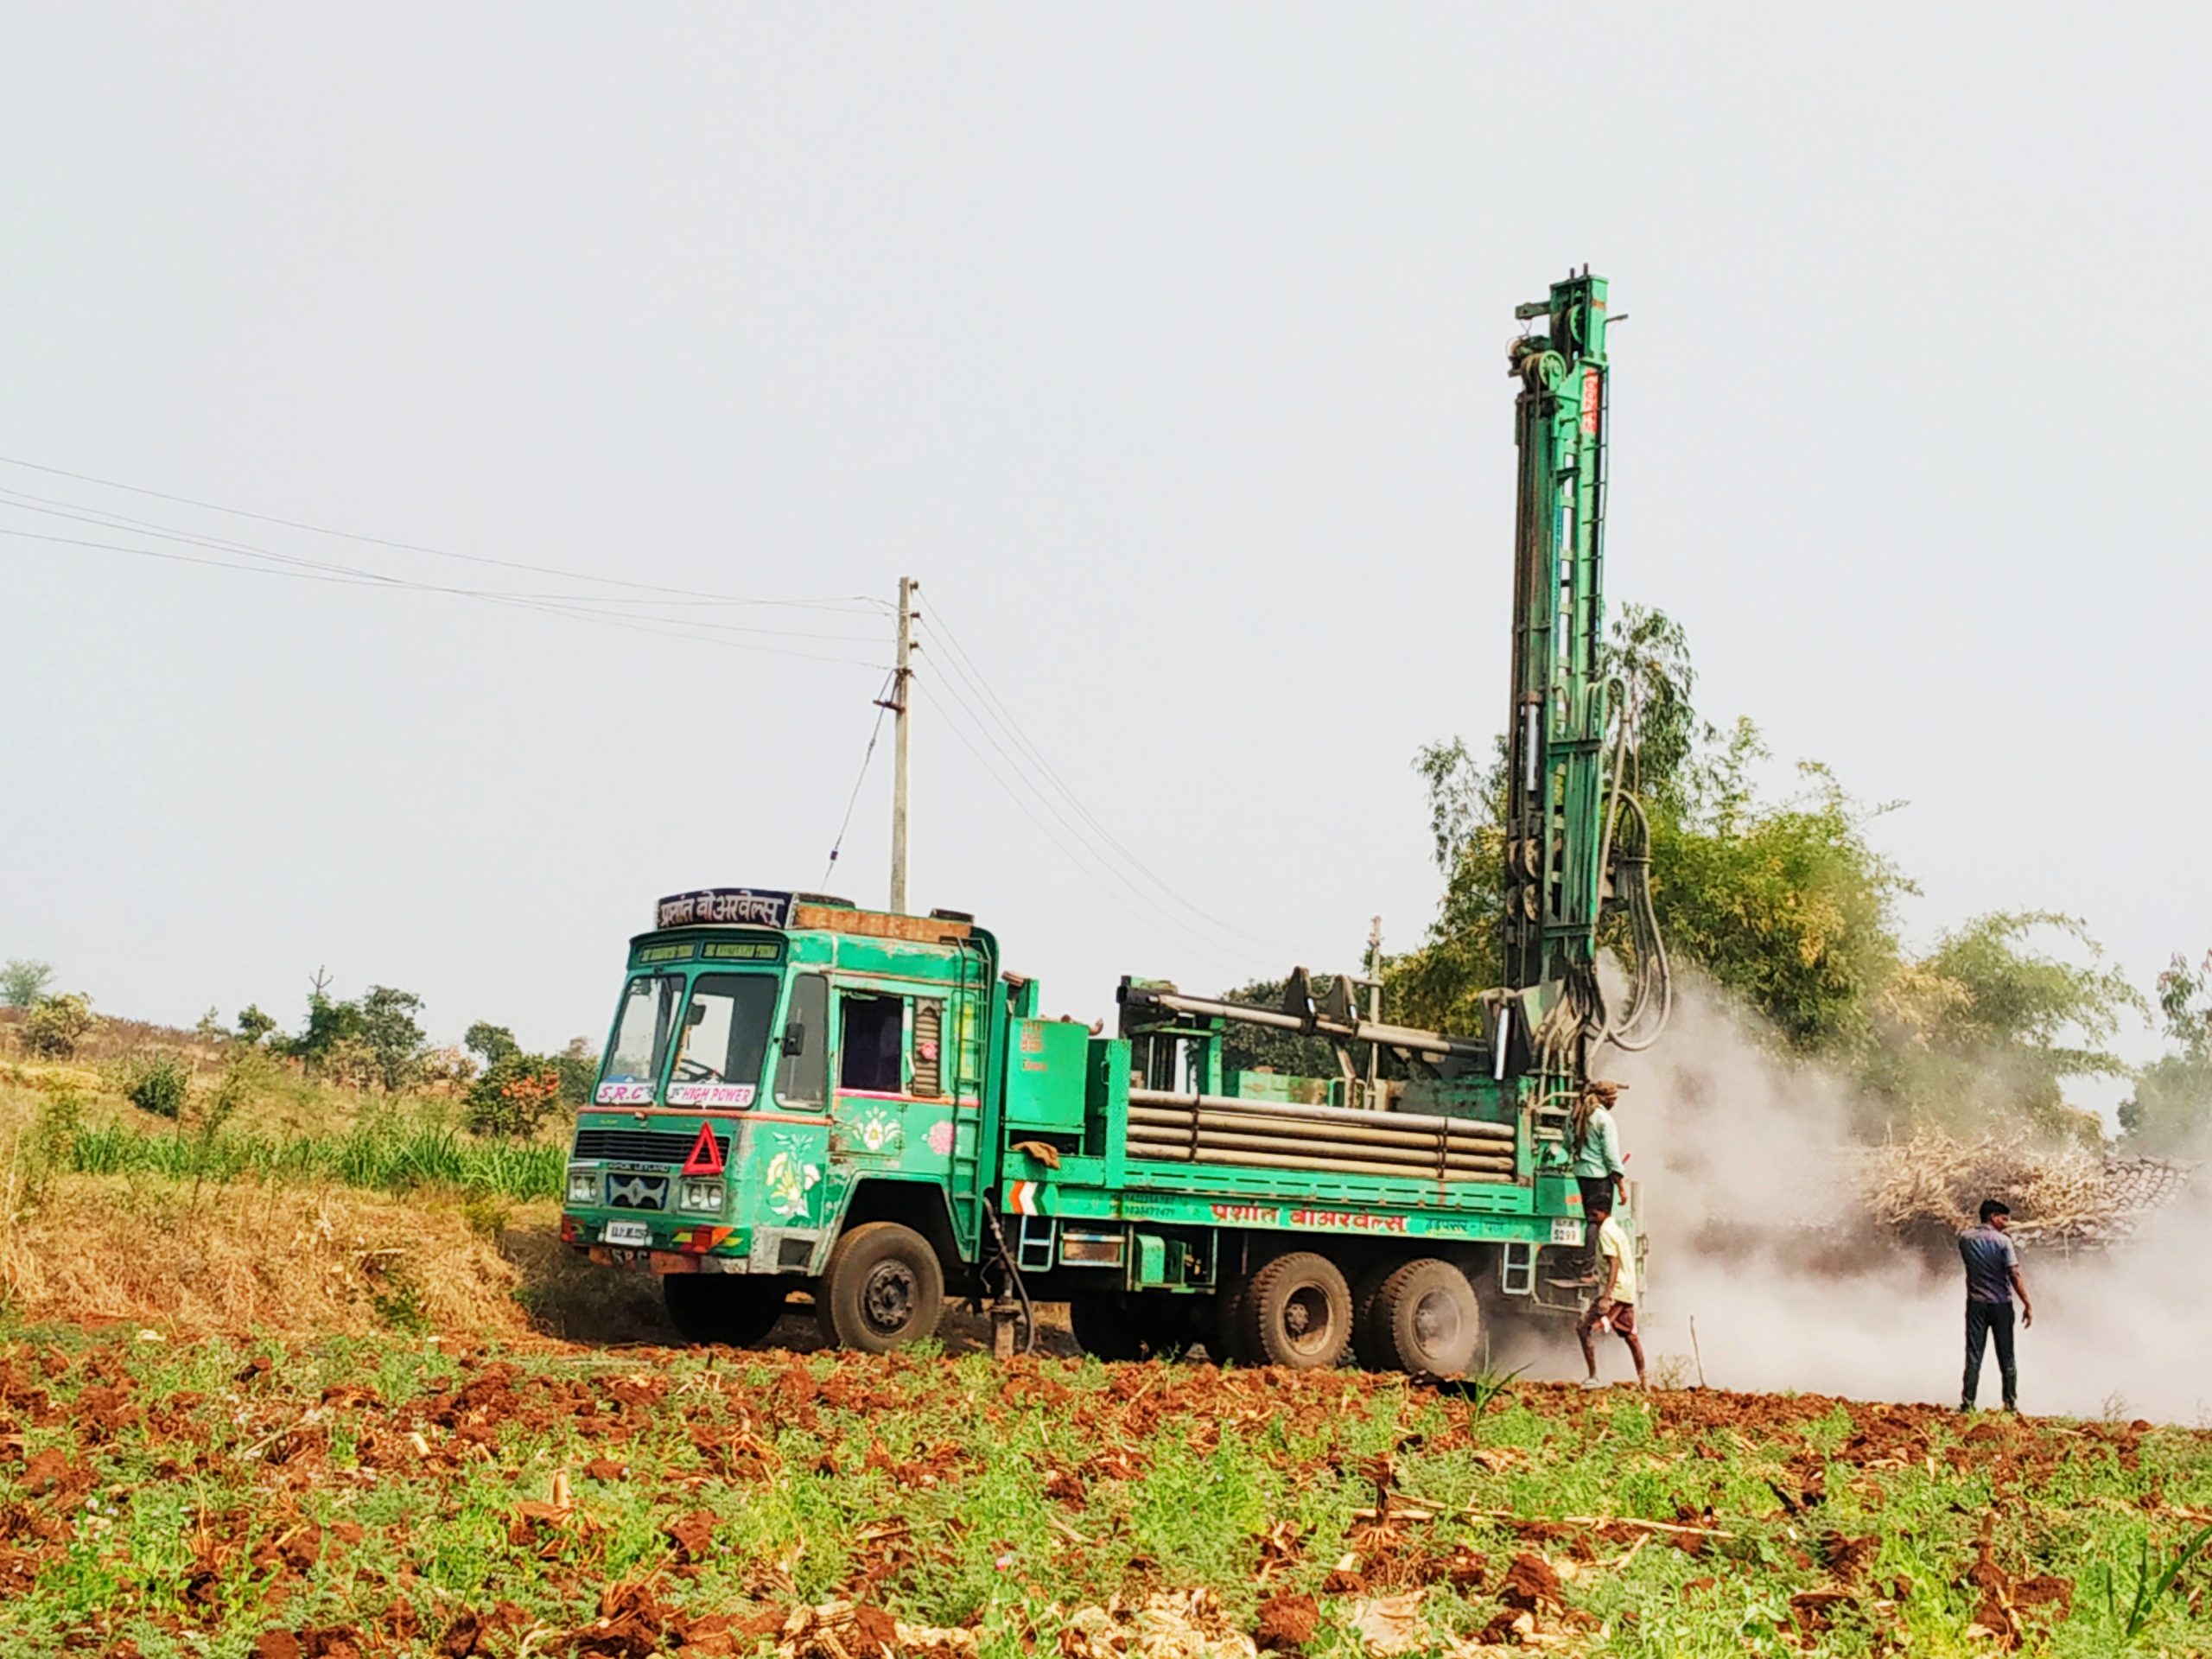
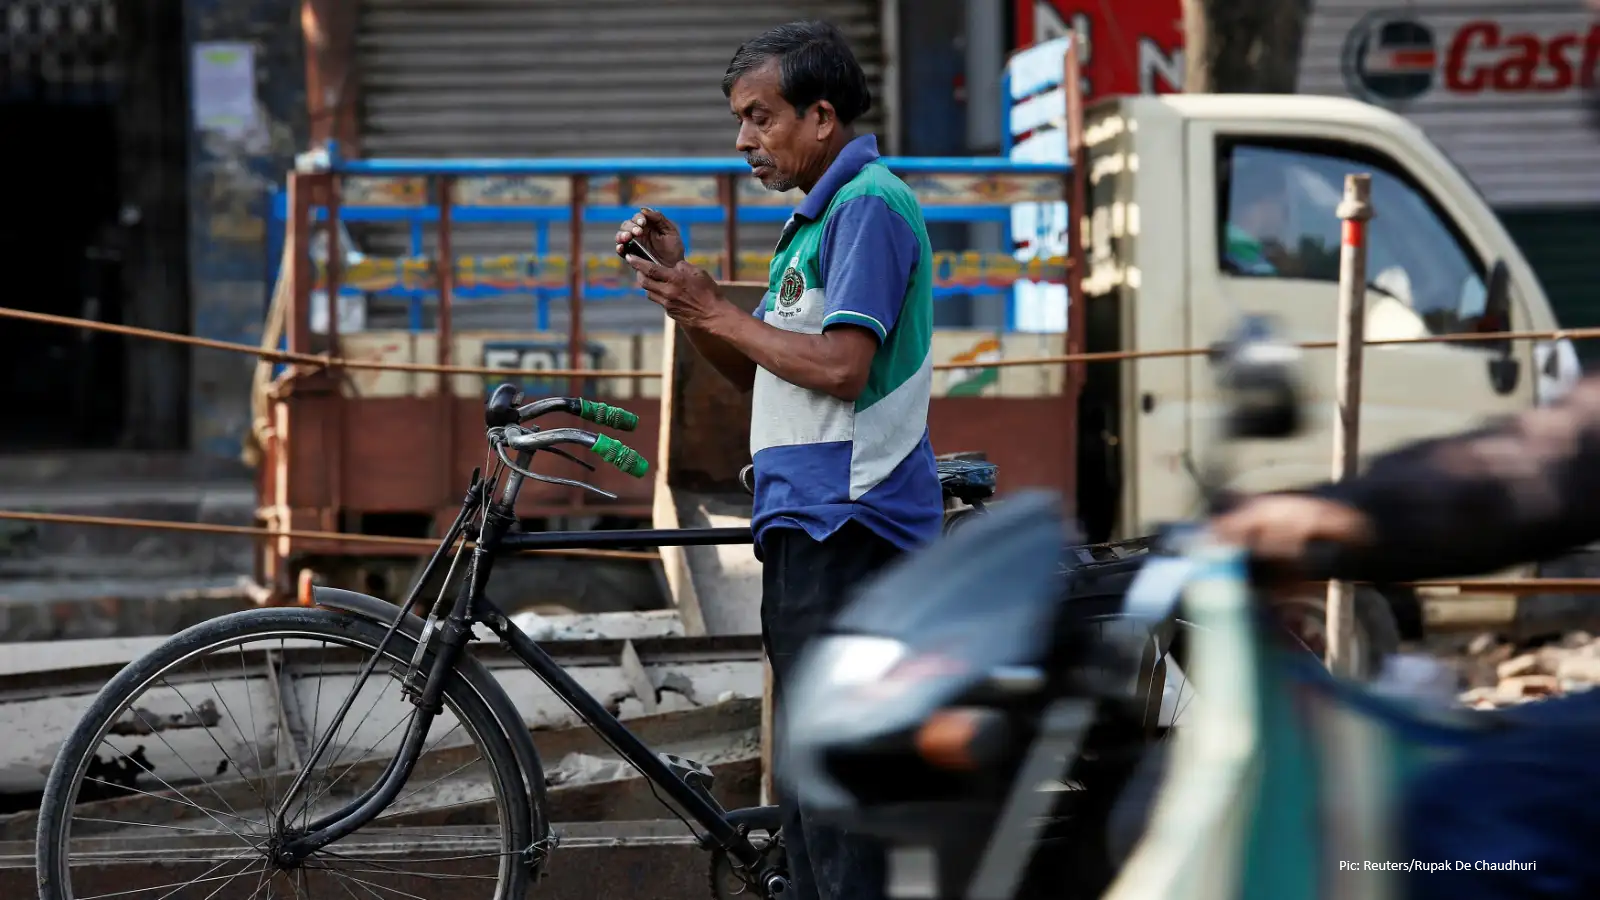
State of Groundwater Usage in Indian Cities in 2024
The “National Compilation of Dynamic Ground Water Resources of India” is an annual report published by the Central Ground Water Board under the Ministry of Jal Shakti, Government of India. The latest report, for 2024… Continue reading
Posted in: Analysis -
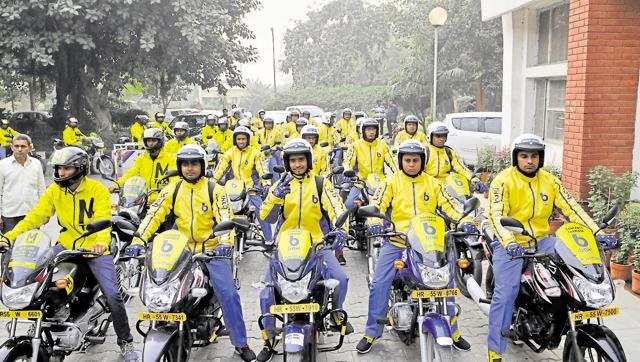
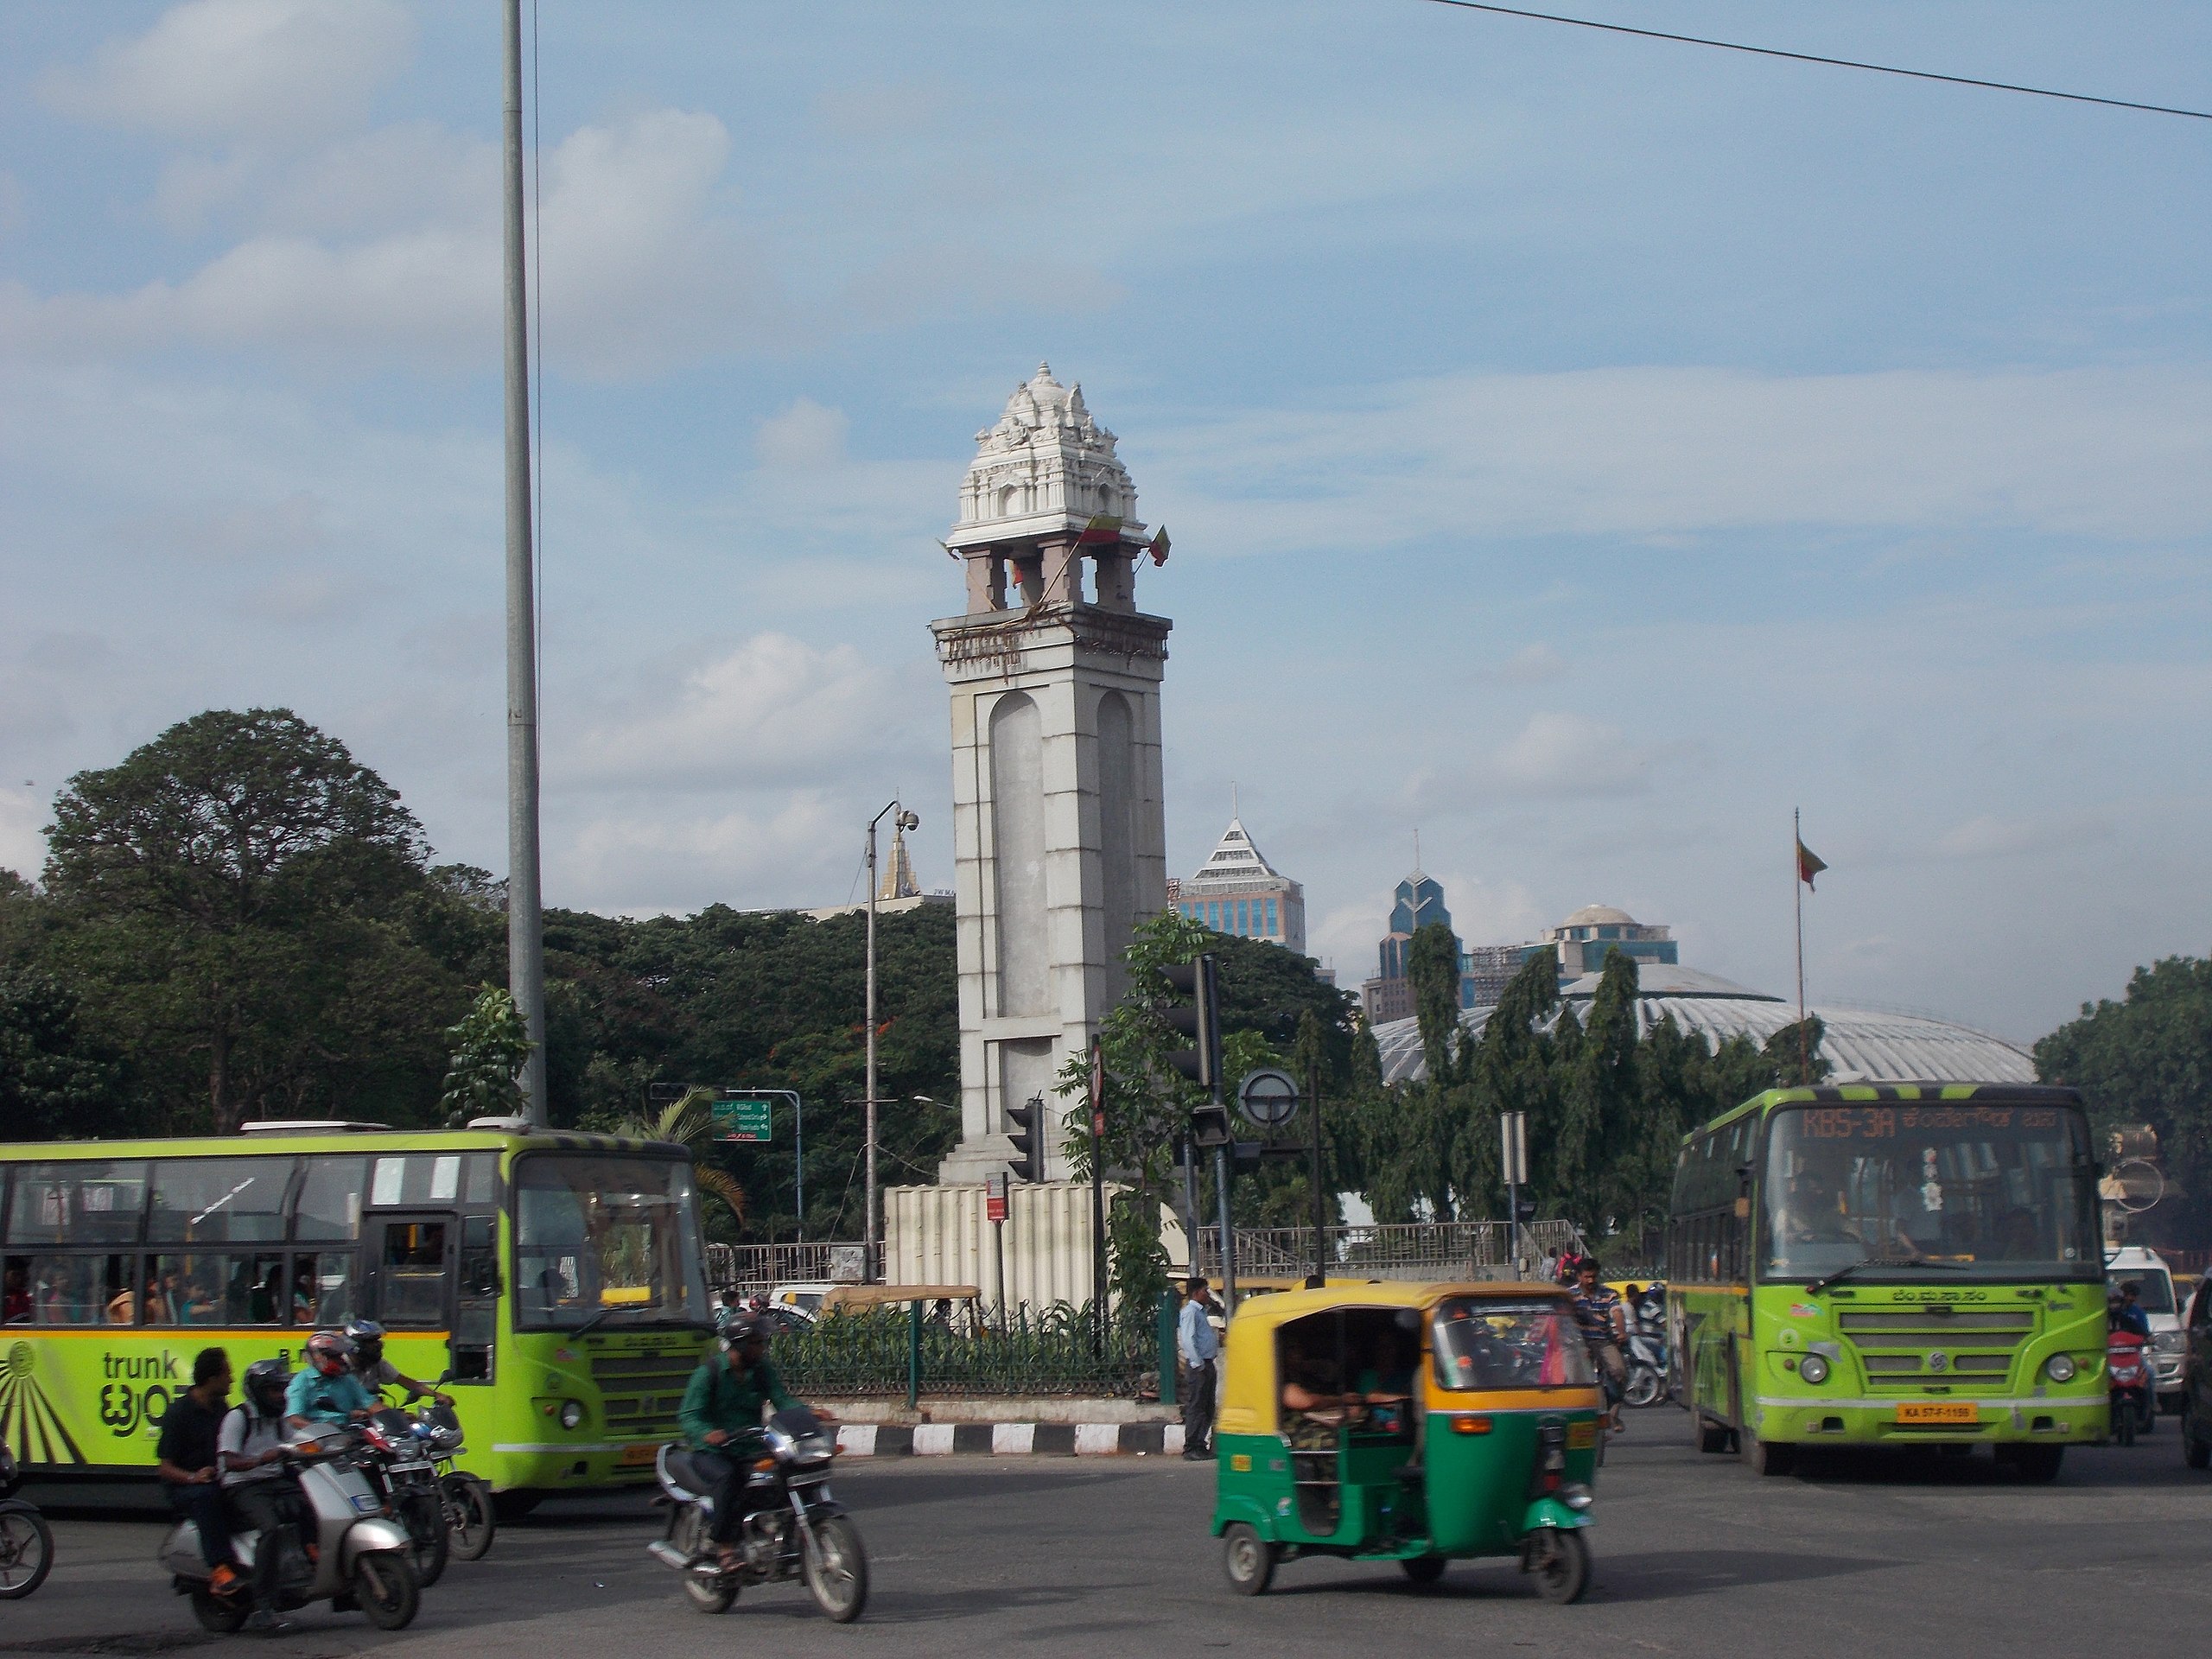
Analysing BMRCL’s Report on Introducing Bike Taxis in Bengaluru
In 2018, Bengaluru Metro Rail Corporation Limited (BMRCL) was tasked by the Government of Karnataka to evaluate bike taxis as a possible public/shared transport. Basically, the report set out to ask the question – should… Continue reading
Posted in: Analysis -
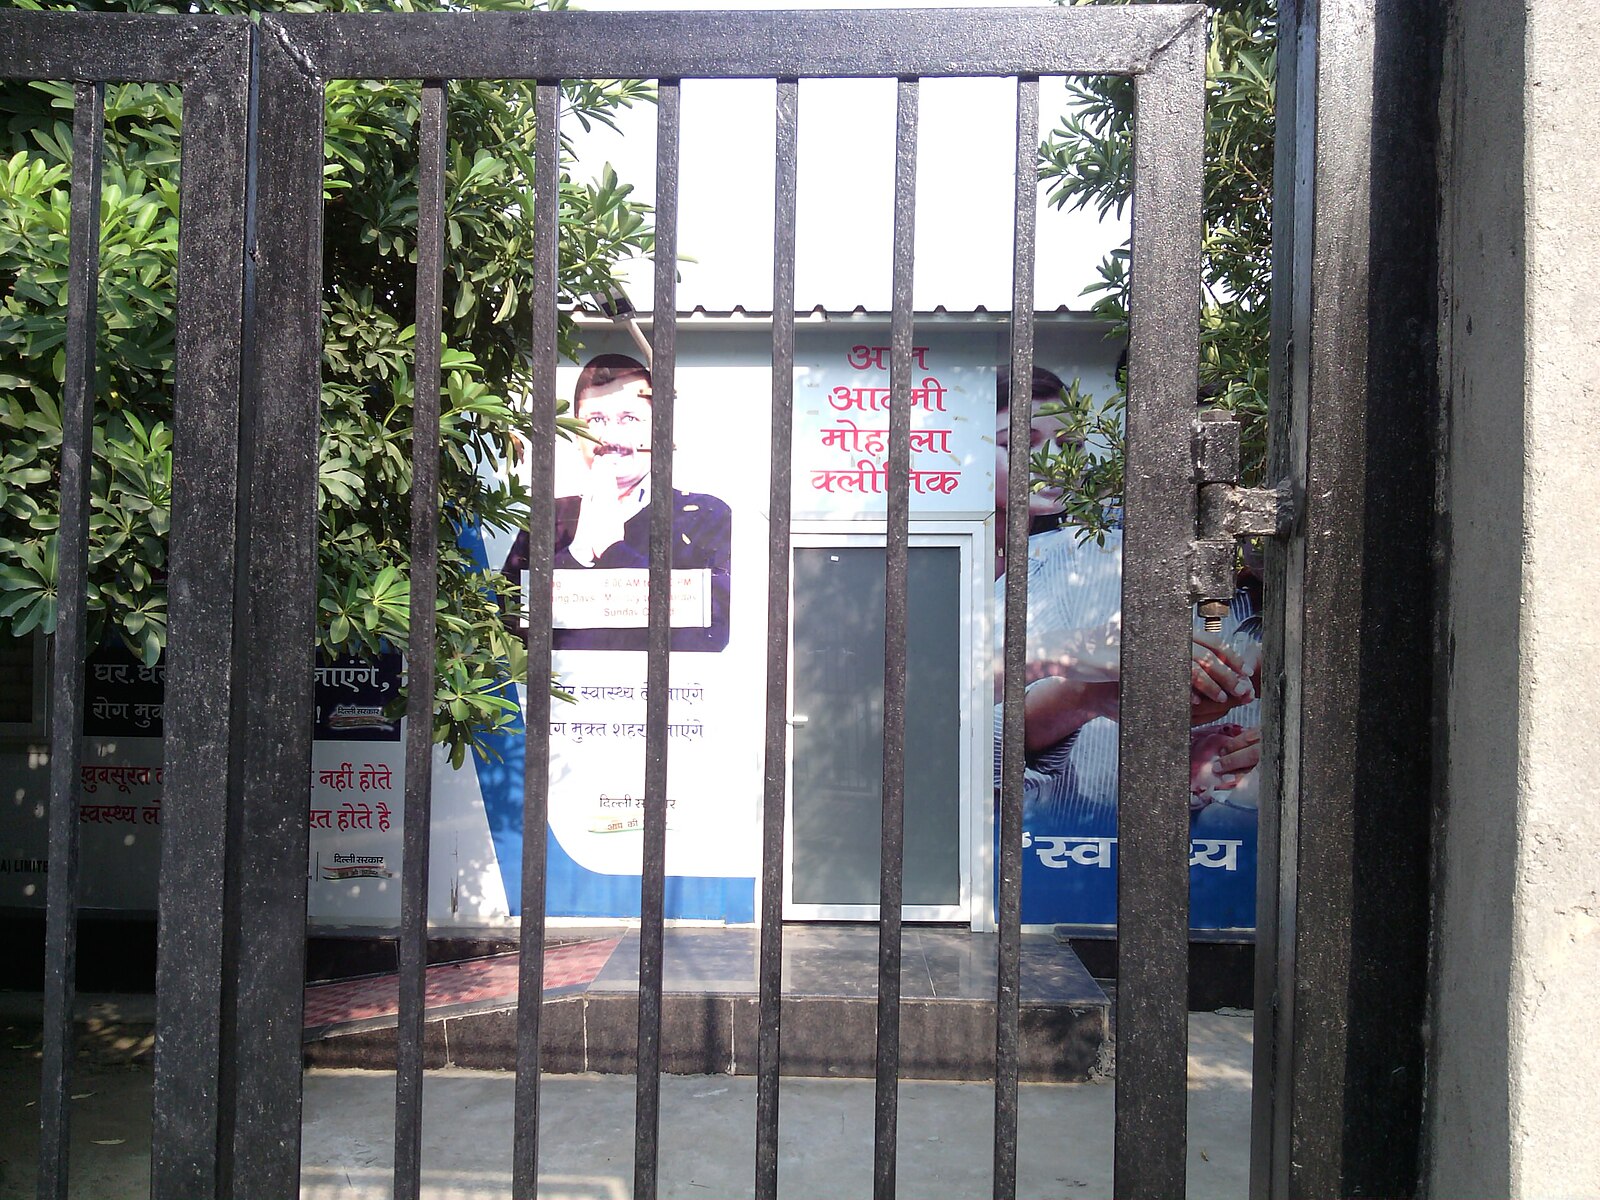
Delhi Slums – A Comparative Look at Social Infrastructure
The city of Delhi, a bustling metropolis and the capital of India, exhibits a contrasting landscape, with pockets of affluence set against areas of urban deprivation. One of the most pressing challenges faced by Delhi… Continue reading
Posted in: Analysis -
Delhi Slums – A comparative look Into Public Facilities
Introduction Slums, characterized by dense and informal settlements, typically suffer from a lack of basic infrastructure and public facilities. In general they often face significant deprivation in comparison to the other areas in a city.… Continue reading
Posted in: Analysis -
Chennai’s Climate Action Plan Identifies the Risks for the City and Proposes Mitigations
The Chennai Climate Action Plan was prepared by the Greater Chennai Corporation (GCC) in consultation with experts from several different fields, and released by the Tamil Nadu Government on 13th June, 2023. The GCC released… Continue reading
Posted in: Analysis -
Delhi Slums – A comparative look into Physical Infrastructure
Introduction Looking into typical development trends in Indian urban settings, there is wide disparity in terms of the supply of necessary infrastructure based on spatial and socio-economic status of the localized areas in cities. Slums… Continue reading
Posted in: Analysis -
BBMP – Work Orders, Budgets and Processes Datajam – July 2023
Bruhat Bengaluru Mahanagara Palike (BBMP) is the governing body for a large area under Bengaluru Urban district. It administers an area of 712 sq. km with a population of close to 10 million. After the… Continue reading
Posted in: Jams -
Analysis of DPR for the Sarakki Flyover at the Kanakapura Road-ORR junction
The junction of the Outer Ring Road (ORR) and Kanakapura Road at Sarakki is one of the busiest junctions in Bengaluru and there have been repeated calls from commuters and the traffic police to ease… Continue reading
Posted in: Analysis -
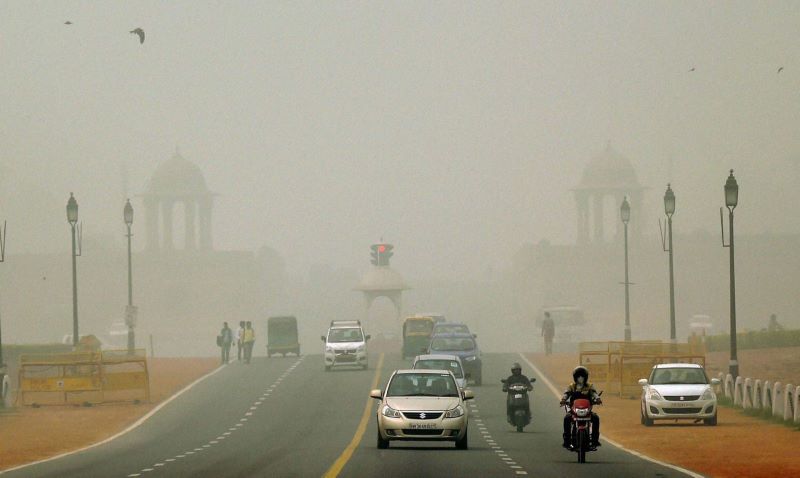
What Delhi’s Climate Action Plan Says About Risks for the City
The Delhi Climate Action Plan is prepared by the Government of National Capital Territory (NCT) of Delhi. The plan identifies the risks that the city faces due to climate change, the vulnerabilities of different socio-economic… Continue reading
Posted in: Analysis -
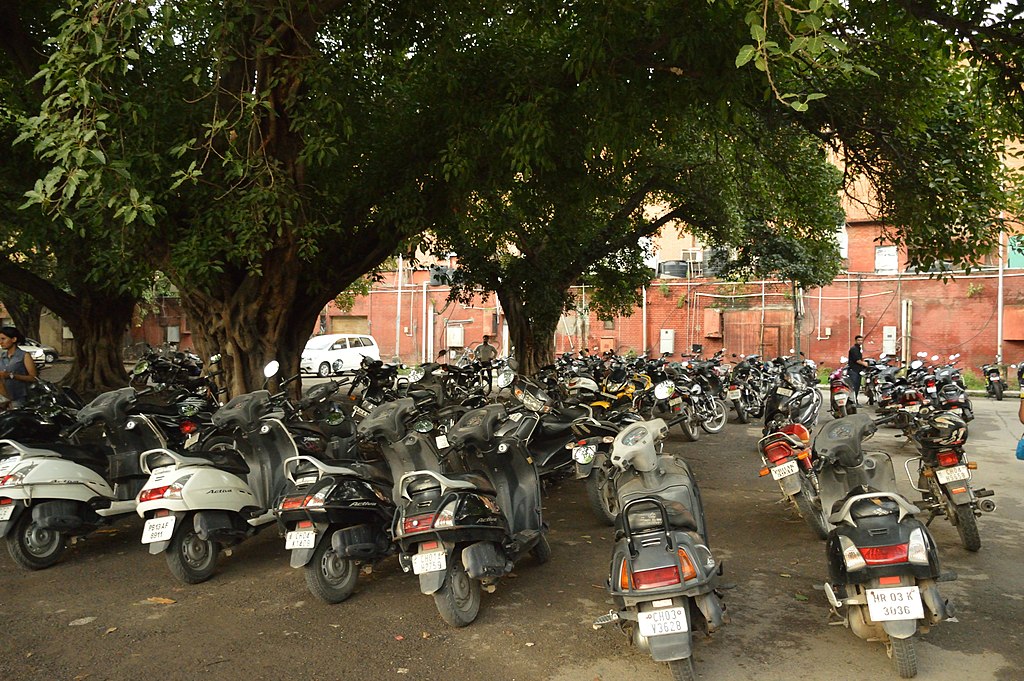
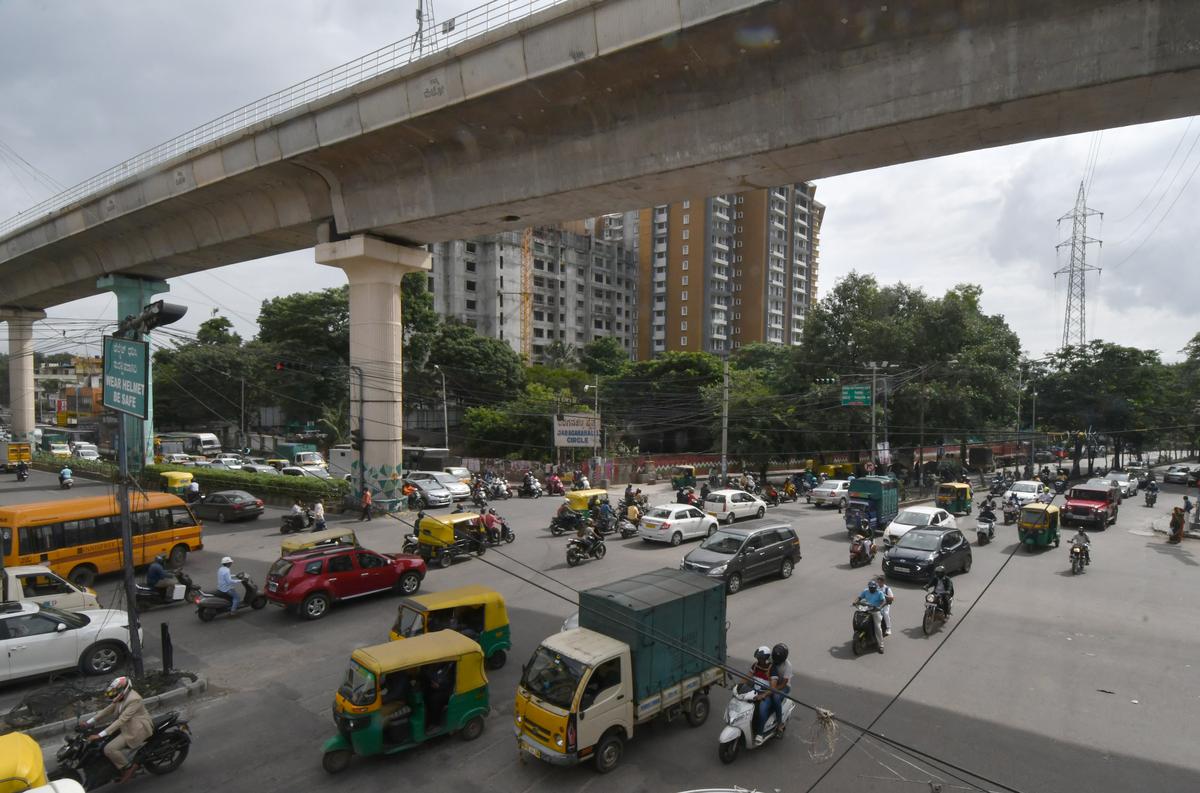
Analysing Two-wheeler Sales Data in Bengaluru and Karnataka
One of the common complaints in Bengaluru every time the issue of traffic is discussed is how the number of private vehicles is increasing rapidly while the public transport has not kept pace. As much… Continue reading
Posted in: Analysis -
What BBMP’s Work Orders Reveal About How Money was Spent
Problem Statement How has BBMP’s spending on different categories varied across assembly constituencies in the past 5 years? Data Sources BBMP’s work orders data for each of the 198 wards from OpenCity.in was the main… Continue reading
Posted in: Analysis -
Analyzing the pro-incumbency in Bengaluru
Going into the election last week, an analysis in Citizen Matters by Deep C and Srinivas Alavilli had found that 16 of the 28 MLAs in Bengaluru had been in their seat since 2008. 22… Continue reading
Posted in: Analysis -
How to access the Karnataka Legislative Assembly Proceedings
Proceedings in the legislative assembly are not only an important part of our democratic process, but also help us understand how our MLAs have been doing in the past 5 years – what issues have… Continue reading
Posted in: Explainers